CPD
10, 341–380, 2014Evidence from Tree rings
Y. Zhang et al.
Title Page
Abstract Introduction
Conclusions References
Tables Figures
◭ ◮
◭ ◮
Back Close
Full Screen / Esc
Printer-friendly Version Interactive Discussion
Discussion
P
a
per
|
D
iscussion
P
a
per
|
Discussion
P
a
per
|
Discuss
ion
P
a
per
Clim. Past Discuss., 10, 341–380, 2014 www.clim-past-discuss.net/10/341/2014/ doi:10.5194/cpd-10-341-2014
© Author(s) 2014. CC Attribution 3.0 License.
Open Access
Climate of the Past
Discussions
This discussion paper is/has been under review for the journal Climate of the Past (CP). Please refer to the corresponding final paper in CP if available.
Millennial Minimum Temperature
Variations in the Qilian Mountains, China:
evidence from Tree rings
Y. Zhang1, X. Shao1, Z.-Y. Yin1,2, and Y. Wang1
1
Institute of Geographic Sciences and Natural Resources Research, Chinese Academy of Sciences, Beijing 100101, PR China
2
Department of Marine Science and Environmental Studies, University of San Diego, San Diego, CA 92110, USA
Received: 14 December 2013 – Accepted: 11 January 2014 – Published: 21 January 2014
Correspondence to: X. Shao ([email protected])
CPD
10, 341–380, 2014Evidence from Tree rings
Y. Zhang et al.
Title Page
Abstract Introduction
Conclusions References
Tables Figures
◭ ◮
◭ ◮
Back Close
Full Screen / Esc
Printer-friendly Version Interactive Discussion
Discussion
P
a
per
|
D
iscussion
P
a
per
|
Discussion
P
a
per
|
Discuss
ion
P
a
per
|
Abstract
A 1342 yr-long tree-ring chronology was developed from Qilian junipers in the central Qilian Mountains of the north-eastern Tibetan Plateau, China. The climatic implications of this chronology were investigated using simple correlation, partial correlation and re-sponse function analyses. The chronology was significantly positively correlated with
5
temperature variables during the pre- and current growing seasons, especially with minimum temperature. The variability of the mean minimum temperature from January to August since 670 AD was then reconstructed based on the tree-ring chronology. The reconstruction explained 58.5 % of the variance in the instrumental temperature records during the calibration period (1960–2011) and captured the variation patterns
10
in minimum temperature at the annual to centennial time scales over the past mil-lennium. The most recent 50 yr were the warmest period, while 1690–1880 was the coldest period since 670 AD. Comparisons with other temperature series from neigh-bouring regions and for the Northern Hemisphere as a whole supported the validity of our reconstruction and suggested that it provided a good regional representation of
15
temperature change in the north-eastern Tibetan Plateau. The results of multi-taper spectral analysis showed the occurrence of significant quasi-periodic behaviour at a number of periods (2–3, 28.8–66.2, 113.6–169.5, and 500 yr), which were consistent with those associated with El Niño-Southern Oscillation (ENSO), Pacific Decadal Os-cillation (PDO) and solar activity. Some reconstructed cold events may have close
re-20
lationship with the volcanic eruptions.
1 Introduction
Understanding temperature variations over the past 1000 yr is imperative for evaluating the current global warming and forecasting future temperature changes. Numerous temperature reconstructions based on multiple proxies make it possible to understand
25
CPD
10, 341–380, 2014Evidence from Tree rings
Y. Zhang et al.
Title Page
Abstract Introduction
Conclusions References
Tables Figures
◭ ◮
◭ ◮
Back Close
Full Screen / Esc
Printer-friendly Version Interactive Discussion
Discussion
P
a
per
|
D
iscussion
P
a
per
|
Discussion
P
a
per
|
Discuss
ion
P
a
per
1998; Mann et al., 1999; Crowley, 2000; Moberg et al., 2005; D’Arrigo et al., 2006). However, due to the uneven distribution of sample locations, knowledge of temperature variations during the past thousand years remains poor for some areas of the world, such as the Tibetan Plateau (TP).
The TP is well known for its profound influences on both regional and global climate
5
through thermal and dynamical forcing (Ding, 1992; Manabe and Broccoli, 1990; Web-ster et al., 1998; Zhou et al. 2009). Since the mid-1950s, most of the Plateau has ex-perienced a dramatic warming of the climate (Liu and Chen, 2000), which has caused significant changes in the environmental conditions and ecosystems of this area (Yao et al., 2004, 2012; Cyranoski, 2005; Cheng and Wu, 2007; Xu and Liu, 2007).
High-10
resolution millennium-long records of past temperature variation are urgently needed to better understand recent warming trends in the TP. Tree rings are natural records with annual resolution that provide proxy data for palaeo-environmental studies and reconstructions of various climatic events (Jones et al., 2009). During recent decades, many multiple-century-long temperature reconstructions have been established for
ar-15
eas within the TP, such as the Qilian Mountains (Tian et al., 2009), the Anemaqin Mountains (Gou et al., 2007a, b), the Hengduan Mountains (Fan et al., 2008, 2009, 2010; Li et al., 2012), the Nyainqentanglha Mountains (Zhu et al., 2011a), the Tang-gula Mountains (Zhu et al., 2011b; Liang et al., 2008), the Sygera Mountains (Liang et al., 2009), and the Himalaya Mountains (Yang et al., 2009a, 2010; Cook et al., 2003;
20
Hughes, 2001; Yadav et al., 2004). However, few millennial-scale temperature series are available. Using the ring widths and stable carbon isotope ratios (δ13C) of Qilian juniper from the upper treeline, Liu et al. (2007) reconstructed the December–April temperature in the Qilian Mountains with a 3 yr resolution over the past 1000 yr. Zhu et al. (2008), using ring width data from Qilian juniper at the upper treeline, reconstructed
25
CPD
10, 341–380, 2014Evidence from Tree rings
Y. Zhang et al.
Title Page
Abstract Introduction
Conclusions References
Tables Figures
◭ ◮
◭ ◮
Back Close
Full Screen / Esc
Printer-friendly Version Interactive Discussion
Discussion
P
a
per
|
D
iscussion
P
a
per
|
Discussion
P
a
per
|
Discuss
ion
P
a
per
|
and the long-term trends were even reversed in the period of 1060–1200 AD. Yadav et al. (2011) reconstructed the mean summer temperature extending back to 940 AD derived from tree-ring width data in the western Himalaya, and the centennial-scale variations in the reconstruction revealed the warm periods encompassing the 11–15th centuries, which was different with those in the two reconstructions mentioned above. In
5
addition, combining samples of archaeological wood and living trees in eastern Qaidam Basin, Qinghai Province, Liu et al. (2009), reconstructed the annual mean temperature in a large region of the mid-eastern Tibetan Plateau over the past 2485 yr. However, the small sample size led to substantial uncertainties for the period of approximately 700–900 AD (Liu et al., 2009). Additionally, it was controversial whether the
archaeo-10
logical samples used in the research were temperature-sensitive or moisture-sensitive (Shao et al., 2010). The temperature variability in the TP during the past 1500 yr, es-pecially before 1050 AD, remains poorly understood and substantially uncertain (Ge et al., 2010). Whether temperatures were higher in the earlier periods than today or whether the current warming is unprecedented in the context of the past millennium is
15
still unclear in this area.
Previous studies have indicated that tree ring samples obtained from low-temperature sites, such as mid-latitude upper treelines and high latitude regions, tend to best reflect past temperature variations (Fritts, 1976; Körner and Paulsen, 2004; Di Filippo et al., 2007; Sazler et al., 2009). To address the need to expand spatial
cover-20
age of millennial length proxies of past temperatures, we collected tree-ring samples from the upper treeline in the Qilian Mountains in the north-eastern TP and developed a new ring-width chronology to investigate the temperature variability in the past. The objectives of this study are (1) to develop a new tree-ring chronology for the timberline forests of the Qilian Mountains in the north-eastern TP, (2) to evaluate the validity of
25
CPD
10, 341–380, 2014Evidence from Tree rings
Y. Zhang et al.
Title Page
Abstract Introduction
Conclusions References
Tables Figures
◭ ◮
◭ ◮
Back Close
Full Screen / Esc
Printer-friendly Version Interactive Discussion
Discussion
P
a
per
|
D
iscussion
P
a
per
|
Discussion
P
a
per
|
Discuss
ion
P
a
per
2 Data and methods
2.1 Study area
The study area is located in the Qilian Mountains National Nature Reserve, which are located along the north-eastern boundary of the TP bordering the Inner Mongolia-Xinjiang Plateau and the Loess Plateau, with elevations between 3000 and 5000 m
5
above sea level (hereafter as a.s.l.) in general. The climate of the region varies with el-evation, forming distinct zones of different vegetation (Chen, 1990). The lower portion of the mountains (2000–2600 m) has a semi-arid steppe climate, with annual mean temperature ranging from 2 to 5◦ and annual precipitation of approximately 235 to
330 mm; the upper portion of the mountains (2600–3200 m) has a semi-humid
for-10
est and steppe climate, with annual mean temperature ranging from −0.7 to 2◦ and
annual precipitation of approximately 400 to 500 mm; and the subalpine and alpine zones (3200 m and higher) have a cold and humid climate, with annual mean temper-ature of approximately−1.5–−0.7◦ and annual precipitation of approximately 500 mm
(Chen, 1990).The dominant tree species in the study area are Qilian juniper (Sabina 15
przewalskii Kom.) and Qinghai spruce (Picea crassifoliaKom.) (Yang et al., 2008).
2.2 Tree-ring data
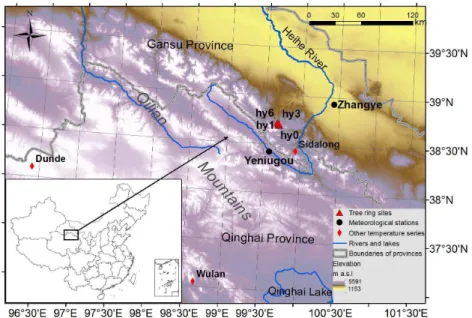
The tree-ring samples were collected on the northern slope of the central Qilian Moun-tains (Fig. 1). Based on repeated field observations, we found that Qilian junipers grow between approximately 2700 m and 3600 m a.s.l. in this area. Because most of the
20
trees in the upper treeline are located around 3400 m a.s.l., four sampling sites were selected with elevations above 3300 m (Table 1). Standard 5 mm increment cores were collected from healthy and relict trees along the local upper treeline and taken to the laboratory for processing. The samples were prepared using standard dendrochrono-logical techniques (Stokes and Smiley, 1968). After measuring each ring to the
near-25
CPD
10, 341–380, 2014Evidence from Tree rings
Y. Zhang et al.
Title Page
Abstract Introduction
Conclusions References
Tables Figures
◭ ◮
◭ ◮
Back Close
Full Screen / Esc
Printer-friendly Version Interactive Discussion
Discussion
P
a
per
|
D
iscussion
P
a
per
|
Discussion
P
a
per
|
Discuss
ion
P
a
per
|
COFECHA (Holmes, 1983). Because the four sites were located with close proxim-ity (the longest distance is 6 km between sites HY0 and HY6) and the mean correlation of all cores was 0.6, all of the raw measurements were used to develop a single stan-dard chronology (hereafter as HY). Two criteria were used to exclude certain series in order to ensure high signal-to-noise level and obtain the strong temperature signal from
5
the tree-ring series. First, series that exhibited low correlations with the master series (r <0.4) were excluded from being used in the chronology. Second, series from trees growing in rocks or crevices with mean sensitivity values greater than 0.45 were also excluded. The reason for this is because the mean sensitivity values of most sample series are range from 0.15–0.45, while these excluded tree ring series show higher
10
mean sensitivity values with more absent rings. Mean sensitivity is a measure of the relative difference in ring width between adjacent rings, and precipitation-sensitive ring width samples tend to have high variability between adjacent rings (Fritts, 1976). After applying these criteria, 152 cores from 82 trees (out of 250 cores/118 trees, Table 1) were selected to construct the chronology using the program ARSTAN (Cook, 1985),
15
which had the potential to be temperature sensitive.
The negative exponential curve and linear curve with negative slope were used to fit age-related growth trends from the individual tree-ring series for cores that were close to the piths (93 cores). For cores that were not close to the piths (47 cores), their growth trends were fitted based on the horizontal lines through the mean. For cores
20
that reached the piths, the Hugershoff growth curve (4 cores) or a general negative exponential curve (8 cores) was used to fit the growth trends (Cook and Kairiukstis, 1990; Fritts, 1976; Warren, 1980). The final ring-width chronology was obtained by cal-culating the ratios of the ring-width measurements over the fitted values for each year, producing dimensionless indices with a mean of 1.0. To reduce the possible influence
25
CPD
10, 341–380, 2014Evidence from Tree rings
Y. Zhang et al.
Title Page
Abstract Introduction
Conclusions References
Tables Figures
◭ ◮
◭ ◮
Back Close
Full Screen / Esc
Printer-friendly Version Interactive Discussion
Discussion
P
a
per
|
D
iscussion
P
a
per
|
Discussion
P
a
per
|
Discuss
ion
P
a
per
2.3 Climatic data
Base on the China Meteorological Data Sharing Service System (http://cdc.cma.gov. cn/home.do), four climatic variables from two meteorological stations (Yeniugou and Zhangye) near our tree-ring sites were used here (Table 1), including monthly mean temperature (Tmean), monthly minimum temperature (Tmin), monthly maximum
tem-5
perature (Tmax), and monthly total precipitation (PRCP) (Fig. 2). The beginning years of the instrumental climate data at these meteorological stations varied, but we used the data during the common period of 1960–2011 in the following unless otherwise noted. To be mentioned, the nearest meteorological station before 2012 was Sunan station, however, its climatic data now is unavailable in the China Meteorological Data
10
Sharing Service System, and accordingly, is not considered in this study.
To assess the regional significance of our reconstruction, the CRU gridded dataset (TS3.0) (Mitchell and Jones, 2005) was correlated with the instrumental and the recon-structed series, respectively, using the research tool known as KNMI Climate Explorer (http://climexp.knmi.nl, last access: 10 June 2013).
15
2.4 Statistical methods
Correlation and response function analyses were used to investigate the relation-ships between the tree-ring data and climatic variables using the program DENDEO-CLIM2002 (Biondi and Waikul, 2004). Partial-correlation analysis was employed to sep-arate the confounding influence of the inter-correlation of temperature and precipitation
20
using the program SEASCORR (Meko, 2011). Correlation coefficients and response-function analysis between the tree-ring and climatic variables were calculated for the 12 month period extending from October of the prior year to September of the current year. Correlations and partial-correlations between the tree-ring chronology and cli-matic variables were also calculated for various multi-month periods and on a full-year
25
CPD
10, 341–380, 2014Evidence from Tree rings
Y. Zhang et al.
Title Page
Abstract Introduction
Conclusions References
Tables Figures
◭ ◮
◭ ◮
Back Close
Full Screen / Esc
Printer-friendly Version Interactive Discussion
Discussion
P
a
per
|
D
iscussion
P
a
per
|
Discussion
P
a
per
|
Discuss
ion
P
a
per
|
To reconstruct the past climate variations, the instrumental climatic records were re-gressed against the HY chronology. Compare to the climate variable at single station, 2-station means of the climate variable have better spatial representation, therefore we examined all the subsets of 2-station means of the climate variables for the successive months from the previous October to current September to identify the best climatic
5
variable and season for reconstruction. Because the time span covered by the instru-mental data was too short for a meaningful division into two subsets for calibration and verification, the leave-one-out procedure (Michaelsen, 1987) was used to validate the calibration function. The evaluative statistics included Pearson’s correlation coeffi -cient (r), the explained variance (R2), the adjusted explained variance (Radj2 ), the sign
10
test (ST), the first-differences sign test (FST), the product-mean test (PMT) and the reduction of error (RE) (Fritts, 1976).
The variability of the temperature reconstruction in the frequency domain was exam-ined using the multi-taper method (MTM) of spectral analysis (Mann and Lees, 1996). The MTM used here derive from the Tree-Ring Laboratory of Lamont-Doherty Earth
15
Observatory in Columbia University (http://www.ldeo.columbia.edu/res/fac/trl).
3 Results
3.1 STD chronology statistics
The chronology covered the period from 450 to 2012 AD (Fig. 3). Based on the sub-sample signal strength threshold of 0.85, the chronology was considered reliable when
20
the sample size reached 11 cores, corresponding to the period from 670 to 2012 AD. The mean segment length of the chronology was 516 yr, indicating its ability to resolve inter-annual to centennial variations in tree growth that were likely related to climate variability. The mean sensitivity was approximately 0.175 that was relatively low due to the criteria applied in selecting the sample cores used in chronology construction.
25
CPD
10, 341–380, 2014Evidence from Tree rings
Y. Zhang et al.
Title Page
Abstract Introduction
Conclusions References
Tables Figures
◭ ◮
◭ ◮
Back Close
Full Screen / Esc
Printer-friendly Version Interactive Discussion
Discussion
P
a
per
|
D
iscussion
P
a
per
|
Discussion
P
a
per
|
Discuss
ion
P
a
per
respectively, indicating that the chronology was appropriate for dendroclimatic studies (Wigley et al., 1984).
3.2 Correlation and response-function analyses between tree growth and climate
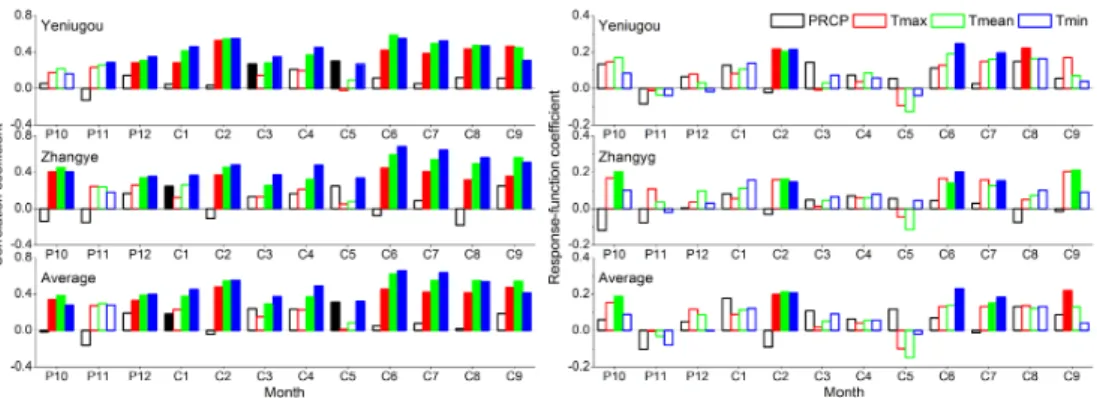
The results of the correlation analyses between the ring width index and the climatic
5
variables (Fig. 4) indicated strong relationships between tree growth and temperature at the two stations. Except for the negative correlations between the tree ring chronology and Tmax at Yeniugou during May of the current year, all of the temperature variables were positively correlated with the tree-ring index. Significantly positive correlations with Tmean and Tmin occurred in almost all months. In general, the correlation
coef-10
ficients between the tree-ring index and Tmin at the two stations were stronger than those between the tree-ring index and Tmean or Tmax. The correlations between the tree-ring index and PRCP were weak and not statistically significant in most months except for a positive correlation in current March and current May at Yeniugou and current January at Zhangye.
15
The response-function analysis showed a similar pattern (Fig. 4). The tree-ring index was not significantly correlated with PRCP at the two stations in all months, while the monthly temperature variables in most of months were positively correlated with the tree-ring index. The most significant relationships occurred at February, June and July of the current year.
20
The results of Correlation and response-function analyses of the mean of tempera-ture variables between two stations with tree-ring index were very similar with those in single station (Fig. 4, bottom), and the relationships between the mean Tmin anomalies at Zhangye and Yeniugou and the tree-ring index for different months were generally stronger than the others too, indicating that Tmin is more likely to be the control factor
25
radial growth of trees in this region.
CPD
10, 341–380, 2014Evidence from Tree rings
Y. Zhang et al.
Title Page
Abstract Introduction
Conclusions References
Tables Figures
◭ ◮
◭ ◮
Back Close
Full Screen / Esc
Printer-friendly Version Interactive Discussion
Discussion
P
a
per
|
D
iscussion
P
a
per
|
Discussion
P
a
per
|
Discuss
ion
P
a
per
|
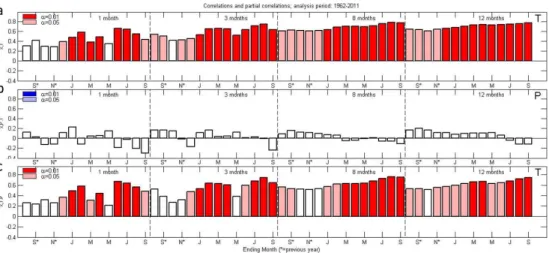
different time scales. We found statistically significant relationships between the tree-ring data and Tmin in different months and multi-month periods (Fig. 5a). The cor-relation between the tree-ring index and Tmin as the length of the averaging period increased, reaching its maximum value for the 8 month period ending in August of the current year for the period of 1962–2011(r =0.78,p <0.01).
5
When Tmin was the control variable, the relationships between the tree-ring index and precipitation were weak and not statistically significant at the 0.05 level for the 1, 3, 8, and 12 month periods (Fig. 5b). Inversely, if we use precipitation as the control vari-able, Tmin has strong relationships with the tree ring data for these periods (Fig. 5c). Based on the above results, we can conclude that our tree-ring series represented the
10
temperature variation in the study area, especially the variation of Tmin.
3.3 Calibration and reconstruction of the mean January–August minimum temperature
Based on the above analysis results, we finally chose the mean January–August min-imum temperature anomalies at Zhangye and Yeniugou (r=0.765 with the tree ring
15
series for the period of 1960–2011,p <0.01) for the reconstruction. A transfer function was estimated by linear regression using January–August Tmin at Zhangye and Yeni-ugou (Tc18) as the dependent variable and the standard tree ring chronology (STD) as the independent variable. The final transfer function was
Tc18=−4.0414+2.7707STD, (1)
20
whereTc18 is the mean January–August minimum temperature anomalies and STD is the index of HY chronology.
The final calibration model accounted for 58.5 % (p <0.01) of the total variance of the mean January–August minimum temperature over the calibration period from 1960 to 2011 (Fig. 6a). As shown in Table 3, the ST and PMT statistics were significant at
25
CPD
10, 341–380, 2014Evidence from Tree rings
Y. Zhang et al.
Title Page
Abstract Introduction
Conclusions References
Tables Figures
◭ ◮
◭ ◮
Back Close
Full Screen / Esc
Printer-friendly Version Interactive Discussion
Discussion
P
a
per
|
D
iscussion
P
a
per
|
Discussion
P
a
per
|
Discuss
ion
P
a
per
coefficient is 0.745. Additionally, the RE statistic (0.555) was greater than 0.3 over the full calibration period (1960–2011).
Figure 6b compared the observed and reconstructed Tmin series during 1960–2011. The reconstructed values matched the observed values particularly well after 1985 with a correlation coefficient for 1985–2011 as 0.8 (p <0.01). The agreement between the
5
observed and reconstructed series was not as good before 1985. This discrepancy between the reconstructed and observed data may be partly due to the uncertain-ties in the instrumental data for the earlier years. Additionally, averaging values for multi-month period may obscure the effects of short events. For example, according to temperature anomalies of Zhangye and Yeniugou stations, the observed January–
10
August minimum temperature in 1962 (−2.1◦) was the lowest recorded during the past
50 yr, but our reconstruction did not reflect this observation (Fig. 6b). The temperature records at the two stations showed that the months from January to May (−2.7◦) were
much colder than normal (0◦), while the temperature from June to August (
−1◦) was
nearly normal in this year. Tree growth may be more sensitive to temperature variation
15
during the growing season than to temperature variation before the onset of growth. Therefore, the reconstructed data series may fail to capture the variations in a few years when temperatures prior to and during the growing season varied in different directions.
Regardless the issues in the earlier part of the calibration period, the evaluative
20
statistics in Table 3 indicated that our regression model was stable and reliable, and was acceptable to reconstruct the annual-to-centennial variability of the mean January– August minimum temperature anomalies in the central Qilian Mountains since 670 AD. The 31 yr running means of the reconstructed series revealed multi-decadal to centennial-scale variation patterns (Fig. 7a). The January–August minimum
temper-25
CPD
10, 341–380, 2014Evidence from Tree rings
Y. Zhang et al.
Title Page
Abstract Introduction
Conclusions References
Tables Figures
◭ ◮
◭ ◮
Back Close
Full Screen / Esc
Printer-friendly Version Interactive Discussion
Discussion
P
a
per
|
D
iscussion
P
a
per
|
Discussion
P
a
per
|
Discuss
ion
P
a
per
|
the 19th century. The January–August minimum temperature increased gradually after 1850 AD, and the increase during the most recent 100 yr was the most rapid in the past millennium with a warming trend of 0.26◦ per 100 yr. Based on the overall mean
and 31 yr running means, several distinct warm and cold periods were identified. The warm periods included approximately 920–1000, 1310–1450, 1490–1570, and 1930–
5
2011 AD, while the cold periods were approximately 780–890, 1000–1060, 1110–1170, 1260–1300, 1450–1490, 1570–1650, 1690–1880, and 1900–1930 AD. The most recent 50 yr was the warmest period, and 910–1000 AD was the second-warmest period over the past 1342 yr. The period from 1690 to 1880 AD was the coldest period over the past millennium. There seemed to be a centennial scale cyclic pattern in the reconstructed
10
series, especially during 1000–1700 AD (Fig. 7a). The MTM spectrum indicated the occurrence of significant (99 % based on an assumed underlying red noise null spec-trum model) quasi-periodic behaviour at a number of periods, including 2–3, 28.8–66.2, 113.6–169.5, and 500 yr (Fig. 7b).
4 Discussion
15
4.1 Climatic implications of the upper treeline chronologies
The significant positive correlations between the tree-ring data and Tmean and Tmin in most months (Fig. 4) indicated that the HY chronology was temperature-sensitive. A similar climatic response has been reported for the timberline forests on the eastern and north-eastern TP (Shao and Fan, 1999; Bräuning, 2006; Liu et al., 2007; Liang,
20
2006, 2008, 2009). Low temperature limited respiration, photosynthesis, and other bio-chemical process which were essential for rapid growth of trees (Fritts, 1976). For in-stance, low summer soil temperatures at the timberline can limit the growth of roots and their function in water uptake (Körner, 1999; Mayr, 2007). In addition, even though the cambium tissues of trees are dormant in winter and early spring, the phloem sap may
25
CPD
10, 341–380, 2014Evidence from Tree rings
Y. Zhang et al.
Title Page
Abstract Introduction
Conclusions References
Tables Figures
◭ ◮
◭ ◮
Back Close
Full Screen / Esc
Printer-friendly Version Interactive Discussion
Discussion
P
a
per
|
D
iscussion
P
a
per
|
Discussion
P
a
per
|
Discuss
ion
P
a
per
Accordingly, tree growth at the upper forest limit responded strongly to temperature variation in our study region. However, the influence of growing-season precipitation should be noted in this area as well. The positive correlations of the tree-ring index with precipitation and negative correlations with maximum temperature in May indi-cated the presence of moisture stress when the trees begin to grow in the early
grow-5
ing season. Although precipitation is higher and temperatures are lower at the upper forest limit than at low elevations, rainfall during this time may not meet the demand for tree growth in the arid and semi-arid areas. Nevertheless, the influence of precipitation seems to occur only at the early growing season, and tree growth is mainly influenced by temperature, especially minimum temperature both prior to and during the growing
10
season, at our study sites.
4.2 Validation of the reconstruction
4.2.1 Spatial representativeness of the reconstructed series
Figure 8 shows the results of spatial pattern of the correlations of the CRU gridded mean January–August minimum temperature over western China with the actual and
15
reconstructed January–August Tmin for the period 1960–2009. The instrumental data significantly (p <0.1) correlated with the gridded mean January–August minimum tem-perature over the entire western China, with stronger correlations being found mainly in the TP and the north-central part of western China (Fig. 8, left). For the reconstructed series, the spatial pattern of the correlation was quite similar to that of the instrumental
20
data, with somewhat lower correlation coefficients and smaller spatial coverage of sta-tistical significance (Fig. 8, right). However, the TP was still a prominent area with high correlation coefficients. The spatial correlation results demonstrated that our tempera-ture reconstruction could reflect temperatempera-ture variability in a large region, especially in the TP.
CPD
10, 341–380, 2014Evidence from Tree rings
Y. Zhang et al.
Title Page
Abstract Introduction
Conclusions References
Tables Figures
◭ ◮
◭ ◮
Back Close
Full Screen / Esc
Printer-friendly Version Interactive Discussion
Discussion
P
a
per
|
D
iscussion
P
a
per
|
Discussion
P
a
per
|
Discuss
ion
P
a
per
|
4.2.2 Comparisons with other reconstructions and Northern Hemisphere temperature
To further assess the validity of our minimum temperature reconstruction for the Qilian Mountains (Fig. 9a), we compared it with several millennium-long temperature recon-structions in the region. Closest to our study sites is the Sidalong reconstruction series
5
of December–April temperature (Liu et al., 2007), based on a combination of ring width and stable carbon isotope with a 3 yr resolution (Fig. 9b). This reconstruction agreed closely with ours (Fig. 9a) with a correlation coefficient of 0.58 (p <0.01) between the two series for the period of 1066–1999 AD and the variation patterns were similar on an interdecadal time scale. However, some differences in the low-frequency domain
10
exited during 1100–1200 and 1350–1410 AD, which may be due to the different stan-dardisation methods used and the response mechanisms of carbon isotope and radial growth to climate factors. Figure 9c shows another millennial-scale temperature re-construction of previous September to current April (Zhu et al., 2008), using Qilian juniper samples from the upper treeline in Wulan approximately 200 km south of our
15
sites. Like our temperature reconstruction, this reconstruction series indicated that cold conditions prevailed from the early 17th century to the middle of the 19th century and that the rate of warming rapidly increased during the most recent century. The Wulan reconstruction was also significantly correlated with our reconstruction for the period of 1060–2004 AD (r=0.44,p <0.01). This series and our series also showed
consis-20
tent multi-decadal variations, such as the cold period at the end of the 13th century, warm period during the 16th century, cool period from the end of the 16th century to the early 17th century, and the cold period during the 1800s. The two reconstructions showed certain discrepancies in multi-decadal trends during several periods, such as 1100–1200 AD. Since the differences mainly existed before 1200 AD when the sample
25
CPD
10, 341–380, 2014Evidence from Tree rings
Y. Zhang et al.
Title Page
Abstract Introduction
Conclusions References
Tables Figures
◭ ◮
◭ ◮
Back Close
Full Screen / Esc
Printer-friendly Version Interactive Discussion
Discussion
P
a
per
|
D
iscussion
P
a
per
|
Discussion
P
a
per
|
Discuss
ion
P
a
per
discrepancies between the series as the seasons covered by the reconstructions were different (January–August vs. previous September – current April).
In addition to the tree-ring-based reconstructions, we compared our reconstruction to an ice-coreδ18O series with a 10 yr resolution reflecting the temperature variations at Dunde in the Qilian Mountains (Thompson et al., 2003) (Fig. 9d). Both series showed
5
strong warming trends since the late 18th century. The cold periods of approximately 1100–1200, 1250–1300, 1450–1500, and 1750–1800 AD and the warm periods of ap-proximately 1050–1100, 1500–1600, and 1950–2009 AD in our reconstruction were all confirmed by the corresponding cold and warm periods in the ice-core series. In general, the overall agreement between our reconstruction and other temperature
re-10
constructions suggests that our series is reliable over the past millennium.
We also compared our reconstruction to broad-scale temperature reconstructions for the Northern Hemisphere (NH) (Jones et al., 1998; Mann et al., 1999; Crowly, 2000; Moberg et al., 2005; D’Arrigo et al., 2006). As shown in Fig.‘9e, the temperature recon-structions for the NH generally showed a cold period during approximately 700–950
15
and a warm period during approximately 950–1100 (the Mediaeval Climate Anomaly). Another cold period can be seen during approximately 1100–1400 AD, followed by the Little Ice Age (LIA) (approximately 1450–1850). Temperature then rapidly increased af-ter approximately 1810. Our reconstruction showed a similar long-af-term trend of temper-ature variability over the past 1300 yr. Certain decadal-scale cold and warm episodes
20
in the NH, including those of the 840s (cold), 910s (cold), 980s (warm), 1090s (warm), 1210s (cold), 1240s (warm), 1290s (cold), 1420s (warm), 1470s (cold), 1540s (warm), 1590s (cold), 1710s (cold), and 1990s AD (warm) were also found in our reconstruc-tion, suggesting that the temperature variations in the north-eastern TP were highly synchronous with those of the NH. Several of these cold or warm events are recorded
25
CPD
10, 341–380, 2014Evidence from Tree rings
Y. Zhang et al.
Title Page
Abstract Introduction
Conclusions References
Tables Figures
◭ ◮
◭ ◮
Back Close
Full Screen / Esc
Printer-friendly Version Interactive Discussion
Discussion
P
a
per
|
D
iscussion
P
a
per
|
Discussion
P
a
per
|
Discuss
ion
P
a
per
|
eastern China and in the TP (Yang et al., 2002, 2009b). These agreements not only suggested the occurrence of climatic events at a continental or even semi-hemispheric scale but also reinforced the validity of our temperature reconstruction. The differences between the NH temperature series and our reconstruction probably reflected local cli-matic variability. For example, our series showed that the Mediaeval warm period was
5
not as continuous in the Qilian Mountains and that it probably occurred earlier in this region than elsewhere in the NH. The magnitudes of the temperature fluctuations and the multi-decadal trends during some periods also differed between our series and the NH temperature series.
4.3 The periodicity of the reconstruction and the possible forcing factors of
10
temperature variations
The cycles of 2–3 yr (Fig. 7b) in our reconstruction represent the common mode of interannual variability associated with atmospheric and oceanographic conditions caused by various forcing mechanisms, such as El Niño-Southern Oscillation (ENSO), thermal contrasts of land mass and ocean, intensities of the westerly and/or winter
15
monsoon circulations, The ENSO band of 2–8 yr (Allan et al., 1996) has been in many temperature and precipitation reconstruction series in China (Fang et al., 2009; Li et al., 2011; Zhang et al., 2011; Sun and Liu, 2012; Deng et al., 2013). The results of instrumental data based researches on ENSO and temperature in the Qilian Moun-tains showed air temperature in the El Niño years was increased while in the La Niña
20
years air temperature was distinctly decreased in this area (Lan et al., 2003; Zhang et al., 2011; Yang and Zhao, 2012). However, cross correlation between a reconstructed inter-decadal ENSO variation series (Li et al., 2011) and our reconstruction for the pe-riod 900–2002 was not statistically significant with lags up to 10 yr (r =−0.017, lag=0), indicating that the relationship between the variations of ENSO and minimum
temper-25
ature in Qilian Mountains might be more complex.
CPD
10, 341–380, 2014Evidence from Tree rings
Y. Zhang et al.
Title Page
Abstract Introduction
Conclusions References
Tables Figures
◭ ◮
◭ ◮
Back Close
Full Screen / Esc
Printer-friendly Version Interactive Discussion
Discussion
P
a
per
|
D
iscussion
P
a
per
|
Discussion
P
a
per
|
Discuss
ion
P
a
per
calculated the correlation between our reconstruction and PDO index (MacDonald and Case, 2002) for the period of 993–1996, but the relationship between the two se-ries was not significant (r=0.08). However, it was interesting to note that significantly negative correlation were found in several periods when we calculated the moving-correlation between the two series for different 100 yr intervals, especially during 1370–
5
1510, when continuous highly negative correlation coefficients were found with the highest value of−0.564 (p <0.01) in 1389–1488. Meanwhile, a series of significantly
positive correlations were found during 1068–1210, 1282–1386, and 1509–1654 AD, and the highest positive correlation coefficient was 0.456 (p <0.01) for 1528–1627 AD. Hence the relationship between PDO and temperature variability in our study area
10
probably changed over time.
It is well known that solar irradiance and volcanism are the important forcing factors of global temperature variations (Crowley, 2000; Jones and Mann, 2004). For exam-ple, low temperatures during the LIA have been linked to the Maunder Minimum of the 22 yr sunspot cycle (Shindell et al., 2001). The centennial cycles identified in our
15
study, i.e. those of 113.6–169 and 500 yr (Fig. 8b), were possibly associated with the frequencies of solar variations (Stuiver and Braziunas, 1989; Raspopov et al., 2008). The cycles similar to the periodicities of 113.6–169 yr have been found in other tree ring reconstructions in China (Wang et al., 2008; Gou et al., 2010; Zhang et al., 2011), while the very long period of 500 yr visible in our reconstruction was not found in other
tree-20
ring series in China, which may be due to the lack of millennial tree ring records with low-frequency signals. The relationship between volcanism and temperature variations cannot be revealed via the spectrum analysis, however, some extreme cold events in our reconstruction maybe associate with the volcanic eruptions. Because the effects of some volcanoes may take a couple of years to impact around the globe (Robock and
25
CPD
10, 341–380, 2014Evidence from Tree rings
Y. Zhang et al.
Title Page
Abstract Introduction
Conclusions References
Tables Figures
◭ ◮
◭ ◮
Back Close
Full Screen / Esc
Printer-friendly Version Interactive Discussion
Discussion
P
a
per
|
D
iscussion
P
a
per
|
Discussion
P
a
per
|
Discuss
ion
P
a
per
|
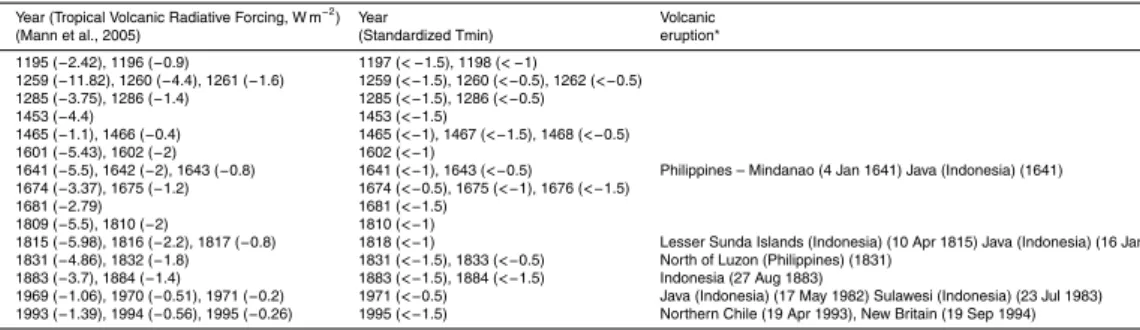
21 volcanic events were then identified during the period of 1000–1999 AD. Meanwhile our reconstruction series was normalized by its mean and standard deviation, the years with the value less than 0.5 were regarded as cold years in this standardized series. In this case, the corresponding cold events can be found in 15 volcanic event years for the past millennium. Some of them were also supported by the factual evidences, such as
5
these volcanic eruptions since 1815 AD. It seems that the volcanic eruption in Indone-sia played an important role in temperature change in our study area. Undoubtedly, solar activity and volcanism have great influences on global temperature change. How-ever, the forcing mechanism of both factors on local temperature variations is complex and still unclear to us. More temperature-related tree-ring series are urgently needed
10
for the further analysis.
5 Conclusions
In this study we sampled four upper-treeline sites (>3300 m a.s.l.) for tree ring cores of Qilain juniper in the Qilian Mountains of the north-eastern Tibetan Plateau. After care-fully screening sample cores that are less sensitive to precipitation, we selected 152
15
cores from 82 trees to construct a potentially temperature-sensitive ring width chronol-ogy through correlation and response-function analyses between the chronolchronol-ogy and climatic variables (Tmax, Tmin, Tmean, and PRCP), we determined that the radial growth of the trees was mostly controlled by temperature, especially minimum tem-perature. The correlations between the tree ring chronology and mean and minimum
20
temperatures at near-by weather stations can be as high as 0.77 and, therefore, it can be used to infer the variations in mean January–August minimum temperature anoma-lies over the past millennium for the study region. For the calibration period of 1960– 2011, the transfer function explained 58.5 % of the total variance in mean January– August minimum temperature. This temperature reconstruction covered the period
25
CPD
10, 341–380, 2014Evidence from Tree rings
Y. Zhang et al.
Title Page
Abstract Introduction
Conclusions References
Tables Figures
◭ ◮
◭ ◮
Back Close
Full Screen / Esc
Printer-friendly Version Interactive Discussion
Discussion
P
a
per
|
D
iscussion
P
a
per
|
Discussion
P
a
per
|
Discuss
ion
P
a
per
in the region and those of the Northern Hemisphere displayed strong consistencies, suggesting good reliability.
According to the reconstructed series, distinct warm periods were identified dur-ing 920–1000, 1310–1450, 1490–1570, and 1930–2011 AD, while cool periods were identified in 780–890, 1000–1060, 1110–1170, 1260–1300, 1450–1490, 1570–1650,
5
1690–1880, and 1900–1930 AD. The warming during the most recent 50 yr was un-precedented within the past millennium; even during the dramatic warming from 900 to 1100 AD, the reconstructed temperatures did not exceed those observed today. The period from 1690 to 1880 AD was the coldest and longest-lasting cold period during the past 1342 yr.
10
Significant periodicities were found in the reconstructed series using the MTM spec-tral analysis, including those of 2–3, 28.8–66.2, 113.6–169.5, and 500 yr. We examined the relationships between the reconstructed minimum temperature series and several forcing mechanisms of temperature variability at different temporal scales, including ENSO and PDO, solar activities, and volcanic eruption records. We found that ENSO
15
was not correlated with minimum temperature variation in our region, while the influ-ence of PDO might have been variable over time. The periodicities of solar activity have good agreement with those in our reconstruction. The tropical volcanic eruptions have good corresponding relationship with the cold events recorded by our reconstruction.
Acknowledgements. This research was supported by National Basic Research Program of
20
CPD
10, 341–380, 2014Evidence from Tree rings
Y. Zhang et al.
Title Page
Abstract Introduction
Conclusions References
Tables Figures
◭ ◮
◭ ◮
Back Close
Full Screen / Esc
Printer-friendly Version Interactive Discussion
Discussion
P
a
per
|
D
iscussion
P
a
per
|
Discussion
P
a
per
|
Discuss
ion
P
a
per
|
References
Allan, R., Lindesay, J., and Parker, D.: El Niño-Southern Oscillation and climatic variability, Com-mon wealth Scientific and Industrial Research Organisation, Melbourne, Vicoria, Australia, p. 405, 1996.
Biondi, F. and Waikul K.: DENDROCLIM2002: a C++Program for statistical calibration of
cli-5
mate signals in tree-ring chronologies, Comput. Geosci., 30, 301–311, 2004.
Bräuning, A.: Tree-ring evidence of “Little Ice Age” glacier advances in southern Tibet, Holocene, 16, 369–380, 2006.
Chen, C. Y.: The distribution of climate and vegetation in the north slope of the Qilian Mountains, Arid Meteorol., 2, 28–33, 1990 (in Chinese).
10
Cheng, G. and Wu, T.: Responses of permafrost to climate change and their en-vironmental significance, Qinghai-Tibet Plateau, J. Geophys. Res., 112, F02S03, doi:10.1029/2006JF000631, 2007.
Cook, E. R.: A time-series analysis approach to tree-ring standardization, PhD dissertation, The University of Arizona, Tucson, 1985.
15
Cook, E. R. and Kairiukstis, L. A.: Methods of dendrochronology: Applications in the environ-mental sciences, Kluwer Academic Publishers, Dordrecht, The Netherlands, 1990.
Cook, E. R., Krusic, P. J., and Jones, P. D.: Dendroclimatic signals in long tree-ring chronologies from the Himalayas of Nepal, Int. J. Climat., 23, 707–732, 2003.
Crowley, T. J.: Causes of Climate Change Over the Past 1000 Years, Science, 289, 270–277,
20
2000.
Cyranoski, D.: The long-range forecast, Nature, 438, 275–276, 2005.
D’Arrigo, R., Wilson, R., and Jacoby, G.: On the long-term context for late twentieth century warming, J. Geophys. Res., 111, D03103, doi:10.1029/2005JD006352, 2006.
Deng, Y., Gou, X., Gao L., Yang, T., and Yang, M.: Early-summer temperature variations over
25
the past 563 yr inferred from tree rings in the Shaluli Mountains, southeastern Tibet Plateau, Quaternary Res., doi:10.1016/j.yqres.2013.08.002, 2013.
Di Filippo, A., Biondi, F., Cufar K., de Luis, M., Grabner, M., Maugeri, M., Saba, P. E., Schirone B., and Piovesan G.: Bioclimatology of beech (Fagus sylvatica L.) in the Eastern Alps: spatial and altitudinal climatic signals identified through a tree-ring network, J. Biogeogr., 34, 1873–
30
1892, 2007.
CPD
10, 341–380, 2014Evidence from Tree rings
Y. Zhang et al.
Title Page
Abstract Introduction
Conclusions References
Tables Figures
◭ ◮
◭ ◮
Back Close
Full Screen / Esc
Printer-friendly Version Interactive Discussion
Discussion
P
a
per
|
D
iscussion
P
a
per
|
Discussion
P
a
per
|
Discuss
ion
P
a
per
Esper, J., Frank, D. C., imonen, M., Zorita, E., Wilson, R. J. S., Luterbacher, J., Holzkämper, S., Fischer, N., Wagner, S., Nievergelt, D., and Versteg, A.: Orbital forcing of tree-ring data, Nat. Clim. Change., 2, 862–866, doi:10.1038/nclimate1589, 2012.
Fan, Z. X., Bräuning, A., and Cao, K. F.: Annual temperature reconstruction in the central Hengduan Mountains, China, as deduced from tree rings, Dendrochronologia, 26, 97–107,
5
doi:10.1016/j.dendro.2008.01.003, 2008.
Fan, Z. X., Bräuning, A., Yang, B., and Cao, K. F.: Tree ring density-based summer tempera-ture reconstruction for the central Hengduan Mountains in southern China, Global. Planet. Change., 65, 1–11, 2009.
Fan, Z. X., Bräuning, A., Tian Q. H., Yang, B., and Cao, K. F.: Tree ring recorded May-August
10
temperature variations since A.D. 1585 in the Gaoligong Mountains, southeastern Tibetan Plateau, Palaeogeogr. Palaeocl., 296, 94–102, 2010.
Fang, K., Gou, X., Chen, F., Yang, M., L, J., He, M., Zhang, Y., Tian, Q., and Peng J.: Drought variations in the eastern part of northwest China over the past two centuries: evidence from tree rings, Clim. Res., 38, 129–135, 2009.
15
Fritts, H. C.: Tree Rings and Climate, London, Academic Press, 1976.
Ge, Q. S., Zheng, J. Y., Fang, X. Q., Ma, Z. M., Zhang, X. Q., Zhang, P. Y., and Wang, W. C.: Winter half-year temperature reconstruction for the middle and lower reaches of yellow river and Yangtze river, China, during the past 2000 years, Holocene, 13, 933–940, 2003.
Ge, Q. S., Zheng, J. Y., Hao, Z. X., Shao, X. M., Wang, W. C., and Luterbacher, J.: Temperature
20
variation through 2000 years in China: An uncertainty analysis of reconstruction and regional
difference, Geophys. Res. Lett., 37, L03703, doi:10.1029/2009GL041281, 2010.
Gou, X., Chen, F., Jacoby, G., Cook, E., Yang, M., Peng, J., and Zhang, Y.: Rapid tree growth with respect to the last 400 years in response to climate warming, northeastern Tibetan Plateau, Int. J. Climat., 27, 1497–1503, doi:10.1002/joc.1480, 2007a.
25
Gou, X., Chen, F., Yang, M., Jacoby, G., Fang, K., and Tian, Q.: Asymmetric variability between maximum and minimum temperatures in Northeastern Tibetan Plateau: Evidence from tree rings, Sci. China. Ser. D., 50, 1–15, 2007b.
Gou, X., Deng, Y., Chen, F., Yang, M., Fang, K., Gao, L., Yang, T., and Zhang, F.: Tree ring based streamflow reconstruction for the Upper Yellow River over the past 1234 years, Chin.
30
Sci. Bull., 55, 4179–4186, 2010.
CPD
10, 341–380, 2014Evidence from Tree rings
Y. Zhang et al.
Title Page
Abstract Introduction
Conclusions References
Tables Figures
◭ ◮
◭ ◮
Back Close
Full Screen / Esc
Printer-friendly Version Interactive Discussion
Discussion
P
a
per
|
D
iscussion
P
a
per
|
Discussion
P
a
per
|
Discuss
ion
P
a
per
|
and teleconnection with the Pacific Decadal Oscillation, J. Geophys. Res., 114, D20118, doi:10.1029/2008JD011242, 2009.
Holmes, R. L.: Computer-assisted quality control in tree-ring dating and measurement, Tree-Ring B., 43, 69–95, 1983.
Hughes, M. K.: An improved reconstruction of summer temperature at Srinagar, Kashmir since
5
1660 AD, based on tree-ring width and maximum latewood density of Abies pindrow (Royle) Spach, Palaeobotanist., 50, 13–19, 2001.
Jones, P. D. and Mann, M. E.: Climate over past millennia. Rev. Geophys., 42, RG2002, doi:10.1029/2003RG000143, 2004.
Jones, P. D., Briffa, K. R., Barnett, T. P., and Tett, S. F. B.: High-resolution palaeoclimatic records
10
for the last millennium: interpretation, integration and comparison with General Circulation Model control-run temperatures, Holocene, 8, 455–471, 1998.
Jones, P. D., Briffa, K. R., Osborn, T. J., Lough, J. M., van Ommen, T., Vinther, B. M.,
Luter-bacher ,J., Zwiers, F. W., Wahl, E., Schmidt, G., Ammann, C., Mann, M. E., Wanner, H., Buckley, B. M., Cobb, K., Esper, J., Goosse, H., Graham, N., Jansen, E., Kiefer, T., Kull, C.,
15
Mosley-Thompson, E., Overpeck, J. T., Schulz, M., Tudhope, S., Villalba, R., and Wolff, E.:
High-resolution paleoclimatology of the last millennium: a review of the current status and future prospects, Holocene., 19, 3–49, 2009.
Kimmins, J. P.: Forest Ecology, MacMillan Publishing Company, New York, 1–531, 1987. Körner, C.: Alpine Plant Life: Function Plant Ecology of High Mountain Ecosystems, Springer,
20
Berlin, 1999.
Körner, C. and Paulsen, J.: A world-wide study of high altitude treeline temperatures, J. Bio-geogr., 31, 713–732, 2004.
Lan, Y., Ding, Y., Kang, E., and Zhang, J.: The relationship between ENSO cycle and
tem-perature, precipitation and runoff in the Qilian Mountain area, J. Geog. Sci., 13, 293–298,
25
2003
Li, J., Xie, S. P., Cook, E. R., Huang, G., D’Arrigo, R., Liu, F., Ma, J., and Zheng, X.-T.: Inter-decadal modulation of El Niño amplitude during the past millennium, Nat. Clim. Change, 1, 114–118, 2011.
Li, Z. S., Zhang, Q. B., and Ma, K. P.: Tree-ring reconstruction of summer temperature for A.D.
30
CPD
10, 341–380, 2014Evidence from Tree rings
Y. Zhang et al.
Title Page
Abstract Introduction
Conclusions References
Tables Figures
◭ ◮
◭ ◮
Back Close
Full Screen / Esc
Printer-friendly Version Interactive Discussion
Discussion
P
a
per
|
D
iscussion
P
a
per
|
Discussion
P
a
per
|
Discuss
ion
P
a
per
Liang, E. Y., Shao, X. M., Eckstein, D., Huang, L., and Liu, X. H.: Topography- and species-dependent growth responses of Sabina przewalskii and Picea crassifolia to climate on the northeast Tibetan Plateau, Forest. Ecol Manage., 236, 268–277, 2006.
Liang, E., Shao, X., and Qin, N.: Tree-ring based summer temperature reconstruction for the source region of the Yangtze River on the Tibetan Plateau, Global. Planet. Change, 61, 313–
5
320, 2008.
Liang, E. Y., Shao, X. M., and Xu, Y.: Tree-ring evidence of recent abnormal warming on the southeast Tibetan Plateau. Theor. Appl. Climatol., 98, 9–18, doi:10.1007/s00704-008-0085-6, 2009.
Liu, X. and Chen, B.: Climatic warming in the Tibetan Plateau during recent decades, Int. J.
10
Climat., 20, 1729–1742, 2000.
Liu, X. H., Shao, X. M., Zhao, L. J., Qin, D. H., Chen, T., and Ren, J. W.: Dendroclimatic tem-perature record derived from tree-ring width and stable carbon isotope chronologies in the middle Qilian Mountains, China, Arct. Antarct. Alp. Res., 39, 651–657, 2007.
Liu, Y., An, Z., Linderholm, H. W., Chen, D., Song, H., Cai, Q., Sun, J., and Tian, H.: Annual
15
temperatures during the last 2485 years in the Eastern Tibetan Plateau inferred from tree rings, Sci. China. Ser. D., 52, 348–359, 2009.
MacDonald, G. M. and Case, R. A.: Variations in the Pacific Decadal Oscillation over the past millennium, Geophys. Res. Lett., 32, L08703, doi:10.1029/2005GL022478, 2005.
Manabe, S. and Broccoli, A.: Mountains and arid climate of middle latitudes, Science, 247,
20
192–195, 1990.
Mann, M. E. and Lees, J. M.: Robust estimation of background noise and signal detection in climatic time series, Clim. Change, 33, 409–445, 1996.
Mann, M. E., Bradley, R. S., and Hughes, M.K.: Northern hemisphere temperatures during the past millennium: inferences, uncertainties and limitations, Geophys. Res. Lett., 26, 759–762,
25
1999.
Mann, M. E., Cane, M. A., Zebiak, S. E., and Clement, A.: Volcanic and solar forcing of the Tropical Pacific over the past 1000 years, J. Climate, 18, 447–456, 2005.
Mantua, N. J., Hare, S. R., Zhang, Y., Wallace, J. M., and Francis R. C.: A Pacific interdecadal oscillation with impacts on salmon production, B. Am. Meteorol. Soc., 78, 1069–1079, 1997.
30
CPD
10, 341–380, 2014Evidence from Tree rings
Y. Zhang et al.
Title Page
Abstract Introduction
Conclusions References
Tables Figures
◭ ◮
◭ ◮
Back Close
Full Screen / Esc
Printer-friendly Version Interactive Discussion
Discussion
P
a
per
|
D
iscussion
P
a
per
|
Discussion
P
a
per
|
Discuss
ion
P
a
per
|
Meko, D. M., Touchan, R., and Anchukaitis, K. J.: Seascorr: A MATLAB program for identifying the seasonal climate signal in an annual tree-ring time series, Comput. Geosci., 37, 1234– 1241, doi:10.1016/j.cageo.2011.01.013, 2011.
Michaelsen, J.: Cross-validation in statistical climate forecast models, J. Climate. Appl. Meteo-rol., 26, 1589–1600, 1987.
5
Minobe, S.: A 50–70 year climatic oscillation over the North Pacific and North America. Geo-phys. Res. Lett., 24, 683–686, 1997.
Mitchell, T. . and Jones, P. D.: An improved method of constructing a database of monthly climate observations and associated high-resolution grids, Int. J. Climatol., 25, 693–712, 2005.
10
Moberg, A., Sonechkin, D. M., Holmgren, K., Datsenko, N. M., and Karlen, W.: Highly variable Northern Hemisphere temperatures reconstructed from low- and high resolution proxy data, Nature, 433, 613–617, 2005.
Osborn, T. J., Briffa, K. R., and Jones, P. D.: Adjusting variance for sample size in tree-ring
chronologies and other regional mean time series, Dendrochronologia, 15, 89–99, 1997.
15
Raspopov, O. M., Dergachev, V. A., Esper, J., Kozyreva, O. V., Frank, D., Ogurtsov, M., Kolström,
T., and Shao, X.: The influence of the de Vries (∼200-year) solar cycle on climate variations:
Results from the Central Asian Mountains and their global link, Palaeogeogr. Palaeocl., 259, 6–16, 2008.
Robock, A. and Mao, J.: The volcanic signal in surface temperature observations, J. Climate, 8,
20
1086–1103, 1995.
Salzer, M. W. and Hughes, M. K.: Bristlecone pine tree rings and volcanic eruptions over the last 5000 yr, Quaternary Res., 67, 57–68, 2007.
Salzer, M. W., Hughes, M. K., Bunn, A. G., and Kipfmueller, K. F.: Recent unprecedented tree-ring growth in bristlecone pine at the highest elevations and possible causes, Proc. Natl.
25
Acad. Sci., 106, 20348–20353, 2009.
Shao, X. M. and Fan, J. M.: Past climate on west Sichuan Plateau as reconstructed from ring-widths of dragon spruce, Quaternary Sci., 1, 81–89, 1999 (in Chinese).
Shao, X. M., Xu, Y., Yin, Z-Y., Zhu, H., and Wang, S.: Climatic implications of a 3585-year tree-ring width chronology from the northeastern Qinghai-Tibetan Plateau, Quaternary Sci. Rev.,
30
29, 2111–2122, doi:10.1016/j.quascirev.2010.05.005, 2010.
CPD
10, 341–380, 2014Evidence from Tree rings
Y. Zhang et al.
Title Page
Abstract Introduction
Conclusions References
Tables Figures
◭ ◮
◭ ◮
Back Close
Full Screen / Esc
Printer-friendly Version Interactive Discussion
Discussion
P
a
per
|
D
iscussion
P
a
per
|
Discussion
P
a
per
|
Discuss
ion
P
a
per
Stokes, M. A. and Smiley, T. L.: An introduction to tree ring dating, The University of Chicago Press, Chicago, 1968.
Stuiver, M. and Braziunas, T. F.: Atmospheric 14C and century-scale solar oscillations, Nature, 338, 405–408, 1989.
Sun, J. and Liu, Y.: Tree ring based precipitation reconstruction in the south slope of the middle
5
Qilian Mountains northeastern Tibetan Plateau, over the last millennium, J. Geophys. Res., 117, D08108, doi:10.1029/2011JD017290, 2012.
Tan, M., Liu, T.S., Hou, J., Qin, X., Zhang, H., and Li, T., Cyclic rapid warming on centennial-scale revealed by a 2650-year stalagmite record of warm season temperature, Geophys. Res. Lett., 30, 1617, doi:10.1029/2003GL017352, 2003.
10
Thompson, L. G., Mosley-Thompson, E., Davis, M. E., Lin, P. N., Henderson, K., and Mashiotta, T. A.: Tropical glacier and ice core evidence of climate change on annual to millennial time scales, Clim. Change, 59, 137–155, 2003.
Tian, Q., Gou, X., Zhang, Y., Wang, Y., and Fan, Z.: May-June mean temperature reconstruction over the past 300 years based on tree rings in the Qilian Mountains of the Northeastern
15
Tibetan Plateau, IAWA J., 30, 421–434, 2009.
Wang, X. C., Zhang, Q. B., Ma, K. P., and Xiao, S. C.: A tree-ring record of 500-year dry-wet changes in northern Tibet, China, Holocene, 18, 579–588, 2008.
Warren, W. G.: On removing the growth trend from dendrochronological data, Tree-Ring Bull., 40, 35–44, 1980.
20
Webster, P. J., Magaña, V. O., Palmer, T. N., Shukla, J., Tomas, P. A., Yanai, M., and Yasunari, T.: Monsoons: processes, predictability, and the prospects for prediction, J. Geophys. Res., 103, 14451–14510, 1998.
Wigley, T. M. L., Briffa, K. R., and Jones, P. D.: On the average value of correlated time series,
with applications in dendroclimatology and hydrometeorology, J. Clim. Appl. Meteorol., 23,
25
201–213, 1984.
Xu, W. X. and Liu, X. D.: Response of vegetation in the Qinghai-Tibet Plateau to global warming, Chinese Geogr. Sci., 17, 151–159, 2007.
Yadav, R. R., Park, W. K., Singh, J., and Dubey, B.: Do the western Himalayas defy global warming? Geophys. Res. Lett., 31, L17201, doi:10.1029/2004GL020201, 2004.
30
CPD
10, 341–380, 2014Evidence from Tree rings
Y. Zhang et al.
Title Page
Abstract Introduction
Conclusions References
Tables Figures
◭ ◮
◭ ◮
Back Close
Full Screen / Esc
Printer-friendly Version Interactive Discussion
Discussion
P
a
per
|
D
iscussion
P
a
per
|
Discussion
P
a
per
|
Discuss
ion
P
a
per
|
Yang, B., Bräuning, A., Johnson, K. R., and Shi Y. F.: General characteristics of temperature variation in China during the last two millennia, Geophy. Res. Lett., 29, 381–384, 2002 Yang, B., Bräuning, A., Liu, J. J., Davis, M. E., and Shao, Y. J.: Temperature changes on the
Tibetan Plateau during the past 600 years inferred from ice cores and tree rings, Global. Planet. Change., 69, 71–78, 2009b.
5
Yang, B., Kang, X., Liu, J., Bräuning, A., and Qin, C.: Annual temperature history in South-west Tibet during the last 400 years recorded by tree rings, Int. J. Climatol., 30, 962–971, doi:10.1002/joc.1956, 2009a.
Yang, B., Kang, X. C., Brauning, A., Liu, J., Qin, C., and Liu, J. J.: A 622-year regional temper-ature history of southeast Tibet derived from tree rings, Holocene, 20, 181–190, 2010.
10
Yang, L. and Zhao, J.-B.: Effect of ENSO events on climate and climate disasters in the Hexi
Corridor, Gansu Province, Arid Zone Res., 29, 949–955, 2012 (in Chinese).
Yang, Q., Liu, J., and Wang, Y.: Survey report in the National Nature Reserve of Qilian Moun-tains, Gansu, Gansu Science & Technology Press, Lanzhou, 2008 (in Chinese).
Yao, T., Thompson, L., Yang, W., Yu, W., Gao, Y., Guo, X., Yang, X., Duan, K., Zhao, H., Xu,
15
B., Pu, J., Lu, A., Xiang, Y., Kattel, D. B., and Joswiak, D.: Different glacier status with
atmo-spheric circulations in Tibetan Plateau and surroundings, Nat. Clim. Change, 2, 663–667, doi:10.1038/NCLIMATE1580, 2012.
Yao, T. D., Wang, Y. Q., Liu, S. Y., Pu, J. C., Shen, Y. P., and Lu, A. X.: Recent glacial retreat in High Asia in China and its impact on water resource in Northwest China, Sci. China. Ser. D.,
20
47, 1065–1075, 2004.
Zhang, C., Zhao, J., Luo, X., and Chen, L.: Correlation between ENSO events and climate im-pacts in Gansu for 60 years, J. Arid Land Resour. Environ., 25, 106–113, 2011 (in Chinese). Zhang, Y., Tian, Q., Gou, X., Chen, F., Leavitt, S. W., and Wang, Y.: Annual precipitation
recon-struction since AD 775 based on tree rings from the Qilian Mountains, northwestern China,
25
Int. J. Climatol., 31, 371–381, 2011.
Zhou, X. J., Zhao, P., Chen, J. M., Chen, L. X., and Li, W. L.: Impacts of thermodynamic pro-cesses over the Tibetan Plateau on the Northern Hemispheric climate, Sci. China. Ser. D., 52, 1679–1693, 2009.
Zhu, H. F., Shao, X. M., Yin, Z. Y., and Huang, L.: Early summer temperature reconstruction in
30
CPD
10, 341–380, 2014Evidence from Tree rings
Y. Zhang et al.
Title Page
Abstract Introduction
Conclusions References
Tables Figures
◭ ◮
◭ ◮
Back Close
Full Screen / Esc
Printer-friendly Version Interactive Discussion
Discussion
P
a
per
|
D
iscussion
P
a
per
|
Discussion
P
a
per
|
Discuss
ion
P
a
per
Zhu, H. F., Shao, X. M., Yin, Z. Y., Xu, P., Xu, Y., and Tian, H.: August temperature variability in the southeastern Tibetan Plateau since AD 1385 inferred from tree rings, Palaeogeogr. Palaeocl., 305, 84–92, 2011b.
Zhu, H. F., Zheng, Y. H., Shao, X. M., Liu, X. H., Xu, Y., and Liang, E. Y.: Millennial temperature reconstruction based on tree-ring widths of Qilian juniper from Wulan, Qinghai Province,
5
CPD
10, 341–380, 2014Evidence from Tree rings
Y. Zhang et al.
Title Page
Abstract Introduction
Conclusions References
Tables Figures
◭ ◮
◭ ◮
Back Close
Full Screen / Esc
Printer-friendly Version Interactive Discussion
Discussion
P
a
per
|
D
iscussion
P
a
per
|
Discussion
P
a
per
|
Discuss
ion
P
a
per
|
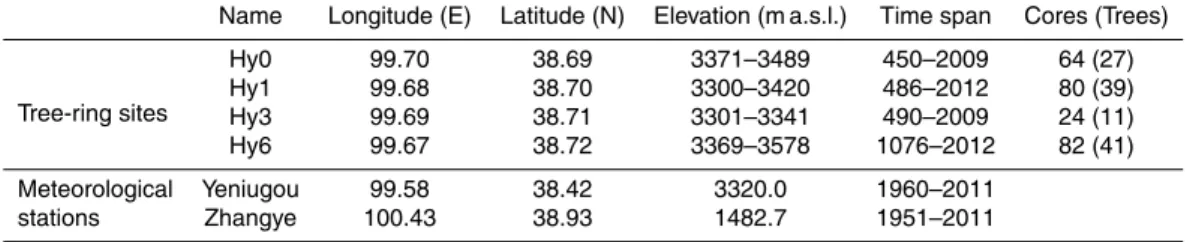
Table 1.Tree-ring sampling sites and meteorological stations.
Name Longitude (E) Latitude (N) Elevation (m a.s.l.) Time span Cores (Trees)
Tree-ring sites
Hy0 99.70 38.69 3371–3489 450–2009 64 (27)
Hy1 99.68 38.70 3300–3420 486–2012 80 (39)
Hy3 99.69 38.71 3301–3341 490–2009 24 (11)
Hy6 99.67 38.72 3369–3578 1076–2012 82 (41)
Meteorological Yeniugou 99.58 38.42 3320.0 1960–2011
CPD
10, 341–380, 2014Evidence from Tree rings
Y. Zhang et al.
Title Page
Abstract Introduction
Conclusions References
Tables Figures
◭ ◮
◭ ◮
Back Close
Full Screen / Esc
Printer-friendly Version Interactive Discussion
Discussion
P
a
per
|
D
iscussion
P
a
per
|
Discussion
P
a
per
|
Discuss
ion
P
a
per
Table 2.Statistical features of the HY chronology.
Statistics HY
Total number of cores 152
Mean sensitivity 0.175
Mean 0.982
Standard deviation 0.22
First-order autocorrelation 0.535
Median length 516
Statistical features of the common-period analyses (1701–2000)
Number of cores 68
Mean correlation between all series 0.312
Mean correlation between trees 0.306
Mean correlation within trees 0.823
Signal-to-noise ratio 30.83
Variance explained by the first principal component (%) 40.9
Expressed population signal (EPS) 0.969