Eurasian Journal of Economics and Finance, 5(1), 2017, 95-113 DOI: 10.15604/ejef.2017.05.01.007
EURASIAN JOURNAL OF ECONOMICS AND FINANCE
http://www.eurasianpublications.com
† I want to particularly thank anonymous referees for critical yet helpful comments and suggestions. The
research assistance of Anand Venkatraman Narayanaswamy is gratefully acknowledged. The standard disclaimer applies.
I
MPACTS OF
A
FRICA
'
S
T
OTAL AND
C
OMMODITY
-B
ASED
T
RADE WITH
C
HINA AND
OECD
C
OUNTRIES
†Nihal Bayraktar
Pennsylvania State University, USA. Email: nxb23@psu.edu
Abstract
This paper studies the changes in the pattern of Africa’s trade with China and OECD countries, and the impacts of these changes on sub-Saharan Africa’s economic growth. In the study, the country-level total exports and imports, as well as the commodity-based exports and imports are considered for 42 sub-Saharan African countries between 1980 and 2014. The results show that as the share of China in sub-Saharan Africa’s trade has significantly increased, a declining trend is observed for OECD countries, traditional trading partners. Despite changing trade links, the investigation of the commodity-based exports and imports indicate that the types of imported and exported commodities have not changed much for Africa. However, a strong link is observed between economic growth in SSA and its changing trade links from the OECD countries towards China at the total level as well as at the commodity level. The study concludes that there is an increase in the international competition for Africa’s commodities, and resulting in improvements in the terms of trade has led to higher income growth in the region.
Keywords: China, OECD, Sub-Saharan Africa, International Trade, Growth
1. Introduction
OECD countries, especially the European countries of the organization, have been forming the main trading partners of the sub-Saharan African (SSA) countries for many years. However, this trading link has started to change in recent years. The share of trade with emerging market economies, especially with China, has increased dramatically in the region. Together with changing trade patterns and higher international competition for SSA’s commodities, SSA’s economic growth has also improved significantly during the same period.
Given these observations, this paper tries to answer the question of what the role of changing trade links and patterns on the better growth performance of SSA countries is, by using total exports and imports data as well as commodity-based trade. Does the increasing trade with China help SSA countries to grow faster when compared to the effects of trade with OECD countries?
N. Bayraktar / Eurasian Journal of Economics and Finance, 5(1), 2017, 95-113
96
international markets can be one of the important reasons for improving economic conditions in the SSA countries.1
In the empirical analyses, international trade is measured by China’s and OECD countries’ total exports and the commodity-based exports and imports with SSA countries. In the study, all 35 OECD countries, 42 Sub-Saharan African countries, and China are included. The main data sources are Comtrade (United Nations, 2016), Direction of Trade (International Monetary Fund, 2016), and World Development Indicators (World Bank, 2016). The importance of China in the SSA region increased in the 2000s, but the dataset covers a larger time span from 1980 to 2014 to better understand the impacts of international trade on SSA countries before and after the heavy involvement of China (see detailed information in Appendix).
A two-step system GMM is applied in the regression analysis. In regression specifications, economic growth, which is measured by the growth rate of real GDP per capita, is taken as dependent variable. Independent variables consist of several trade indicators, such as trade openness, terms of trade index, growth rates of the total exports, imports and commodity-based trade with the OECD countries and with China, and different control variables, which include institutional and political determinants of economic growth, fixed investment, human capital, and inflation as a measure of macroeconomic stability.
The regression outcomes present a statistically significant link between trade indicators and economic growth in SSA. The effect of the increasing trade with China is positive on SSA’s growth. The regression results also show that the impacts of different trade items are not the same on growth. For example, while SSA’s exports of mineral fuel and crude materials to China improve their growth rates significantly, the exports of the same commodities to the OECD countries do not produce the same result. Overall, whether the total exports or imports are studied, or different trade commodities are considered, the impacts of increasing trade with China are mostly positive and stronger than the impacts of trade with the OECD countries. The findings are robust to alternative regression specifications.
The rest of the paper is as follows. Section 2 presents a literature review. Section 3 presents data for the SSA countries on the changing trade links with China and the OECD countries. Section 4 presents regression analyses. Section 5 concludes and presents some policy implications and suggestions.
2. Literature Review
There are many studies in the literature on the positive impacts of China’s involvement in developing countries, including the SSA region. But, at the same time, some studies indicate serious concerns about China’s negative effects on the international competitiveness of other developing countries. Thus, the expected effects of trade with China can be positive as well as negative.
One of the oldest papers on the issue of increasing impacts of China on Africa (Jenkins and Edwards, 2006) indicates that these impacts are significant only for some African countries. While Ghana, Ethiopia, Kenya, Tanzania and Uganda became the main export markets for China; Angola, Nigeria, and Sudan became important exporters to China.
Another interesting study (Wang, 2007) tries to answer the question of what drives China’s growing role in Africa’s development. After assessing China’s influence as a donor, financer and investor, the author states that the existence of larger markets is the main reason for the bilateral trade relationship between China and SSA.
Kaplinsky and Messner (2008) study the importance of China and India in shaping economic growth in different parts of the world. The authors show the increasing effects of China and India in different areas and also present a framework for assessing such impacts (complementary, interaction, competitive, and direct and indirect effects).
1 Indeed, Bayraktar (2017) shows that changes in the direction of trade between the SSA countries and the
N. Bayraktar / Eurasian Journal of Economics and Finance, 5(1), 2017, 95-113
97
In a follow-up paper (Kaplinsky and Morris, 2008), the authors focus specifically on the concerns about the link between Asian countries and SSA countries. Export-oriented manufacturing has been commonly considered as an appropriate developmental path for SSA because of the earlier success of China and other Asian emerging market economies following the same strategies. However, the authors’ concern is that the tough competition from emerging market economies causes serious problems for export-oriented growth in SSA. The authors, for example, predict that the clothing and textile industries in SSA cannot find markets because they cannot compete with producers from Asian countries.2
Samake and Yang (2011) investigate growth spillovers through direct (FDI and trade) and indirect (commodity prices) channels from the BRIC to low-income countries by introducing a global vector autoregression (GVAR) model. Their findings support the importance of direct spillovers.United Nations Economic Commission for Africa (2013) investigates the cooperation between Africa and BRIC, and its implications for transformation in Africa. The report favors the relationship between two regions. However, some possible problems are also pointed out in the report. For example, one concern is that most export incomes have been going to foreigners in Africa, not to the local population. They also state that China’s involvement has been also limiting Africa’s international competitiveness. However, they add that this might be reversed in the future with increasing wages and costs of production in China. Drummond and Liu (2013) investigate the effect of changes in China’s investment growth on SSA’s exports. The authors estimate that a one percentage point increase in China’s domestic investment growth is associated with an average of 0.6 percentage points increase in SSA countries’ export growth. The relationship between two variables is stronger in resource-rich SSA countries.
Kummer‐Noormamode (2014) empirically shows that Africa’s trade with China has an important effect on Africa’s growth. The author uses data from thirty-seven African countries from 1985 to 2012. The outcomes show that trade with China caused stronger effects on African economies when compared to the impacts of trade with Europe. Our paper is similar to this paper, but there are also important differences. We consider commodity-based trade and the whole OECD countries, not only European trading partners.
In the literature, there are also empirical studies on specific African countries. For example, Agyekum et al. (2015) assess the effect of trade with China on economic growth in Ghana and find a positive relationship.
Busse et al. (2016) investigate the impact of Chinese activities in SSA countries with respect to their growth performance. They use data from 1991 to 2010. They find that, SSA countries that export natural resources have benefited from positive terms-of-trade effects; and that Chinese foreign direct investment and foreign aid in SSA does not have a significant effect on Africa’s growth. What is different in our paper is that our focus is on the comparison of the contributions of trade with the OECD countries versus China. We also consider more detailed classifications of trade items. The covered time period is longer as well.
Bayraktar (2017) shows that the increasing trade links with the BRIC improved the growth performance in the SSA region. It implies that with the increasing importance of BRIC in the region, the international competition for Africa’s commodities had increased. As a result, SSA countries were able to trade with favorable prices, and grow faster. The main difference between our paper and Bayraktar (2017) is the introduction of detailed trade items in the analyses, as not only the total exports and imports but also specific trade items are expected to have important effects on growth. Another difference is that while Bayraktar (2017) focuses on BRIC countries, the focus is only on China in this paper.
In light of this literature review, the main contribution of this paper is the comparison of the role of China and the OECD countries in the economic performance of the SSA countries. In this study, a detailed classification of trade items, in addition to the total exports and imports, is considered. Given that improvements in international prices can lead to higher growth, another
2
N. Bayraktar / Eurasian Journal of Economics and Finance, 5(1), 2017, 95-113
98
contribution of the paper is the inclusion of the terms of trade index in growth regression analyses.
3. International Trade Linkages and Growth in the SSA region
China has been the engine of economic growth in the world, thanks to its own impressive growth performance. Improvements in China have been spreading towards other developing regions of the world, especially through the stronger international trade linkages. This is also true for the SSA countries. This section of the paper investigates the changing direction of international trade in SSA. The results show that while the importance of the OECD countries has been declining continuously, the trade share of China has been increasing steadily.
3.1. SSA’s Trade with China and OECD Countries
Figure 1 shows the share of SSA’s exports to China and OECD countries in percent of SSA’s total exports, and the share of SSA’s imports from China and OECD countries in percent of SSA’s total imports. The international trade with China was limited but stable in the 1980s. On the other hand, OECD countries were the main trading partners of African countries.
Figure 1. SSA’s Exports to and Imports from China and OECD countries
Source: Author’s calculations based on IMF (2016)
These trade links changed quickly in the 1990s: the share of China in SSA’s total exports and imports had been rising, while this share had been declining for the OECD countries. The share of the exports to China in SSA’s total exports increased from 1 percent in
0.00 20.00 40.00 60.00 80.00 100.00
1980 1981 1982 1983 1984 1985 1986 1987 1988 1989 1990 1991 1992 1993 1994 1995 1996 1997 1998 1999 2000 2001 2002 2003 2004 2005 2006 2007 2008 2009 2010 2011 2012 2013 2014
Share of exports to China and OECD
(in % of total exports) China OECD
0.00 20.00 40.00 60.00 80.00
1980 1981 1982 1983 1984 1985 1986 1987 1988 1989 1990 1991 1992 1993 1994 1995 1996 1997 1998 1999 2000 2001 2002 2003 2004 2005 2006 2007 2008 2009 2010 2011 2012 2013 2014
Share of imports from China and OECD
N. Bayraktar / Eurasian Journal of Economics and Finance, 5(1), 2017, 95-113
99
1990 to 18 percent in 2014, while the share of the exports to the OECD countries declined from 76 percent to 41 percent. During the same period, SSA’s imports from China, on the one hand, increased from 3 percent in 1990 to 20 percent in 2014. On the other hand, the share of the imports from the OECD countries dropped from 65 percent in 1990 to 36 percent in 2014. Figure 1 clearly shows that the traditional trading partners of the SSA countries lost their dominance due to the tougher competition with China for African markets.
Figure 2 presents trade volumes in billions of USD to give information on the actual size of the international trade in the region. The total volume of trade in the 1980s and 1990s did not change much. The increasing trend started in the 2000s. The total volume of the exports from SSA was $320 billion USD in 2014, while the size of the imports to SSA was $390 billion USD. These numbers indicate that SSA economies became more open in the 2000s. The size of the exports to China increased from only $0.4 billion USD in 1990 to $65 billion USD in 2014. During the same period, the size of the exports to the OECD countries increased from $29 billion USD to $150 billion USD. It should be also noted that interregional trade in SSA, mostly covered in “other” category, had increased as well.
The second panel of Figure 2 presents that while the value of SSA’s imports from China was only $1.17 billion USD in 1990, it was $86 billion USD in 2014. Between 1990 and 2014, SSA’s imports from the OECD countries increased from $25 to $125 billion USD. These observations indicate that China was easily able to compete with OECD countries in SSA markets.
Figure 2. Size of SSA’s Exports to and Imports from China and OECD countries
Source: Author’s calculations based on IMF (2016)
0 50 100 150 200 250 300 350 400
Exports from SSA to China, OECD, Other
(in billions of $US) China OECD Other
0 100 200 300 400
Exports from SSA to China, OECD, Other
N. Bayraktar / Eurasian Journal of Economics and Finance, 5(1), 2017, 95-113
100
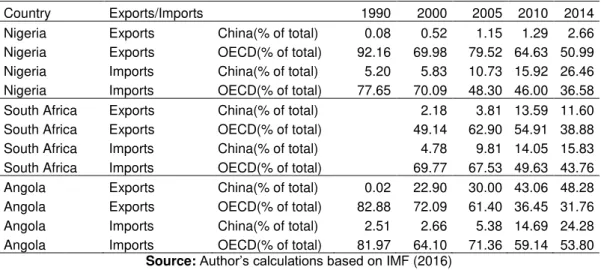
Each SSA country does not have the same experience with the changing trade links. Still, some SSA countries have limited access to trade with China. Table 1 summarizes the changes in the direction of trade in the top three economies of the region between 1990 and 2014. Nigeria, which heavily depends on the exports of natural resources, is the largest economy of the region. Nigeria is an important trade partner for both China and the OECD countries. The share of China in Nigerian exports is still limited. The share of the exports to China was 0.08 percent in 1990 and only 2.66 percent in 2014. However, data shows that the share of China’s imports in Nigeria increased tremendously during the same period. It increased from 5 percent to 26 percent. As China was getting more dominant, the importance of the OECD countries was declining for Nigeria. The share of the exports to the OECD countries from Nigeria dropped from 92 percent to 51 percent, while the imports from the same set of countries declined from 77 percent to 36 percent.
Table 1. Nigeria, South Africa, and Angola: Shares of Exports to and Imports from China and OECD countries
Country Exports/Imports 1990 2000 2005 2010 2014 Nigeria Exports China(% of total) 0.08 0.52 1.15 1.29 2.66 Nigeria Exports OECD(% of total) 92.16 69.98 79.52 64.63 50.99 Nigeria Imports China(% of total) 5.20 5.83 10.73 15.92 26.46 Nigeria Imports OECD(% of total) 77.65 70.09 48.30 46.00 36.58 South Africa Exports China(% of total) 2.18 3.81 13.59 11.60 South Africa Exports OECD(% of total) 49.14 62.90 54.91 38.88 South Africa Imports China(% of total) 4.78 9.81 14.05 15.83 South Africa Imports OECD(% of total) 69.77 67.53 49.63 43.76 Angola Exports China(% of total) 0.02 22.90 30.00 43.06 48.28 Angola Exports OECD(% of total) 82.88 72.09 61.40 36.45 31.76 Angola Imports China(% of total) 2.51 2.66 5.38 14.69 24.28 Angola Imports OECD(% of total) 81.97 64.10 71.36 59.14 53.80
Source: Author’s calculations based on IMF (2016)
In Table 1, similar changes are observed in South Africa, which is the second largest economy of the region. Throughout its history, South Africa had strong ties with European economies. However, this link has been changing recently. South Africa’s trade relationship with China improved significantly between 2000 and 2014. South Africa’s export share to China was only 2 percent in 2000. But, in 2014 it was 12 percent. On the imports side, the share of China increased from 5 percent in 2000 to 16 percent in 2014. During the same period, the share of trade with the OECD countries declined. The share of the exports to the OECD countries decreased from 49 percent to 39 percent between 2000 and 2014, while the share of the imports from the same countries dropped from 70 percent to 44 percent.
The changing trade link is even more impressive in the third largest economy of the SSA region, Angola, which is resource-rich and one of the fastest growing countries in the world. Stronger trade links with China helped Angola during the periods of fast growth. The share of the exports to China was only 0.02 percent in 1990. It was 48 percent in 2014. The share of Angola’s imports from China also increased from 2.5 percent to 24 percent in 2014. Angola’s exports to the OECD countries dropped from 83 percent in 1990 to 32 percent in 2014. Similarly, Angola’s imports from the OECD countries declined from 82 percent to 54 percent in 2014. Overall, the significance of China has been increasing in the SSA region, while the importance of the OECD countries has been in decline.
3.2. SSA’s Trade Items
N. Bayraktar / Eurasian Journal of Economics and Finance, 5(1), 2017, 95-113
101
international trade items (commodity-based exports and imports) are taken from the Comtrade Database United Nations (2016). Based on the definitions of the database, the following 2-digit commodity groups are considered:
• Food and live animals (Food) • Beverages and tobacco (Bev)
• Crude materials, inedible, except fuels (Crude materials) • Mineral fuels, lubricants and related materials (Mineral fuel) • Animal and vegetable oils and fats (Veg. oils)
• Chemicals (Chem)
• Manufactured goods classified chiefly by material (Manuf) • Machinery and transport equipment (Mach)
• Miscellaneous manufactured articles (Misc Manuf)
• Commodities and transactions not classified according to kind (Others)
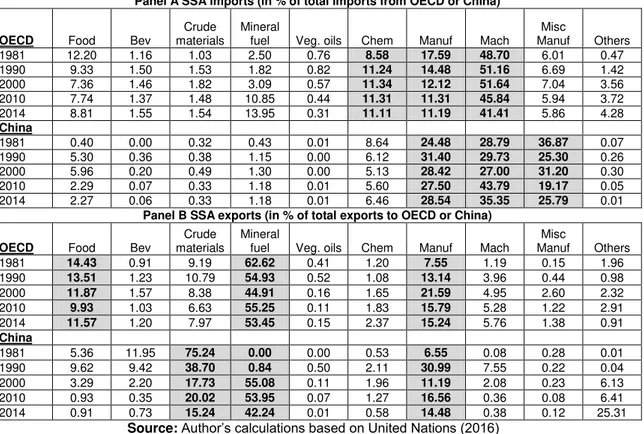
The first panel of Table 2 presents SSA’s commodity-based exports to OECD countries and China. While the main export items to the OECD countries are food, mineral fuel, and manufactured items; the main export commodity categories to China are crude materials, mineral fuel, and manufactured goods. These items are highlighted in gray in the table. For both China and the OECD countries, the highest share belongs to mineral fuel. Around 50 percent of SSA exports to China and OECD countries are mineral fuel. The table shows that even though the trade linkages have been changing in the region, primary goods continue to dominate SSA’s exports. The share of the manufactured exports, which covers around 15 percent of the exports to China and the OECD countries, is still limited.
Table 2. SSA’s Commodity-Based Exports to and Imports from China and OECD countries
Panel A SSA imports (in % of total imports from OECD or China)
OECD Food Bev
Crude materials
Mineral
fuel Veg. oils Chem Manuf Mach
Misc
Manuf Others 1981 12.20 1.16 1.03 2.50 0.76 8.58 17.59 48.70 6.01 0.47 1990 9.33 1.50 1.53 1.82 0.82 11.24 14.48 51.16 6.69 1.42 2000 7.36 1.46 1.82 3.09 0.57 11.34 12.12 51.64 7.04 3.56 2010 7.74 1.37 1.48 10.85 0.44 11.31 11.31 45.84 5.94 3.72 2014 8.81 1.55 1.54 13.95 0.31 11.11 11.19 41.41 5.86 4.28
China
1981 0.40 0.00 0.32 0.43 0.01 8.64 24.48 28.79 36.87 0.07 1990 5.30 0.36 0.38 1.15 0.00 6.12 31.40 29.73 25.30 0.26 2000 5.96 0.20 0.49 1.30 0.00 5.13 28.42 27.00 31.20 0.30 2010 2.29 0.07 0.33 1.18 0.01 5.60 27.50 43.79 19.17 0.05 2014 2.27 0.06 0.33 1.18 0.01 6.46 28.54 35.35 25.79 0.01
Panel B SSA exports (in % of total exports to OECD or China)
OECD Food Bev
Crude materials
Mineral
fuel Veg. oils Chem Manuf Mach
Misc
Manuf Others 1981 14.43 0.91 9.19 62.62 0.41 1.20 7.55 1.19 0.15 1.96 1990 13.51 1.23 10.79 54.93 0.52 1.08 13.14 3.96 0.44 0.98 2000 11.87 1.57 8.38 44.91 0.16 1.65 21.59 4.95 2.60 2.32 2010 9.93 1.03 6.63 55.25 0.11 1.83 15.79 5.28 1.22 2.91 2014 11.57 1.20 7.97 53.45 0.15 2.37 15.24 5.76 1.38 0.91
China
1981 5.36 11.95 75.24 0.00 0.00 0.53 6.55 0.08 0.28 0.01 1990 9.62 9.42 38.70 0.84 0.50 2.11 30.99 7.55 0.22 0.04 2000 3.29 2.20 17.73 55.08 0.11 1.96 11.19 2.08 0.23 6.13 2010 0.93 0.35 20.02 53.95 0.07 1.27 16.56 0.36 0.08 6.41 2014 0.91 0.73 15.24 42.24 0.01 0.58 14.48 0.38 0.12 25.31
Source: Author’s calculations based on United Nations (2016)
N. Bayraktar / Eurasian Journal of Economics and Finance, 5(1), 2017, 95-113
102
goods, and miscellaneous manufactured articles are the main import items from China. For both China and the OECD countries, the highest share belongs to the machinery and transport equipment category. In 2014, the share of these commodities was 41 percent of the imports from the OECD countries. It was slightly lower for China, around 35 percent of the imports from China. The shares of the rest of the items are small.
In order to understand the specific importance of China in SSA relative to the importance of the OECD countries, we should check the time trend of the commodity-based exports and imports. The first panel of Figure 3 shows crude materials (except fuels) exports from SSA to China and OECD countries. For decades, the size of the material exports to the OECD countries was higher. But, this trend changed after the global crisis of 2008. While the material exports to the OECD countries dropped sharply during the crisis period, it continuously increased for China. As a result, in 2011, the volume of the exports to China surpassed the volume of the exports to the OECD countries. The second panel of Figure 3 gives information on the size of SSA exports of mineral fuels, lubricants, and related materials. The exports to the OECD countries have been definitely higher. However, China would catch up to the OECD countries soon, thanks to its increasing demand for SSA commodities. While the gap between the exports of these materials to China and to the OECD countries was $110 billion USD in 2007, it is only $40 billion USD in 2014.
Figure 3. SSA’s Commodity-based Exports to China and OECD countries
Source: Author’s calculations based on United Nations (2016)
0 2 4 6 8 10 12 14 16 18
1981 1982 1983 1984 1985 1986 1987 1988 1989 1990 1991 1992 1993 1994 1995 1996 1997 1998 1999 2000 2001 2002 2003 2004 2005 2006 2007 2008 2009 2010 2011 2012 2013 2014
SSA exports - Crude materials, inedible, except fuels
(in billions of US dollars) China OECD
0 20 40 60 80 100 120 140
1981 1982 1983 1984 1985 1986 1987 1988 1989 1990 1991 1992 1993 1994 1995 1996 1997 1998 1999 2000 2001 2002 2003 2004 2005 2006 2007 2008 2009 2010 2011 2012 2013 2014
SSA exports - Mineral fuels, lubricants and related materials
N. Bayraktar / Eurasian Journal of Economics and Finance, 5(1), 2017, 95-113
103
Figure 4 shows SSA’s commodity-based imports from China and OECD countries. In the first panel, the focus is on the imports of manufactured goods. Up to 2010, the imports from the OECD countries were higher. But, after that year, the imports of manufactured goods from China overcame the imports from the OECD countries, and have been increasing steadily. In 2014, the imports of manufactured goods from China was only $5 billion USD higher than the imports from OECD countries. When we check the imports of machinery and transport equipment in the second panel of Figure 4, it can be seen that the OECD countries have been the major trading partners in this category. Similar to the case in other commodities, the imports of machinery and transportation equipment from China have been increasing at high rates. If the imports from China continue growing at the same speed, it will catch up to the OECD countries in the coming years. Overall, it is getting harder for the OECD countries to compete with China in African markets for almost each commodity category.
Figure 4. SSA’s Commodity-based Imports from China and OECD countries
Source: Author’s calculations based on United Nations (2016)
3.3. Growth performance in the SSA region
The relationship between economic growth rates and the increased competition for SSA goods in the international arena is expected to be positive. As the SSA countries have new trading partners, they can experience higher growth rates, thanks to larger markets for their products.
0 5 10 15 20 25
1981 1982 1983 1984 1985 1986 1987 1988 1989 1990 1991 1992 1993 1994 1995 1996 1997 1998 1999 2000 2001 2002 2003 2004 2005 2006 2007 2008 2009 2010 2011 2012 2013 2014
SSA imports - Manufactured goods classified chiefly by material
(in billions of US dollars) China OECD
0 10 20 30 40 50 60 70 80
1981 1982 1983 1984 1985 1986 1987 1988 1989 1990 1991 1992 1993 1994 1995 1996 1997 1998 1999 2000 2001 2002 2003 2004 2005 2006 2007 2008 2009 2010 2011 2012 2013 2014
SSA imports - Machinery and transport equipment
N. Bayraktar / Eurasian Journal of Economics and Finance, 5(1), 2017, 95-113
104
The regression analyses in Section 4 investigate the link between economic growth and trade indicators in detail. This short section presents the time trend of growth rates and per capita income in the SSA region in the process of changing trade links.
Figure 5 gives data information on economic growth in the SSA region. During the 1980s and 1990s, the average growth rate of income per capita was lower than the growth rates observed in the other parts of the world. Because of low growth rates, GDP per capita declined in real terms throughout the same period. In the 2000s, the average growth rate of income got considerably higher. The average growth rate was 5 percent between 2000 and 2014, which was higher than the world average during the same period. With the higher growth rates, GDP per capita increased as well, improving the purchasing power in the region. Real GDP per capita rose from $1200 in 2000 to $1800 in 2014 in real terms. Such a high growth rate was impressive after the decades-long stagnation.
Figure 5. Growth rates and GDP per capita in SSA
Source: Author’s calculations based on World Bank (2016)
Overall, when the OECD countries were the dominant trading partners in the SSA region, SSA economies were more fragile, because they were highly dependent on a selected number of advanced countries for international trade. However, this fragile situation has started to change due to the strengthened international competition for SSA products and the improved TOT index in favor of them, as China involved more in SSA markets. The result of this development for the SSA region was higher economic development and income. These arguments are econometrically tested in the following section.
4. Econometric Methodology, Empirical Specification, and Regression Results
Many empirical studies state that international trade is important for growth. In this section, the link between economic growth in SSA and total and commodity-based trade with China versus the OECD countries is econometrically studied. The analyses are based on annual panel data from 42 SSA countries. SSA’s trade indicators are calculated for 35 OECD countries and China. The estimation time period is 1980-2014.
0 200 400 600 800 1000 1200 1400 1600 1800 2000
-2 0 2 4 6 8 10 12
1980 1981 1982 1983 1984 1985 1986 1987 1988 1989 1990 1991 1992 1993 1994 1995 1996 1997 1998 1999 2000 2001 2002 2003 2004 2005 2006 2007 2008 2009 2010 2011 2012 2013
N. Bayraktar / Eurasian Journal of Economics and Finance, 5(1), 2017, 95-113
105 4.1. Econometric Methodology
A type of dynamic GMM is used as regression technique, following Bayraktar (2017). The reason for applying a dynamic GMM is that independent variables in the regression specification may not be exogenous. GMM methods for dynamic panel settings allow for treatment of possible endogeneity problems, and results can be more precise (Arellano and Bond, 1991; Arellano and Bover, 1995; Blundell and Bond, 1998). A set of instrumental variables also needs to be introduced in this GMM technique to control for possible endogeneity problems among right-hand side variables. In the regression analyses, the set of instrumental variables includes the first and second lags of the dependent and independent variables. As suggested by the methodology used in this paper, the first differences of the variables are taken as explanatory variables.
4.2. Regression Specification
In the empirical specification, the growth rate of real GDP in SSA is taken as the dependent variable. Economic growth is explained by changes in different measures of the direction and structure of international trade, trade openness (exports plus imports), terms of trade, fixed capital investment, quality of human capital, quality of governance and institutions, and inflation as a measure of macroeconomic stability. Because different measures of trade indicators are introduced in the regression specifications, the robustness of the empirical results can be checked.
Table 3. Correlation matrix of regression variables
1 2 3 4 5 6 7 8 9 10 11 12
1. Inflation rate 1.00
2. GDP per capita (constant 2005
US$) -0.17 1.00
3. GDP per capita growth -0.10 0.50 1.00
4. Fixed investment (%GDP) -0.23 0.32 0.23 1.00
5. Human capital 0.12 0.30 0.22 0.32 1.00
6. Bureaucracy index -0.39 -0.47 -0.40 -0.19 -0.36 1.00
7. TOT -0.13 0.45 0.35 0.23 0.20 -0.23 1.00
8. Trade openness -0.14 0.25 0.27 0.19 0.17 -0.21 0.31 1.00
9. Share SSA exports to BRIC 0.05 0.98 0.49 0.18 0.42 -0.17 0.35 0.18 1.00
10. Share SSA exports to OECD -0.05 -0.90 -0.49 -0.17 -0.41 0.29 -0.35 -0.01 -0.92 1.00 11. Share SSA imports from BRIC 0.01 0.97 0.46 0.12 0.48 -0.14 0.42 0.15 0.99 -0.89 1.00 12. Share SSA imports from OECD -0.02 -0.93 -0.50 -0.14 -0.45 0.20 -0.40 -0.05 -0.96 0.87 -0.97 1.00
The correlation matrix among the variables is calculated to check for any multi-collinearity problems. Table 3 reports the correlation coefficients. The correlation among the independent variables is not high enough to cause any multi-collinearity problem.
The benchmark regression specification is defined as:3
it it
it it
it it
it it
it a y aTRADE INDICATOR aTOT aOPEN aHC aCAP a BUREAUC aCPIINF
yˆ 1ˆ1 2 _ 3 4 5 6 7 8 (1)
where:
i : country index.
t : year index.
yˆ : rate of growth of real GDP per capita.
TRADE_INDICATOR: one of the sixteen different trade indicators. These indicators are introduced one at a time because of high correlations among them. TRADE_INDICATOR can be equal to 1) Growth of SSA exports to China; 2) Growth of SSA exports to OECD; 3) Growth of SSA imports from China; 4) Growth of SSA imports from OECD; 5) Share of mineral fuel exports to China to such exports to OECD; 6)
3
N. Bayraktar / Eurasian Journal of Economics and Finance, 5(1), 2017, 95-113
106
Share of crude materials exports to China to such exports to OECD; 7) Share of manufactured imports from China to such imports from OECD; 8) Share of machinery imports from China to such imports from OECD; 9) Growth of manufactured imports from China; 10) Growth of manufactured imports from OECD; 11) Growth of machinery imports from China; 12) Growth of machinery imports from OECD; 13) Growth of mineral fuel exports to China; 14) Growth of mineral fuel exports to OECD; 15) Growth of crude materials exports to China; 16) Growth of crude materials exports to OECD.
TOT: terms of trade index.
OPEN: ratio of sum of exports and imports to GDP.
HC: human capital index.
CAP: share of fixed capital investment in GDP.
BUREAUC: index measuring the quality of bureaucracy.
CPIINF: inflation rate as a measure of macroeconomic stability.
a1, a2, a3, a4, a5, a6, a7 and a8: estimated coefficients.
In the regression equation, two sets of independent variables are introduced: trade variables and other control variables. Country dummies, to control for country effects, and time dummies, to control for time effects, are included too.
Control variables in the regression are taken from the growth literature. Fixed investment is considered as an important determinant of growth (see, for example, Edwards, 1993). Inflation rates are introduced as a measure of macroeconomic stability (Barro, 1996). A human capital index, a measure of skilled labor, can be important for growth (Barro and Sala-i-Martin, 2003). Indexes measuring the quality of governance can significantly affect growth. As a result, the bureaucracy quality index is introduced to control for the quality of governance (Bayraktar and Moreno-Dodson, 2015). Finally, the lagged value of the growth rate of GDP per capita (dependent variable) is included to consider growth inertia factors.
In the set of trade-related variables, different measures of changes in the structure and linkages of trade are included in the regression specifications. The data analyses presented in Section 3 indicate that the increasing competition for SSA markets with more involvement of China led to higher growth in the region. Thus, we expect higher growth of the total or commodity-based trade with China must have a larger economic impact on SSA countries, when compared to the impact of the trade with the OECD countries. Due to high correlations among these variables, they are included one by one in the specification. The terms of trade index (TOT) and trade openness are the two additional trade variables included in the specifications to explain the growth performance of SSA countries (see, for example, Sachs and Warner, 1995).
4.3. Regression Specification
Tables 4, 5, and 6 present the estimated coefficients of alternative regression specifications defined with different measures of trade indicators. In each column, a different TRADE_INDICATOR variable is introduced. The results are calculated by using the two-step system GMM method.
The results presented in Table 4 show that higher growth rates of trade with China have statistically and economically significant impacts on income growth for the SSA countries. As reported in column (1), the estimated coefficient of the growth rate of SSA exports to China is 0.163. It means that a one-percentage point rise in the growth rate of the exports to China leads to a 0.163-percentage point higher growth rate of income in SSA. The effect of the exports to the OECD countries is limited when compared to the effect of the exports to China. The estimated coefficient of the growth rate of the exports to the OECD countries is positive but significant at the 10 percent level as reported in column (2). The magnitude of the estimated coefficient is 0.021, stating that a one-percentage point increase in growth of the exports to the OECD countries increases the growth rate of income by a 0.021-percentage point.
N. Bayraktar / Eurasian Journal of Economics and Finance, 5(1), 2017, 95-113
107
China leads to a 0.187-percentage point higher per capita income growth. The estimated coefficient of the growth rate of SSA’s imports from the OECD has a negative sign, but statistically insignificant (see column (4)). One interpretation of this result would be that as cheap imported products from China replace expensive products from the OECD countries, this may improve the growth rate in SSA countries because they can afford to purchase more with less money. These findings are consistent with the results given in similar studies that present a positive growth effect of stronger trade linkages with China, such as Agyekum et al. (2015), Kummer‐Noormamode (2014), and Diallo and Tapsoba (2014).
TOT has a positive and statistically significant impact on income growth in each case. A 1-percentage point improvement in TOT leads to an around 0.015-percentage point increase in income growth. The result indicates that SSA countries can enjoy relatively higher export prices due to higher demands for their products in international markets. Similarly, trade openness has a statistically significant and positive impact on economic growth, indicating countries with more open economies can grow more quickly.
Table 4. Regression results for SSA’s total exports and imports
Dependent variable: GDP per capita
growth Results with panel dynamic GMM
(1) (2) (3) (4)
GDP per capita (-1) 0.251*** 0.244*** 0.231*** 0.235***
Growth of exports and imports
Growth of SSA exports to China 0.163***
Growth of SSA exports to OECD 0.021*
Growth of SSA imports from China 0.187**
Growth of SSA imports from OECD -0.035
Trade openness (in% of GDP) 0.016** 0.019** 0.021* 0.012*
Fixed K formation (in % of GDP) 0.097* 0.109** 0.118* 0.121***
Inflation rate -0.001 -0.001 -0.001 -0.001
TOT 0.016** 0.013** 0.015*** 0.012**
Human capital 0.004* 0.006* 0.001 0.007*
Bureaucracy quality index -0.291* -0.301* -0.312* -0.307*
Period 1984-2014 1984-2014 1984-2014 1984-2014
Obs 309 309 309 309
J-statistics 1.48 1.65 1.61 1.33
Arellano-Bond serial correlation test AR(1) 1.91 2.07 1.91 1.92
Arellano-Bond serial correlation test AR(2) 0.33 0.41 0.27 0.67
Jarque-Bera normality test 1.43 1.75 1.14 1.21
Note: The estimation method is a dynamic panel - GMM. The dependent variable is the growth rate of real GDP per capita. SSA countries are included in the dataset. Annual data are used. * indicates 10% significance level, ** indicates 5% significance level, and *** indicates 1% significance level. These significance levels are equal to one minus the probability of rejecting the null hypothesis of zero coefficients. J-test is for overidentification problem where H0: there is no overidentification problem. We fail to reject in each case. For serial correlation z-tests, H0 is "there is no serial correlation"; and for normality test, H0 is "normal distribution". We fail to reject H0 in each test except AR(1). AR(1) test is rejected as expected. Due to space limitation, estimated coefficients of time and country dummies are not reported in the table.
N. Bayraktar / Eurasian Journal of Economics and Finance, 5(1), 2017, 95-113
108
As reported in Table 4, the set of instrumental variables passes the necessary identification tests. J-test checks for the presence of an over-identification problem. In this test, the null hypothesis is “there is no over-identification problem”. The test result fails to reject, meaning there is no over-identification problem. To test for serial correlations, z-tests (AR(2)) are calculated, where the null hypothesis is "there is no serial correlation". In normality tests, the null hypothesis is "it is a normal distribution". We fail to reject the null hypothesis in each case. Also in the table, AR(1) test statistics, where the null hypothesis is "instrumental variables are weak”, are reported and all rejected, indicating that the set of instrumental variables is strong.
Tables 5 and 6 report the results for SSA’s exports and imports at the commodity level. In total, four commodities with the highest shares in total trade are studied in the analysis. On the exports side, two commodities are considered: mineral fuels, lubricants and related materials, named as mineral fuel in the regression tables; and crude materials, inedible, except fuels, named as crude materials in the tables. On the imports side, two commodities are taken: manufactured goods classified chiefly by material, named as manufactured imports in the tables; and machinery and transport equipment, named as machinery imports in the regression tables. In column (1) of Table 5, the trade indicator is the share of the mineral exports to China to the mineral exports to the OECD countries. The estimated coefficient is 0.051. It means that as this share increases by a one percentage point, the growth rate of income per capita is expected to increase by 0.051-percentage points. The coefficient is highly significant at the 1 percent level. The magnitude of the coefficient of the share of the crude materials exports to China to the crude materials exports to the OECD countries is smaller and its value is 0.011 (see column (2)). Despite its small size, the coefficient is statistically significant at the 5 percent level. The economic significance of the import items is larger because their estimated coefficients are higher (see columns (3) and (4)). As the share of the manufactured imports from China to the manufactured imports from the OECD countries rises by a one-percentage point, the impact on growth will be 0.121-percentage points, as presented in column (3). The coefficient for the machinery imports is highly statistically significant at the 1 percent level and its magnitude is 0.108. All these results indicate that as the share of China increases in SSA trade relative to the share of the OECD countries, the growth rates in SSA improve.
N. Bayraktar / Eurasian Journal of Economics and Finance, 5(1), 2017, 95-113
109
Table 5. Regression results for SSA’s commodity-based exports and imports (in shares)
Dependent variable: GDP per capita growth Results with panel dynamic GMM
(1) (2) (3) (4)
GDP per capita (-1) 0.241*** 0.267*** 0.233*** 0.245***
Trade items
Share of mineral fuel exports to China to such exports to
OECD 0.051***
Share of crude materials exports to China to such exports to
OECD 0.011**
Share of manufactured imports from China to such imports
from OECD 0.121**
Share of machinery imports from China to such imports from
OECD 0.108***
Trade openness (in% of GDP) 0.011** 0.018** 0.016** 0.013* Fixed K formation (in % of GDP) 0.127** 0.133** 0.115** 0.1437**
Inflation rate -0.001 -0.001 -0.001 -0.001*
TOT 0.018*** 0.015*** 0.011** 0.019**
Human capital 0.002* 0.003* 0.005* 0.008*
Bureaucracy quality index -0.261* -0.233* -0.288* -0.312*
Period
1984-2014
1984-2014
1984-2014
1984-2014
Obs 309 309 309 309
J-statistics 1.12 1.31 1.71 1.08
Arellano-Bond serial correlation test AR(1) 1.83 1.97 2.06 2.78 Arellano-Bond serial correlation test AR(2) 0.51 0.67 0.81 0.91
Jarque-Bera normality test 1.43 1.05 1.14 1.27
Note: The estimation method is a dynamic panel - GMM. The dependent variable is the growth rate of real GDP per capita. SSA countries are included in the dataset. Annual data are used.. * indicates 10% significance level, ** indicates 5% significance level, and *** indicates 1% significance level. These significance levels are equal to one minus the probability of rejecting the null hypothesis of zero coefficients. J-test is for overidentification problem where H0: there is no overidentification problem. We fail to reject in each case. For serial correlation z-tests, H0 is "there is no serial correlation"; and for normality test, H0 is "normal distribution". We fail to reject H0 in each test except AR(1). AR(1) test is rejected as expected. Due to space limitation, estimated coefficients of time and country dummies are not reported in the table.
In the second panel of the table, the commodity-based exports are studied. While the estimated coefficient of growth of the mineral fuel exports to China is 0.177, it is 0.112 for the crude material exports to China. Both coefficients are statistically significant. The coefficients of the mineral fuel and crude material exports to the OECD countries are also statistically significant at the 10 percent level, but their sizes are smaller, indicating a significantly lower economic contribution when compared to the contribution of the exports to China. The economic impact of the crude material exports to China on SSA growth is almost three times larger, based on the estimated coefficients reported in columns (7) and (8) of Table 6. In each case, the estimated coefficient of TOT is positive and statistically significant, pointing out the importance of the indirect effect of increasing trade. A tougher competition for SSA’s products in the international markets results in price advantages for SSA countries. Higher revenues from trade with higher prices can improve income growth in the region.
N. Bayraktar / Eurasian Journal of Economics and Finance, 5(1), 2017, 95-113
110
Table 6. Regression results for SSA’s commodity-based exports and imports (growth rates)
Dependent variable: GDP per capita
growth Results with panel dynamic GMM
(1) (2) (3) (4)
GDP per capita (-1) 0.288*** 0.267*** 0.251*** 0.235***
Trade items
Growth of manufactured imports from China 0.211**
Growth of manufactured imports from OECD -0.041 … Growth of machinery imports from China 0.153**
Growth of machinery imports from OECD 0.021*
Trade openness (in% of GDP) 0.021* 0.019* 0.023* 0.033* Fixed K formation (in % of GDP) 0.123* 0.117** 0.121* 0.113**
Inflation rate -0.001 -0.001* -0.001* -0.001
TOT 0.012** 0.014** 0.012* 0.017**
Human capital 0.004* 0.005* 0.001 0.007
Bureaucracy quality index -0.291* -0.331* -0.301* -0.295*
Period 1984-2014 1984-2014 1984-2014 1984-2014
Obs 309 309 309 309
J-statistics 1.01 1.53 0.91 1.18
Arellano-Bond serial correlation test AR(1) 2.21 2.17 1.91 1.88 Arellano-Bond serial correlation test AR(2) 0.77 0.81 0.97 0.61
Jarque-Bera normality test 1.53 1.58 1.04 1.14
Results with panel dynamic GMM
(5) (6) (7) (8)
GDP per capita (-1) 0.223*** 0.212*** 0.288*** 0.211***
Trade items
Growth of mineral fuel exports to China 0.177**
Growth of mineral fuel exports to OECD 0.011*
Growth of crude materials exports to China 0.112***
Growth of crude materials exports to OECD 0.041*
Trade openness (in% of GDP) 0.012** 0.021* 0.022* 0.038* Fixed K formation (in % of GDP) 0.112** 0.121*** 0.117** 0.133***
Inflation rate -0.001 -0.001 -0.001 -0.001
TOT 0.013*** 0.012** 0.015*** 0.014***
Human capital 0.004* 0.007 0.001 0.006*
Bureaucracy quality index -0.331* -0.301* -0.322* -0.291*
Period 1984-2014 1984-2014 1984-2014 1984-2014
Obs 309 309 309 309
J-statistics 0.42 1.13 1.54 0.38
Arellano-Bond serial correlation test AR(1) 2.71 2.81 2.16 2.28 Arellano-Bond serial correlation test AR(2) 0.67 0.81 0.87 1.08
Jarque-Bera normality test 0.78 1.51 1.31 1.04
Note: The estimation method is a dynamic panel - GMM. The dependent variable is the growth rate of real GDP per capita. SSA countries are included in the dataset. Annual data are used. * indicates 10% significance level, ** indicates 5% significance level, and *** indicates 1% significance level. These significance levels are equal to one minus the probability of rejecting the null hypothesis of zero coefficients. J-test is for overidentification problem where H0: there is no overidentification problem. We fail to reject in each case. For serial correlation z-tests, H0 is "there is no serial correlation"; and for normality test, H0 is "normal distribution". We fail to reject H0 in each test except AR(1). AR(1) test is rejected as expected. Due to space limitation, estimated coefficients of time and country dummies are not reported in the table.
5. Conclusion and policy implications
N. Bayraktar / Eurasian Journal of Economics and Finance, 5(1), 2017, 95-113
111
Even though growth rates have been improving in the SSA region, exporters of primary commodities to China and policymakers of the region should overcome many challenges caused by the changing trade links. One of the main problems for policymakers of the SSA region is that they need to figure out how to respond to the competitive strengths of China, and they need to be very careful about the structure of the bilateral trade. Without required adjustments, SSA countries may end up with a huge trade deficit with China. In the past, the SSA countries suffered tremendously due to the structure of trade with the OECD countries. Similar to the trade link between the OECD and SSA countries, trade with China can reproduce the core-periphery structure in which manufactured products are exchanged for primary commodities. Another important challenge for the SSA countries is the long- and medium-term sustainability of the exports to China. The exports to China may not continue at the same speed even in the short run. In the SSA region, we have already started seeing the negative effects of recently declining growth rates in China.
Another issue is that the SSA countries exporting primary and raw commodities must diversify the range of exports. Policymakers in SSA also need to deal with possible negative effects of Dutch Disease as a result of higher exports. Dutch Disease can lead to higher domestic prices and wages, which can cut down the already-low international competitiveness of the SSA region.
There are also concerns about the distribution of benefits from higher trade. Despite higher growth rates and average income, we do not see improvements in lower-income groups of the region. Poverty rates are still higher. Overall, seeking more engagement in trade without proper planning can cause many problems in the future despite all its current benefits.
References
Agyekum, C.K., Haifeng,H.,and Agyeiwaa, A., 2015.Review of China’s trade on the economic growth of Ghana. American Journal of Economics, 5(3), pp. 315-320.
Arellano, M., and Bond, S., 1991. Some tests of specification for panel data: Monte Carlo evidence and application to employment equations. Review of Economic Studies, 58(2), pp. 277-297. https://doi.org/10.2307/2297968
Arellano, M., and Bover., O., 1995. Another look at instrumental variable estimation of error component models. Journal of Econometrics, 68(1), pp. 29–51. https://doi.org/10.1016/0304-4076(94)01642-D
Barro, R., J., 1996. Determinants of economic growth: A cross-country empirical study. NBER Working Paper, No. 5698 (August).
Barro, R., J. and Sala-i-Martin, X., 2003.Economic growth. 2nd. ed. New York, NY: McGraw-Hill. Bayraktar, N., 2017.Changing International Trade Linkages in Sub-Saharan Africa: BRIC Versus OECD Countries. In: E. Wamboye, E. A. Tiruneh eds.Foreign Capital Flows and Economic Development in Africa. U.K.: Palgrave Macmillan (forthcoming).
Bayraktar, N., and Moreno-Dodson, B., 2015. How can public spending help you grow? An empirical analysis for developing countries. Bulletin of Economic Research, 67(1), pp. 30–64. https://doi.org/10.1111/j.1467-8586.2012.00473.x
Blundell, R. and Bond, S., 1998. Initial conditions and moment restrictions in dynamic panel data models. Journal of Econometrics, 87(1), pp. 115– 143. https://doi.org/10.1016/S0304-4076(98)00009-8
Bose, N., Haque M.E., and Osborn, D. R., 2007, Public Expenditure and Economic Growth: A disaggregated analysis for developing countries. The Manchester School, 75, pp. 533-556. https://doi.org/10.1111/j.1467-9957.2007.01028.x
Busse, M., Erdogan, C., and Mühlen, H., 2016. China's impact on Africa - The role of trade, FDI and aid. Kyklos, 69(2), pp. 228-262. https://doi.org/10.1111/kykl.12110
Diallo, O., and Tapsoba, S., 2014. Rising BRICs and changes in Sub-Saharan Africa’s business cycle patterns. IMF Working Paper, No: WP/14/35 (February).
N. Bayraktar / Eurasian Journal of Economics and Finance, 5(1), 2017, 95-113
112
Edwards, S., 1993. Openness, Trade Liberalization, and Growth in Developing Countries. Journal of Economic Literature, 31(3), pp. 1358-1393.
Hadzhiev, V., 2014. Overall revealed comparative advantages. Eurasian Journal of Economics and Finance, 2(1), pp. 47-53.
International Monetary Fund, 2016. Direction of Trade Database. Washington DC: International Monetary Fund.
Jenkins, R., and Edwards, C., 2006.The economic impacts of China and India on sub-Saharan Africa: Trends and prospects. Journal of Asian Economics, 17(2),pp. 207–225. https://doi.org/10.1016/j.asieco.2006.02.002
Kaplinsky, R., and Messner., D., 2008. Introduction: The impact of Asian drivers on the developing world. World Development, 36(2), pp. 197-209. https://doi.org/10.1016/j.worlddev.2007.06.006
Kaplinsky, R., and Morris, M., 2008. Do the Asian drivers undermine export-oriented industrialization in SSA?World Development, 36(2), pp. 254-273. https://doi.org/10.1016/j.worlddev.2007.06.007
Kummer‐Noormamode, S., 2014. Does trade with China have an impact on African countries’ growth? African Development Review, 26(2), pp. 397–415. https://doi.org/10.1111/1467-8268.12100
Sachs, J., D., and Warner, A., M., 1995. Natural resource abundance and economic growth. NBER Working Paper, No. 5398 (December).
Samake, I., and Yang, Y., 2011. Low-Income countries’ BRIC linkage: Are there growth spillovers? IMF Working Paper, No: WP/11/267 (November).
United Nations, 2016. Comtrade. New York: United Nations.
United Nations Economic Commission for Africa, 2013. Africa–BRICS cooperation: Implications for growth, employment and structural transformation in Africa. Addis Ababa: United Nations Economic Commission for Africa.
Wang, J.-Y., 2007. What drives China’s growing role in Africa? IMF Working Paper, No: WP/07/211 (October).
N. Bayraktar / Eurasian Journal of Economics and Finance, 5(1), 2017, 95-113
113 Appendix. List of variables
Variable
Definition
Source
Exports of goods and services
Exports of goods and services represent the value of all goods and other market services provided to the rest of the world. They include the value of merchandise, freight, insurance, transport, travel, royalties, license fees, and other services, such as communication, construction, financial, information, business, personal, and government services. They exclude compensation of employees and investment income (formerly called factor services) and transfer payments.
IMF’s Direction of Trade Imports of goods and services
Imports of goods and services represent the value of all goods and other market services received from the rest of the world. They include the value of merchandise, freight, insurance, transport, travel, royalties, license fees, and other services, such as
communication, construction, financial, information, business, personal, and government services. They exclude compensation of employees and investment income (formerly called factor services) and transfer payments.
IMF’s
Direction of Trade
GDP per capita growth (annual %)
Annual percentage growth rate of GDP per capita based on constant local currency. Aggregates are based on constant 2005 U.S. dollars. GDP per capita is gross domestic product divided by midyear population. GDP at purchaser's prices is the sum of gross value added by all resident producers in the economy plus any product taxes and minus any subsidies not included in the value of the products. It is calculated without making deductions for depreciation of fabricated assets or for depletion and degradation of natural resources.
World Ba k’s
World Development Indicators
Gross fixed capital formation (% of GDP)
Gross fixed capital formation (formerly gross domestic fixed investment) includes land improvements (fences, ditches, drains, and so on); plant, machinery, and equipment purchases; and the construction of roads, railways, and the like, including schools, offices, hospitals, private residential dwellings, and commercial and industrial buildings.
IMF’s World
Economic Outlook
Terms of trade (goods and services, 2005 = 100)
The terms of trade index shows the national accounts exports price index divided by the imports price index, with 2005 equaling 100.
World Ba k’s
World Development Indicators Trade openness Exports plus imports in percent of GDP World Ba k’s
World Development Indicators Human capital (indexed number)
Following Bose, Haque, and Osborn (2007) and Barro and Sala-i-Martin (2003), we construct the human capital variable as the weighted sum of the enrolment ratios (%) in primary and secondary schools and in higher education. The weights are 1 for primary school enrolment ratio, 2 for secondary school and 3 for enrolment in higher education. The weights are approximations to the relative values of three types of education.
Author’s
calculation
Inflation, consumer prices (annual %)
Inflation as measured by the consumer price index reflects the annual percentage change in the cost to the average consumer of acquiring a basket of goods and services that may be fixed or changed at specified intervals, such as yearly.
World Ba k’s
World Development Indicators Bureaucracy
quality
The range of the series is between 0 and 4, where 0 corresponds to the lowest quality. The
i dicator’s ethodolog is defi ed i the ICRG User Guide i the follo i g a : The
institutional strength and quality of the bureaucracy is another shock absorber that tends to minimize revisions of policy when governments change. Therefore, high points are given to countries where the bureaucracy has the strength and expertise to govern without drastic changes in policy or interruptions in government services. In these low-risk countries, the bureaucracy tends to be somewhat autonomous from political pressure and to have an established mechanism for recruitment and training. Countries that lack the cushioning effect of a strong bureaucracy receive low points because a change in government tends to be traumatic in terms of policy formulation and day-to-da ad i istrati e fu ctio s.
International Country Risk Guide Database
Share of exports to BRIC
Total alue of a ““A cou tr ’s e ports to BRIC as a share of total e ports of the cou tr Author’s calculation Share of exports
to the OECD
Total alue of a ““A cou tr ’s e ports to the OECD cou tries as a share of total e ports of
the country
Author’s
calculation Share of imports
to BRIC
Total alue of a ““A cou tr ’s i ports fro BRIC as a share of total i ports of the cou tr Author’s
calculation Share of imports
to the OECD
Total alue of a ““A cou tr ’s i ports fro the OECD cou tries as a share of total i ports
of the country
Author’s calculation Different trade
items
UN Comtrade Database Author’s