ACPD
14, 24915–24942, 2014Systematic UT cloud tilt
J. Gong et al.
Title Page
Abstract Introduction
Conclusions References
Tables Figures
◭ ◮
◭ ◮
Back Close
Full Screen / Esc
Printer-friendly Version Interactive Discussion
Discussion
P
a
per
|
Discus
sion
P
a
per
|
Discussion
P
a
per
|
Discussion
P
a
per
Atmos. Chem. Phys. Discuss., 14, 24915–24942, 2014 www.atmos-chem-phys-discuss.net/14/24915/2014/ doi:10.5194/acpd-14-24915-2014
© Author(s) 2014. CC Attribution 3.0 License.
This discussion paper is/has been under review for the journal Atmospheric Chemistry and Physics (ACP). Please refer to the corresponding final paper in ACP if available.
Meridionally-tilted ice cloud structures in
the tropical Upper Troposphere as seen
by CloudSat
J. Gong1,2, D. L. Wu2, and V. Limpasuvan3
1
University Space Research Association, Columbia, MD, USA
2
Climate and Radiation Branch, MC 613.2, NASA/Goddard Space Flight Center, Greenbelt, MD, USA
3
School of Coastal and Marine Systems Science, Coastal Carolina University, Conway, SC, USA
Received: 3 September 2014 – Accepted: 19 September 2014 – Published: 26 September 2014
Correspondence to: J. Gong ([email protected])
ACPD
14, 24915–24942, 2014Systematic UT cloud tilt
J. Gong et al.
Title Page
Abstract Introduction
Conclusions References
Tables Figures
◭ ◮
◭ ◮
Back Close
Full Screen / Esc
Printer-friendly Version Interactive Discussion
Discussion
P
a
per
|
Discus
sion
P
a
per
|
Discussion
P
a
per
|
Discussion
P
a
per
Abstract
It remains challenging to quantify global cloud properties and uncertainties associated with their impacts on climate change because of our poor understanding of cloud three-dimensional (3-D) structures from observations and unrealistic/unconsidered charac-terization of 3-D cloud effects in Global Climate Models (GCMs). In this study we find
5
cloud 3-D effects can cause significant error in cloud ice and radiation measurements if it is not taken into account appropriately.
One of the cloud 3-D complexities, the slantwise tilt structure, has not received much attention in research and even little report is given on its global perspective. A novel ap-proach is presented here to analyze the ice cloud water content (IWC) profiles retrieved
10
from CloudSat and a joint radar-lidar product (DARDAR). By integrating IWC along dif-ferent tilt angles, we find that Upper-Troposphere (UT) ice cloud mass between 11 and 17 km is tilted poleward from active convection centers in the tropics. This systematic tilt in cloud mass structure is expected from the mass conservation principle of the Hadley circulation with the divergent flow of each individual convection/convective
sys-15
tem from down below, and its existence is further confirmed from cloud-resolving scale Weather Research and Forecasting (WRF) model simulations. Thus, additive effects of tilted cloud structures can induce 5–20 % variability by nature or an error in satel-lite cloud/hydrometeor ice retrievals if simply converting it from slant to nadir column. A surprising finding is the equatorward tilt in middle tropospheric (5–11 km) ice clouds,
20
which is also evident in high-resolution model simulations but not in coarse-resolution simulations with cumulus parameterization. The observed cloud tilt structures are in-trinsic properties of tropical clouds, producing synoptic distributions around the ITCZ. These findings imply that current interpretations based on over-simplified cloud vertical structures could lead to substantial cloud measurement errors and induce subsequent
25
ACPD
14, 24915–24942, 2014Systematic UT cloud tilt
J. Gong et al.
Title Page
Abstract Introduction
Conclusions References
Tables Figures
◭ ◮
◭ ◮
Back Close
Full Screen / Esc
Printer-friendly Version Interactive Discussion
Discussion
P
a
per
|
Discus
sion
P
a
per
|
Discussion
P
a
per
|
Discussion
P
a
per
1 Introduction
Understanding and predicting climate changes require accurate measurements of Earth’s radiation budget. Due to its large variability in space and time, cloud radiative effect (CRE) poses arguably the greatest difficulty in estimating the radiation budget balance at both top of atmosphere (TOA) and surface. Complexities in cloud
three-5
dimensional (3-D) structures, in particular, are one of the primary sources of the uncer-tainty and difficulty, which affect satellite cloud observations as well as CRE calculations in Global Climate Models (GCMs).
Cloud 3-D effects manifest themselves as multiple forms from irregular visible out-looks to internal banded mass/energy structures. These detailed structures are often
10
not fully resolved in satellite observations due to large sampling footprint size and, sub-sequently, neglected in GCMs. Oversimplified or improper treatment of the cloud 3-D structure increases the uncertainties or generates additional biases of satellite cloud property retrievals (Marshak et al., 2006), GCM simulations of cloud fields (Cahalan et al., 1994) and atmospheric constituent retrievals (Ming and Zhang, 2014).
15
As one key vertical aspect of cloud 3-D structure, cloud slantwise tilt is inherently linked to cloud thermodynamics and gravity waves coupled with heating profiles. Sys-tematic cloud tilt structures can have profound impacts on cloud remote sensing and radiation calculations. For example, they partially account for the anisotropy of the cloud radiative forcing (Fu et al., 2000; Gong and Wu, 2013) and modulate the
hy-20
drological cycle (Naud et al., 2010). Neglecting or misrepresenting of the cloud tilt induces additional biases in satellite retrieval of cloud properties (e.g., Hong et al., 2005) and increases uncertainty of model CRE estimation (e.g., Li and Barker, 2002). In GCM, cloud slantwise tilt is tied to the “overlap” parameter, which is assumed to be “maximum-random” globally in most GCMs to achieve the desired cloud fraction
25
ACPD
14, 24915–24942, 2014Systematic UT cloud tilt
J. Gong et al.
Title Page
Abstract Introduction
Conclusions References
Tables Figures
◭ ◮
◭ ◮
Back Close
Full Screen / Esc
Printer-friendly Version Interactive Discussion
Discussion
P
a
per
|
Discus
sion
P
a
per
|
Discussion
P
a
per
|
Discussion
P
a
per
Very few global surveys are reported on cloud tilt structures so far. It is difficult for passive sensors because of their coarse vertical/horizontal resolutions and variable penetration depths, yielding ambiguous information about cloud internal structures. Nevertheless, Gong and Wu (2011, 2013a, b) were able to derive cloud tilt statistics of the Upper Troposphere cloud in the zonal direction using radiance data from NASA’s
5
Aqua Atmospheric Infrared Sounder (AIRS) and NOAA’s Microwave Humidity Sounder (MHS). Ground-based cloud radars often observe tilt structures locally but in time do-main and are sometimes contaminated by rain signals (Huang et al., 2012).
In this study we make a novel use of polar-orbiting CloudSat Cloud Profiling Radar (CPR) data to characterize global cloud tilt structures in the meridional direction.
Cloud-10
Sat provides an unprecedented quality of high-resolution ice water content (IWC) mea-surements for investigating cloud internal structures in the Upper-Troposphere (UT) (Protat et al., 2009). By integrating CloudSat IWC along different slant paths, we find that tropical clouds at height greater than 11 km are systematically tilted poleward from active convection centers. The observed cloud tilt structures resemble the divergent
15
flow at the top of deep convection and convergence below in the tropical branch of the Hadley circulation.
2 Datasets, model and methodology
Launched in April 2006 into a Sun synchronous orbit, CloudSat has the same equator crossing time (∼1.30 p.m./a.m. LT) on the ascending/descending as other A-Train
con-20
stellation members. CloudSat CPR, a 94 GHz nadir-scan radar, returns the aggrega-tion of 600 pulses every 0.16 s during which the platform travels 1.1 km (http://disc.sci. gsfc.nasa.gov/atdd/documentation/ATrainTracks.pdf). The CloudSat IWC product from 2B-CWC-RO V008 has a vertical resolution of ∼0.25 km and horizontal resolution of∼1.1 km. Despite having been validated against aircraft measurements and many
25
thresh-ACPD
14, 24915–24942, 2014Systematic UT cloud tilt
J. Gong et al.
Title Page
Abstract Introduction
Conclusions References
Tables Figures
◭ ◮
◭ ◮
Back Close
Full Screen / Esc
Printer-friendly Version Interactive Discussion
Discussion
P
a
per
|
Discus
sion
P
a
per
|
Discussion
P
a
per
|
Discussion
P
a
per
old, and the W-band radar tends to suffer from attenuation and/or multiple-scattering below 9 km when cloud is heavily precipitating (Protat et al., 2009). CALIPSO’s Cloud-Aerosol Lidar with Orthogonal Polarization (CALIOP) is a great complement to fill in the thin ice cloud part of the picture missed by CloudSat. A recently published joint IWC retrieval product (DARDAR) combining CloudSat-CALIPSO-MODIS (Moderate
Resolu-5
tion Imaging Spectroradiometer) observations shows robust consistency with CloudSat IWC without losing the signal from thin ice clouds (Delanoe et al., 2010, 2013; Eliasson et al., 2013). Due to the limitation of CloudSat IWC product, this study will focus primar-ily on ice cloud above 9 km. Nonetheless, we will briefly address the tilt characteristic of ice cloud between 5 km (roughly the freezing height) and 9 km as cloud tilt structure
10
continuously evolve with height.
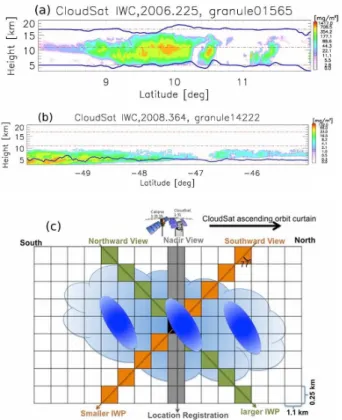
Figure 1a and b showed two examples of CloudSat IWC curtains at two random days, when one can see anvils and cirrus clouds associated with a tropical deep convection fanning out meridionally in the Upper Troposphere (Fig. 1a), while the clouds in the mid-latitude frontal system case apparently all tilt northward (Fig. 1b). DARDAR data
15
(Fig. 2) are broadly consistent with those from CloudSat with some subtle differences. For example, DARDAR ice cloud product reveals a thin cirrus layer above the anvil clouds in the tropical deep convection case that is not detected by CloudSat.
To better understand the genesis of cloud tilt structures, we carried out mesoscale numerical simulations using Weather Research and Forecasting (WRF) model in
20
a tropical region. As a regional mesoscale model, WRF has been widely used for re-gional weather/climate studies and includes sophisticated cloud microphysics to rep-resent the real atmosphere as good as possible (http://wrf-model.org). Yet, it is able to simulate the atmosphere for a much larger domain than cloud resolving models (CRMs). For the purpose of the current study, WRF simulations are designed to have
25
ACPD
14, 24915–24942, 2014Systematic UT cloud tilt
J. Gong et al.
Title Page
Abstract Introduction
Conclusions References
Tables Figures
◭ ◮
◭ ◮
Back Close
Full Screen / Esc
Printer-friendly Version Interactive Discussion
Discussion
P
a
per
|
Discus
sion
P
a
per
|
Discussion
P
a
per
|
Discussion
P
a
per
In the CloudSat data analysis, we introduce a new approach for integrating the IWC measured along the orbital curtain (like that shown in Fig. 1). To mimic an “off-nadir” or “limb” viewing condition, we integrate the IWC profile along different slant paths by adding IWC at each unit volume (Fig. 1c). Therefore in this analysis, without involving interpolation, each path has the same path length, and any differences between the
5
IWCs integrated from different paths are due to cloud internal structural properties. This slantwise integration of IWC, or ice water path (IWP), is the key concept in the current study. If the ice cloud density is randomly distributed or homogeneous inside a cloud, the IWP values integrated along the grey (nadir), orange (southward view, or S-view) and green (northward view, or N-view) paths would show no differences. If
10
the cloud ice tilts internally to the left, as shown by the blue ovals in Fig. 1c, the IWP along the green path would be the largest among the three paths. Hence, if we define
∆IWP=IWP|S-view−IWP|N-view,a positive (negative)∆IWPvalue means that the cloud tilts northward (southward). In Fig. 1a, the blue line at 17 km height, which represents
∆IWP integrated between 11 and 17 km with a view-angle of 77◦, is negative (positive)
15
at the south (north) flank of the deep convections down below, which indicates an outward divergent flow. In Fig. 1b, the blue line at 5 km height, corresponding to∆IWP integrated between 5 and 11 km with the same view-angle, has a positive sign in most places, which translates to a systematic northward tilt of mid-level frontal clouds. These two real cases demonstrate the validity of our method. The same method is applied to
20
WRF simulations to infer cloud tilt structures.
In theory, ∆IWP can be computed from different pairs of slantwise “scan-angles”. For example, in the case of Fig. 1c, the equivalent scan angle is 77◦ as the tangent value of 77◦ equals to the CloudSat grid box length/width ratio (i.e., 1.1/0.25 km). The IWC profile is initially interpolated to 250 m vertical mesh (roughly the original vertical
25
ACPD
14, 24915–24942, 2014Systematic UT cloud tilt
J. Gong et al.
Title Page
Abstract Introduction
Conclusions References
Tables Figures
◭ ◮
◭ ◮
Back Close
Full Screen / Esc
Printer-friendly Version Interactive Discussion
Discussion
P
a
per
|
Discus
sion
P
a
per
|
Discussion
P
a
per
|
Discussion
P
a
per
view-angle will be shown in the following section based on the fact that the resulting patterns remain largely robust for all 4 pairs of angle. Since interpolation was not con-ducted along the slantwise path, neither interpolation-associated spurious signals nor scan angle dependency exists. As the tropical ice clouds usually extend from 5 km to 17 km, the cloud structure is therefore divided into two equally thick layers for analysis:
5
5–11 km and 11–17 km, in order to give them equal weight during the analysis process. The 11 km level also roughly separates the middle and Upper Troposphere at the trop-ics. In each layer, the cloud center of mass is assumed to be in the middle of the layer for the location registration (e.g., the location of the gray bar in Fig. 1c). The parallax is-sue is mostly solved by this assumption through large sample integration. Furthermore,
10
since∆IWP is computed instantaneously for slantwise and nadir views, the local time difference issue which is unavoidable for cross-track scanners is eliminated, although we can only infer the cloud meridional tilt structure here. Same method is likewise ap-plied to the DARDAR product. This paper will focus on presenting the systematic cloud tilt structure in the Upper-Troposphere (UT) between 11 and 17 km in the tropics. The
15
results in the lower level, which has some limitations, will be shown for completeness. Finally, Aura Microwave Limb Sounder (MLS) radiance (TB) data at 640 GHz is used
to illustrate the potential impact of our finding on satellite retrievals. The 640 GHz chan-nel has a weighting function peaking at tangent height∼12 km, and it is only sensitive to ice cloud. By averaging the 20 saturated radiance measurements from this channel,
20
we can safely beat down the noise and distill the complex cloud information (Wu and Eckermann, 2008). The MLS 640 GHz forward-looking has an even shallower view-ing angle (86◦). Therefore, by defining∆TB=TB|night−TB|day, we can mimic the slantwise
“scan-angle” that is used to compute the CloudSat∆IWP. However, MLS∆TBcontains all-sky information from the cloud structure, cloud diurnal variation and other signals
25
ACPD
14, 24915–24942, 2014Systematic UT cloud tilt
J. Gong et al.
Title Page
Abstract Introduction
Conclusions References
Tables Figures
◭ ◮
◭ ◮
Back Close
Full Screen / Esc
Printer-friendly Version Interactive Discussion
Discussion
P
a
per
|
Discus
sion
P
a
per
|
Discussion
P
a
per
|
Discussion
P
a
per
3 Upper-Troposphere cloud tilt in the tropics
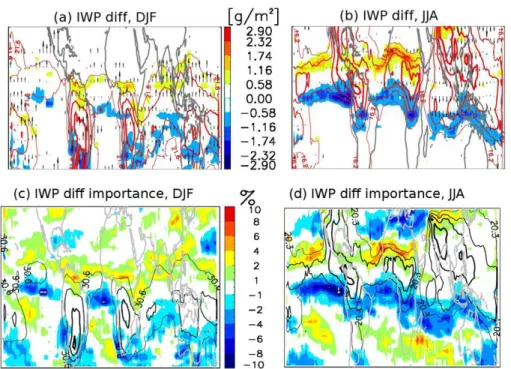
By differentiating the CloudSat IWP in the Upper Troposphere (11–17 km) along the 77◦ viewing angles (S-view minus N-view), we found that UT ice cloud mass in the tropics tilted systematically poleward in both hemispheres, as shown in the left panel of Fig. 3 for the December-January-February (DJF) and right panel for the June-July-August
5
(JJA) composites. The time separation roughly characterizes two broad tropical deep convective zones, namely South America, South Africa and Western Pacific during DJF, and west of Central America, West Africa, and Asian Monsoon region including the Maritime Continent during JJA. The maps derived from ascending and descending orbits separately are highly similar to each other (not shown). Given the fact that
Cloud-10
Sat’s orbit is not strictly perpendicular to the equator, the highly consistent geographic patterns between the day (ascending) and night (descending) imply that the signals should mainly originate from the meridional direction rather than the zonal direction. The relative importance of the mass asymmetry due to the systematic tilt, as measured by∆IWP/IWP, could easily reach up to 20 % near the two flanks of the aforementioned
15
tropical deep convective zones (Fig. 2c and d). The sign of the difference is consistent among all four view-angle pairs (not shown), except that the magnitude increases with increasing view angle values, indicating that the UT ice cloud mass is tilted in a very shallow angle with respect to the horizon (≤13◦). Yet, these clouds are not completely flat, which should otherwise result in no difference of IWP between paired views.
Simi-20
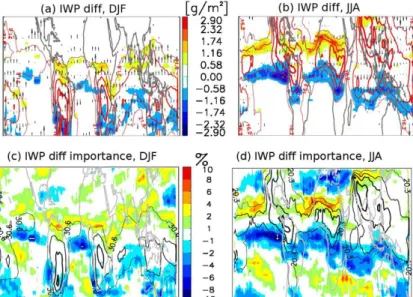
lar analysis has also been carried out with DARDAR IWC profiles, and the patterns are highly consistent with what were found from CloudSat except that the magnitude of the difference is slightly smaller while the relative importance remains the same order of magnitude (Fig. 4). This is to be expected for IWP as CloudSat alone can detect the majority of cloud ice. The broad consistency between CloudSat and DARDAR analysis
25
results validate the robustness of our findings.
ACPD
14, 24915–24942, 2014Systematic UT cloud tilt
J. Gong et al.
Title Page
Abstract Introduction
Conclusions References
Tables Figures
◭ ◮
◭ ◮
Back Close
Full Screen / Esc
Printer-friendly Version Interactive Discussion
Discussion
P
a
per
|
Discus
sion
P
a
per
|
Discussion
P
a
per
|
Discussion
P
a
per
south during DJF than the latitude migration of the Inter-tropical Convergence Zones (ITCZ). The “upward diverging” feature is not only ubiquitous in the tropics, but also present at the north and south flanks of mid-latitude summer active convection regions such as the Southern Pacific Convergence Zone (SPCZ) during DJF, and central United States and the Southern Europe during JJA, where deep convective towers often
pen-5
etrate upward beyond the 11 km level. Note that the smoothing window is narrower in the top panels of Fig. 3 to highlight these mid-latitude details. The major reason that no signals were found from the rest of mid-latitude area is due to a shallower tropopause height there (<11 km). Same analyses were performed by truncating the mid-latitude troposphere into 5–8 km and 8–11 km sectors. Systematic poleward tilt is discovered
10
in the 8–11 km layer cloud in the winter mid-latitude along storm tracks (not shown). Therefore, we should not interpret you much about the relative importance maps in the mid-latitude as the sample size is very limited above 11 km.
Intuitively, the systematic cloud tilt should be somewhat related to the local or gen-eral circulation. In the meridional direction at the tropics, the Hadley Cell dominates
15
the tropospheric circulation, which has the convergence flow at the lower level in the tropics, and divergence flow at the upper level in the subtropics. In reality, Hadley Cell has a complicated longitudinal structure. The cloudy-sky meridional wind derived from Modern-Era Retrospective analysis for Research and Applications (MERRA) analysis datasets is overlaid as arrows in Fig. 3a and b to illustrate the divergent upper-level
20
branch of the Hadley Cell circulation in most places over the tropics. Here, the cloudy-sky is defined as MERRA IWC larger than 10 mg m−3anywhere between 11 and 17 km in altitude. The divergent flow is generally larger at the peripheries of the active tropi-cal convective regions than that close to the centers, coinciding with the largest cloud asymmetry patterns. This suggests that the systematic UT cloud mass tilt does
some-25
ACPD
14, 24915–24942, 2014Systematic UT cloud tilt
J. Gong et al.
Title Page
Abstract Introduction
Conclusions References
Tables Figures
◭ ◮
◭ ◮
Back Close
Full Screen / Esc
Printer-friendly Version Interactive Discussion
Discussion
P
a
per
|
Discus
sion
P
a
per
|
Discussion
P
a
per
|
Discussion
P
a
per
with pan-continent scale anti-cyclonic monsoon circulation, yet the cloud mass tilt is not controlled by this large-scale circulation but still follows the Hadley-cell type of di-vergence flow pattern. More interestingly, the results suggest that UT cloud mass tilt does not follow the shape of the tropopause that slopes down away from the equator. The implications will be discussed in the next section. The meridional wind over central
5
US and Southern Europe during JJA is very small and non-divergent, again indicates that the UT cloud tilt does not always follow the general circulation.
Ice cloud tilt in the Middle Troposphere (5–11 km) still has some ambiguities due to large uncertainties embedded in IWC retrievals below 9 km for heavily precipitating cases. Even if we could exclude those cases, IWC itself cannot reveal the entire cloud
10
mass/shape structure in the lower level as liquid and mixed-phase clouds dominate the lower level (e.g., see the round-up at the bottom of Fig. 1a). Preliminary results from CloudSat suggest that 5–11 km ice cloud mass at the tropics tilt the opposite way with that in the UT (i.e., upward while equatorward), although the cloudy-sky wind in that altitude range is still weakly divergent in the broad picture as suggested by
15
MERRA analysis and Multi-angle Imaging SpectroRadiometer (MISR) mid-level wind datasets (not shown). Meanwhile, mass tilt in this altitude range is barely statistically significant as noted in DARDAR (not shown). Given the fact that the ice mass tilt in the Middle Troposphere is largely debatable, we will show using the WRF simulations that CloudSat results might be more reasonable.
20
As seen in Fig. 3d, the UT cloud tilt is relatively more important along the ITCZ cloud bands to the west of Central America and Central Africa, while the situation is more complicated and less important in the Asian monsoon region. Therefore, west of Central America (WCA) with a relatively simple surface condition is an ideal region to conduct a numerical experiment to investigate the underlying causes of the observed
25
tilt.
ACPD
14, 24915–24942, 2014Systematic UT cloud tilt
J. Gong et al.
Title Page
Abstract Introduction
Conclusions References
Tables Figures
◭ ◮
◭ ◮
Back Close
Full Screen / Esc
Printer-friendly Version Interactive Discussion
Discussion
P
a
per
|
Discus
sion
P
a
per
|
Discussion
P
a
per
|
Discussion
P
a
per
Final Analyses (FNL) served as the boundary and initial conditions. In a nested con-figuration, the model has a primary domain (D01) with a 30 km horizontal resolution, a secondary domain (D02) with a 10 km horizontal resolution, and the innermost do-main (D03) with a 3 km horizontal resolution. The vertical resolution is roughly 500 m from the surface up to 50 hPa (the model top). The inner domain boundary is [118◦W,
5
77◦W], [2.5◦S, 22.5◦N]. No damping of vertical motion or gravity wave is specified. As part of the provided microphysical scheme in WRF, the Morrison double moment scheme with forecast for 6 hydrometers in every time step was employed for all runs (Morrison et al., 2009). Since the cumulus parameterization has been turned offin D03, this configuration can reasonably capture the cloud vertical structure, despite the fact
10
that clouds smaller than 24 km in horizontal and 4 km in vertical directions (∼8×grid size) would be significantly under-resolved. Results from D02 with cumulus parameter-ization served as the sensitivity experiment to test whether realistic convection without subgrid-scale parameterization is the key to reproduce the observed cloud slantwise tilt. The hourly output from D02 and D03 was first interpolated to 250 m (1 km) vertical
15
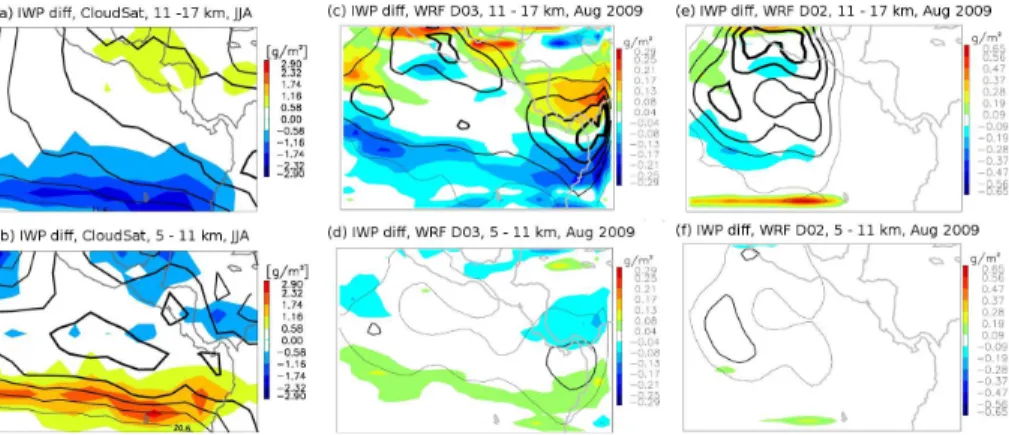
(horizontal) resolution and then analyzed and averaged together to represent the cli-matological mean condition. Although technically the same procedure can be applied to 77◦ and 65◦ viewing angles, it is meaningless to do so due to the coarser original resolution compared with that of CloudSat. Therefore, only difference computed at 48◦ view is shown in Fig. 5.
20
Overall, D03 simulations show impressive agreement with CloudSat observation in terms of the geographical distributions of the mean IWP and the systematic ice cloud mass tilt in both the middle and Upper Troposphere. Given the fact that we are compar-ing 6 day simulations (with a hourly outputs; Fig. 5c and d) with 12 months of CloudSat overpass samples in the same region (Fig. 5a and b), the D03 simulations are good
25
ACPD
14, 24915–24942, 2014Systematic UT cloud tilt
J. Gong et al.
Title Page
Abstract Introduction
Conclusions References
Tables Figures
◭ ◮
◭ ◮
Back Close
Full Screen / Esc
Printer-friendly Version Interactive Discussion
Discussion
P
a
per
|
Discus
sion
P
a
per
|
Discussion
P
a
per
|
Discussion
P
a
per
of enhancement in the Upper Troposphere, the systematic “upward diverging” cloud tilt structures occur at the north and south flanks of both centers separately (Fig. 5c). This feature again demonstrates that systematic cloud tilts in the UT always occur at the meridional peripheries of deep convective centers but not within the center. The “upward and inward” mid-level ice cloud mass tilt observed by CloudSat is validated
5
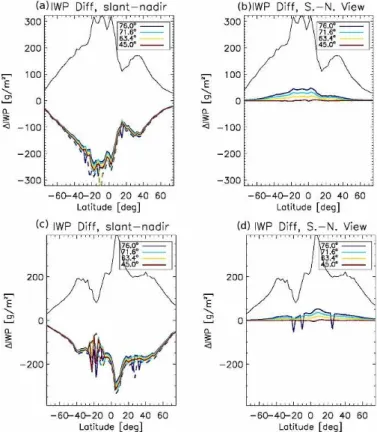
by the D03 simulation results (Fig. 5d). However, the discrepancy between DARDAR and CloudSat observations in the mid-level is still not explained. Also, the magnitude of∆IWP is 5–10 times smaller in D03 simulation than that observed by CloudSat. In-terestingly, if we integrate IWC from the freezing level at 5 km and upward along the vertical slant (“ground-based view”), which is opposite to the current “satellite view”, the
10
magnitude difference of ∆IWP between 45◦ and 77◦ view-angles is∼5–10 times, as shown in Fig. 7b. Therefore, the smaller∆IWP in D03 may be completely attributed to the different integration paths rather than the coarse model resolutions compared with CloudSat. On the contrary, simulation results from D02 do not reproduce the observed mean IWP distribution and the mass asymmetries (Fig. 5e and f). Hence, we can
con-15
clude that the shutdown of cumulus parameterization (thereby, allowing the model to resolve clouds) is the key to successful generation of the systematic cloud mass tilts. In other words, realistic representation of convective processes is fundamental in cap-turing the cloud inhomogeneity.
The separation height at 11 km is more or less arbitrary. For this consideration, Fig. 7
20
gives the column integrated IWP between 5 and 17 km from four pairs of view-angle vs. the nadir-view (left panels) and column-wised∆IWP (right panels). This time the integration path starts from 5 km and upward, which is equivalent to a ground-based view, and southward (northward) view means looking upward toward the south (north) direction, so the ground-based viewing geometry is opposite to the satellite-based one.
25
ACPD
14, 24915–24942, 2014Systematic UT cloud tilt
J. Gong et al.
Title Page
Abstract Introduction
Conclusions References
Tables Figures
◭ ◮
◭ ◮
Back Close
Full Screen / Esc
Printer-friendly Version Interactive Discussion
Discussion
P
a
per
|
Discus
sion
P
a
per
|
Discussion
P
a
per
|
Discussion
P
a
per
is present. Meanwhile, the ground-based southward-view nearly always presents more integrated ice cloud mass than the northward-view based on the CloudSat observation. The ground-based∆IWP consists of 10–15 % of the mean IWP from the nadir-view at 76◦, and the magnitude of ∆IWP decreases with the view-angle roughly following the cosine law. This result is not contradictory to our finding on the systematic cloud tilt,
5
since firstly the integration path here extends through the entire troposphere above the freezing level, and secondly the reference point is at the ground. Therefore, the physical meaning of∆IWP is completely different between these two methods. Figure 7b and d suggest an asymmetry of cloud mass vertical distribution. Though beyond the scope of this study, we suspect that ice cloud mass may indeed possess such a vertical
10
asymmetry that is part of the atmosphere-Earth angular momentum balance. Another possibility, which is more likely to happen, is that the “bottom round-up” effect near the freezing level of CloudSat IWC retrieval may significantly skew the overall ice cloud mass distribution.
4 Formation mechanism and importance of systematic UT cloud tilt 15
CloudSat, DARDAR observations and WRF “cloud-resolving” simulations all suggest that systematic UT cloud mass tilts tend to occur at the northern and southern periph-eries of tropical deep convective regions. The corresponding cloudy-sky meridional wind climatology indicates that the observed/simulated systematic cloud tilt is likely associated with local large-scale divergent wind, which is a part of the Hadley Cell
cir-20
culation. However, this explanation does not hold at the Asian monsoon region; neither at the summer central United States or Southern Europe, the latitudes of which be-yond the reach of the rising branch of the Hadley Cell. More importantly, the largest systematic asymmetries do not occur near the most active convective centers where wind divergence is the largest. Moreover, the upward slopping of UT cloud cannot
25
char-ACPD
14, 24915–24942, 2014Systematic UT cloud tilt
J. Gong et al.
Title Page
Abstract Introduction
Conclusions References
Tables Figures
◭ ◮
◭ ◮
Back Close
Full Screen / Esc
Printer-friendly Version Interactive Discussion
Discussion
P
a
per
|
Discus
sion
P
a
per
|
Discussion
P
a
per
|
Discussion
P
a
per
acteristics of UT clouds, including anvils and cirrus, are not simply controlled by the large-scale general circulation. The local in-cloud circulation must be critical.
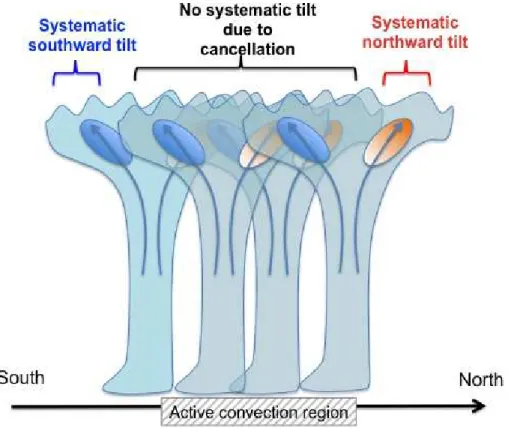
We propose that the climatological adding and cancelling effect as the major cause of the observed cloud tilt pattern. As depicted by the conceptual diagram in Fig. 6, each in-dividual convective cloud or cloud system would form such an “upward diverging” cloud
5
structures at the upper-level due to mass and momentum continuity. Within the active convection centers such as the ITCZ belt, a myriad of single convection/convective systems would lead to a large cancellation of the tilt effect, and only at the northern-most and southern-northern-most flanks can we identify such a net adding effect of systematic cloud inclination. It is remarkable that the adding effect dominates over the cancelling
10
effect across such a wide latitude range (5–10◦). This hypothesis may also explain the features occur in the mid-latitude convective centers during summer seasons. The mid-level “upward and inward” tilt, if true, may be also attributed to this adding and can-celling effect. Further analysis of wind-cloud tilt relationship is required to confirm this hypothesis. Unfortunately, due to the lack and difficulty of in-cloud wind measurements,
15
we cannot test this hypothesis in this paper. It is also of great interest to study details of the “in-cloud wind vs. tilt angle” relationship that is possibly affected by other factors (e.g., CAPE, vertical velocity, different stage of cloud development, etc.).
Clearly, neglecting systematic cloud tilt in satellite retrieval can result in additional biases especially for limb sensors (e.g., Microwave Limb Sounder), nadir sensors at
20
slantwise view-angles (e.g., AIRS, MODIS), and conical sensors (e.g., Clouds and the Earth’s Radiant Energy System). For example, Gong and Wu (2011, 2013a) acknowl-edged the impact on AIRS cloudiness in the zonal direction, where they concluded that up to half of AIRS view-angle asymmetry could be attributed to the systematic westward tilted cloud structures in the UT. Aura Microwave Limb Sounder (MLS) day
25
(night) forward-looking view is analogous to CloudSat northward (southward) looking view with a shallower viewing angle (∼86◦). Therefore, the cloud ∆TB between MLS
ACPD
14, 24915–24942, 2014Systematic UT cloud tilt
J. Gong et al.
Title Page
Abstract Introduction
Conclusions References
Tables Figures
◭ ◮
◭ ◮
Back Close
Full Screen / Esc
Printer-friendly Version Interactive Discussion
Discussion
P
a
per
|
Discus
sion
P
a
per
|
Discussion
P
a
per
|
Discussion
P
a
per
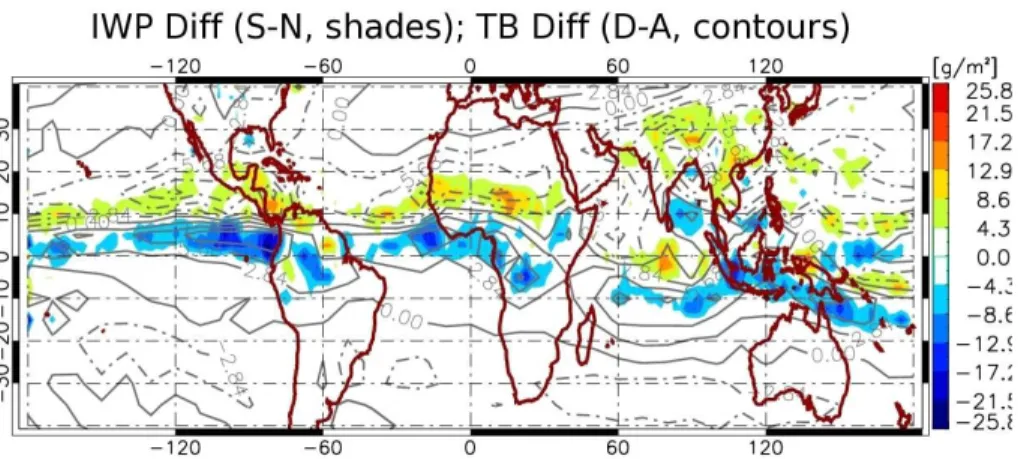
well. Strikingly, the night and day radiance difference (∆TB) from MLS forward scan at
640 GHz (peaking at∼12 km) has a high degree of agreement with the IWP difference derived from CloudSat observation in terms of geographic locations and magnitudes, as shown in Fig. 8. The highly consistent pattern strongly suggests that systematic cloud tilt contributes to a significant part of MLS ∆TB signal. Based on our current 5
study, the slantwise ice cloud mass orientation would result in 5–20 % errors in IWP or IWC retrievals using an off-nadir scan angle. The errors would be systematic at the north and south flanks of the tropical deep convective centers with a latitude width of 5–20◦. Same order of magnitude of uncertainty would also be present inside the active convective centers when performing individual cloud profile retrieval, despite that the
10
climatological impact is probably trivial due to the cancellation effect from large sam-pling. One should hence always be cautious of interpreting the ascending-descending difference purely as cloud diurnal variations, or “over-correcting” all angle-dependent cloud asymmetries as observational biases/artifacts.
The “against-tropopause shape” and “against-mean meridional wind” cloud mass tilt
15
has strong implications on the dynamical impact of cloud associated momentum and energy transport. We found from this study that structural characteristics anvils and cirrus tended to be determined by in-cloud circulation rather than the prevailing general mean flow. Moreover, the UT ice cloud mass tilt seems not to be controlled by the low-level wind shear, because it remains the same between CloudSat ascending and
20
descending orbits when the mid-latitude summer convections are at different stages (Weisman and Rotunno, 2004). Are cloud induced momentum and energy fluxes at the tropopause level particularly strong over the regions where the systematic cloud mass tilt is the most apparent? Cloud-resolving scale of modeling studies (beyond what has been done here initially) are required to answer such kind of questions.
25
ACPD
14, 24915–24942, 2014Systematic UT cloud tilt
J. Gong et al.
Title Page
Abstract Introduction
Conclusions References
Tables Figures
◭ ◮
◭ ◮
Back Close
Full Screen / Esc
Printer-friendly Version Interactive Discussion
Discussion
P
a
per
|
Discus
sion
P
a
per
|
Discussion
P
a
per
|
Discussion
P
a
per
(e.g., CERES) in the calculation of SW CRE, but the LW CRE calculation has not taken the cloud vertical asymmetry so far into consideration (Loeb et al., 2005, 2007). Al-though thick cloud is opaque at IR band, thin clouds like cirrus are not. IWP difference from observing a slantwise tilted cirrus at off-nadir views is expected to be positively correlated with TB difference at IR channels, causing an angle-dependent LW CRE
es-5
timation. Wu and Liang (2005) claimed that LW CRE was different by 8–16 % between realistic vertical overlapping (i.e., vertical geometry) and the “maximum-random” as-sumption using a month long cloud resolving simulation, which was on the same order of SW CRE uncertainty and in the same range of our estimation. Discrepancies among active and passive satellite sensors on the derived LW CRE may be partly attributed to
10
the tilted cloud structures as well (Li et al., 2011). Cloud tilts also affect the precipita-tion/rain pattern. For example, Wu and Liang (2005) found that the estimates of surface rainfall were greatly improved when they switched the cloud-overlapping scheme from a standard option to a physical-based one.
5 Conclusions 15
By integrating and differencing CloudSat/DARDAR ice water content (IWC) along a pair of symmetric slant views, we find that tropical Upper Troposphere (UT, 11–17 km) ice cloud mass is ubiquitously tilted. The most prominent tilts occur in the north and south flanks of tropical deep convective centers such as the Asian monsoon region and the Inter-Tropical Convergence Zones (ITCZs). The UT clouds in the tropics generally
pro-20
duce poleward-tilt ice columns, rendering significant view-angle dependent cloud ice differences. The slant-view IWPs can differ by 5–20 % from opposite scan angles, de-pending on what view angle is used. Cloud-resolving scale WRF model simulations over the western Central America ITCZ showed good agreement with the CloudSat-observed cloud tilt structures at 11–17 km heights. Moreover, both CloudSat and WRF
25
ACPD
14, 24915–24942, 2014Systematic UT cloud tilt
J. Gong et al.
Title Page
Abstract Introduction
Conclusions References
Tables Figures
◭ ◮
◭ ◮
Back Close
Full Screen / Esc
Printer-friendly Version Interactive Discussion
Discussion
P
a
per
|
Discus
sion
P
a
per
|
Discussion
P
a
per
|
Discussion
P
a
per
deep convection as a result of mass conservation. The constructively adding and can-celling effect of a large ensemble of tilted cloud ice mass, driven by in-cloud circulation, can explain the geographic distribution of systematic cloud mass tilt. However, due to lack of accurate in-cloud wind measurements, the proposed hypothesis has not been verified and remains to be tested in the future study.
5
This study for the first time presents a global characterization of cloud tilt structures in the middle and Upper Troposphere. The observed IWP differences in the paired slant-views have important implications for remote sensing and modeling of global cloud systems, including satellite retrieval of cloud properties, atmospheric momentum and energy budget, CRE calculation, and modulation of the hydrological cycle. The study
10
raises more questions than answers, notably the wind-tilt angle relationship, and poten-tial impacts on energy, momentum and hydrological cycles. More importantly, as GCMs continue to improve their resolution (e.g., NICAM, Satoh et al., 2008), vertically tilt cloud structures will become explicitly resolved. The modeled cloud 3-D inhomogeneity will need and subject to verification or scrutiny against the observations as shown in this
15
study.
Acknowledgements. This work is performed at the NASA Goddard Space Flight Center with support from the NASA NNH10ZDA001N-ESDRERR (Earth System Data Records Uncertainty Analysis) project. V. L. was supported by the National Science Foundation (NSF) under grants AGS-1116123 and AGS-MRI-0958616 and the Coastal Carolina University Kerns Palmetto
Pro-20
ACPD
14, 24915–24942, 2014Systematic UT cloud tilt
J. Gong et al.
Title Page
Abstract Introduction
Conclusions References
Tables Figures
◭ ◮
◭ ◮
Back Close
Full Screen / Esc
Printer-friendly Version Interactive Discussion
Discussion
P
a
per
|
Discus
sion
P
a
per
|
Discussion
P
a
per
|
Discussion
P
a
per
References
Cahalan, R. F., Ridgway, W., Wiscombe, W. J., Bell, T. L., and Snider, J. B.: The Albedo of fractal stratocumulus clouds, J. Atmos. Sci., 51, 2434–2455, 1994. 24917
Corti, T., Luo, B. P., Fu, Q., Vömel, H., and Peter, T.: The impact of cirrus clouds on tropical troposphere-to-stratosphere transport, Atmos. Chem. Phys., 6, 2539–2547,
5
doi:10.5194/acp-6-2539-2006, 2006. 24929
Delanoe, J. and Hogan, R. J.: Combined CloudSat-CALIPSO-MODIS retrievals of the proper-ties of ice clouds, J. Geophys. Res., 115, D00H29, doi:10.1029/2009JD012346, 2010. 24919 Delanoe, J., Protat, A., Jourdan, O., Pelon, J., Papazzoni, M., Dupuy, R., Gayet, J.-F., and Jouan, C.: Comparison of airborne in-situ, airborne radar-lidar, and spaceborne radar-lidar
10
retrievals of polar ice cloud properties sampled during the POLARCAT Campaign, J. Atmos. Ocean. Tech., 30, 57–73, doi:10.1175/JTECH-D-11-00200.1, 2013. 24919
Eliasson, S., Holl, G., Buehler, S. A., Kuhn, T., Stengel, M., Iturbide-Sanchez, F., and John-ston, M.: Systematic and random errors between collocated satellite ice water path observa-tions, J. Geophys. Res., 118, 1–14, 2013. 24919
15
Fu, Q., Carlin, B., and Mace, G.: Cirrus horizontal inhomogeneity and OLR bias, Geophys. Res. Lett., 27, 3341–3344, 2000. 24917
Gong, J. and Wu, D. L.: View-angle dependent AIRS cloud radiances: implications for tropical anvil structures, Geophys. Res. Lett., 38, L14802, doi:10.1029/2011GL047910, 2011. Gong, J. and Wu, D. L.: View-angle dependence of AIRS cloudiness and radiance variance:
20
analysis and interpretation, J. Geophys. Res., 118, 2327–2339, doi:10.1002/jgrd.50120, 2013. 24917
Gong, J. and Wu, D. L.: CloudSat-constrained cloud ice water path and cloud top height retrievals from MHS 157 and 183.3 GHz radiances, Atmos. Meas. Tech., 7, 1873–1890, doi:10.5194/amt-7-1873-2014, 2014.
25
Hong, G., Heygster, G., Miao, J., and Kunzi, K.: Potential to estimate the canting angle of tilted structures in clouds from microwave radiances around 183 GHz, IEEE Geosci. and Remote Sensing Lett., 2, 40–44, 2005. 24917
Huang, D., Zhao, C., Dunn, M., Dong, X., Mace, G. G., Jensen, M. P., Xie, S., and Liu, Y.: An intercomparison of radar-based liquid cloud microphysics retrievals and implications for
30
ACPD
14, 24915–24942, 2014Systematic UT cloud tilt
J. Gong et al.
Title Page
Abstract Introduction
Conclusions References
Tables Figures
◭ ◮
◭ ◮
Back Close
Full Screen / Esc
Printer-friendly Version Interactive Discussion
Discussion
P
a
per
|
Discus
sion
P
a
per
|
Discussion
P
a
per
|
Discussion
P
a
per
Li, J. and Barker, H. W.: Accounting for unresolved clouds in a 1-D infrared radiative transfer model, Part I: Solution for radiative transfer, including cloud scattering and overlap, J. Atmos. Sci., 59, 3302–3320, 2002. 24917
Li, J. M., Yi, Y. H., Minnis, P., Huang, J. P., Yan, H. R., Ma, Y. J., Wang, W. C., and Ay-ers, J. K.: Radiative effect differences between multi-layered and single-layer clouds derived
5
from CERES, CALIPSO, and CloudSat data, J. Quant. Spectrosc. Ra., 112, 361–375, 2011. 24930
Liang, X.-Z. and Wu, X.: Evaluation of a GCM subgrid cloud-radiation interaction param-eterization using cloud-resolving model simulations, Geophys. Res. Lett., 32, L06801, doi:10.1029/2004GL022301, 2005.
10
Loeb, N. G., Kato, S., Loukachine, K., and Manalo-Smith, N.: Angular distribution models for top-of-atmosphere radiative flux estimation from the clouds and the earth’s radiant energy system instrument on the Terra satellite. Part I: Methodology, J. Atmos. Ocean. Tech., 22, 338–351, 2005. 24930
Loeb, N. G., Kato, S., Loukachine, K., Manalo-Smith, N., and Doelling, D. R.: Angular
distribu-15
tion models for top-of-atmosphere radiative flux estimation from the Clouds and the Earth’s Radiant Energy System instrument on the Terra satellite. Part II: Validation, J. Atmos. Ocean. Techn., 24, 564–584, 2007. 24930
Ming, M. and Zhang, Z.: On the influence of cloud fraction diurnal cycle and sub-grid cloud optical thickness variability on all-sky direct aerosol radiative forcing, J. Quant. Spectrosc.
20
Ra., 142, 25–36, doi:10.1016/j.jqsrt.2014.03.014, 2014. 24917
Morrison, H., Thompson, G., and Tatarskii, V.: Impact of Cloud Microphysics on the Develop-ment of Trailing Stratiform Precipitation in a Simulated Squall Line: Comparison of One- and Two-Moment Schemes, Mon. Weather Rev., 137, 991–1007, doi:10.1175/2008MWR2556.1, 2009. 24925
25
Naud, C. M., Del Genio, A. D., Bauer, M., and Kovari, W.: Cloud vertical distributions across warm and cold fronts in CloudSat-CALIPSO data and a general circulation model, J. Climate, 23, 3397–3415, 2010. 24917
Oreopoulos, L., Lee, D., Sud, Y. C., and Suarez, M. J.: Radiative impacts of cloud heterogeneity and overlap in an atmospheric General Circulation Model, Atmos. Chem. Phys., 12, 9097–
30
9111, doi:10.5194/acp-12-9097-2012, 2012. 24917
ground-ACPD
14, 24915–24942, 2014Systematic UT cloud tilt
J. Gong et al.
Title Page
Abstract Introduction
Conclusions References
Tables Figures
◭ ◮
◭ ◮
Back Close
Full Screen / Esc
Printer-friendly Version Interactive Discussion
Discussion
P
a
per
|
Discus
sion
P
a
per
|
Discussion
P
a
per
|
Discussion
P
a
per
based and airborne cloud radar observations, J. Atmos. Ocean. Tech., 26, 1717–1741, 2009. 24918, 24919
Satoh, M., Matsuno, T., Tomita, H., Miura, H., Nasuno, T., and Iga, S.: Nonhydrostatic icosa-hedral atmospheric model (NICAM) for global cloud resolving simulations, J. Comput. Phys., 227, 3486–3514, doi:10.1016/j.jcp.2007.02.006, 2008. 24931
5
Weisman, M. L. and Rotunno, R.: A theory for strong long-lived squall lines re- visted, J. Atmos. Sci., 61, 361–382, 2004. 24929
Wu, D. L. and Eckermann, S. D.: Global gravity wave variances from Aura MLS: characteristics and interpretation. J. Atmos. Sci., 65, 3695–3718, doi:10.1175/2008JAS2489.1, 2008. 24921 Wu, D. L., Austin, R. T., Deng, M., Durden, S. L., Heymsfield, A. J., Jiang, J. H., Lambert, A.,
10
Li, J.-L., Livesey, N. J., McFarquhar, G. M., Pittman, J. V., Stephens, G. L., Tanelli, S., Vane, D. G., and Waliser, D. E.: Comparisons of global cloud ice from MLS, CloudSat, and other correlative data sets, J. Geophys. Res., 114, D00A24, doi:10.1029/2008JD009946, 2009. 24918
Wu, X. Q., and Liang, X.-Z.: Radiative effects of cloud horizontal inhomogeneity and vertical
15
overlap identified from a month-long Cloud-Resolving Model simulation, J. Atmos. Sci., 62, 4105–4112, 2005. 24930
ACPD
14, 24915–24942, 2014Systematic UT cloud tilt
J. Gong et al.
Title Page
Abstract Introduction
Conclusions References
Tables Figures
◭ ◮
◭ ◮
Back Close
Full Screen / Esc
Printer-friendly Version Interactive Discussion
Discussion
P
a
per
|
Discus
sion
P
a
per
|
Discussion
P
a
per
|
Discussion
P
a
per
Figure 2.IWC curtains (color shades) from DARDAR-Cloud v2.1.1 retrieval products for the two cases shown in Fig. 1. Color scale is linear, and is ranged between the maximum DARDAR IWC value within the curtain (red) and 0 (white). One can only find subtle differences in the IWC and
ACPD
14, 24915–24942, 2014Systematic UT cloud tilt
J. Gong et al.
Title Page
Abstract Introduction
Conclusions References
Tables Figures
◭ ◮
◭ ◮
Back Close
Full Screen / Esc
Printer-friendly Version Interactive Discussion
Discussion
P
a
per
|
Discus
sion
P
a
per
|
Discussion
P
a
per
|
Discussion
P
a
per
Figure 3.∆IWP (color shades; unit is g m−2) between the south-view and the north-view with view-angle of 77◦for December-January-February(a)and June-July-August(b)averaged dur-ing 2007–2010 between 11 and 17 km. Results are based on CloudSat IWC dataset within
ACPD
14, 24915–24942, 2014Systematic UT cloud tilt
J. Gong et al.
Title Page
Abstract Introduction
Conclusions References
Tables Figures
◭ ◮
◭ ◮
Back Close
Full Screen / Esc
Printer-friendly Version Interactive Discussion
Discussion
P
a
per
|
Discus
sion
P
a
per
|
Discussion
P
a
per
|
Discussion
P
a
per