ACPD
1, 221–238, 2001Tropical cirrus and water vapor
Q. Fu et al.
Title Page
Abstract Introduction
Conclusions References
Tables Figures
◭ ◮
◭ ◮
Back Close
Print Version
Interactive Discussion
c
EGS 2001
Atmos. Chem. Phys. Discuss., 1, 221–238, 2001 www.atmos-chem-phys.org/acpd/1/221/
c
European Geophysical Society 2001
Atmospheric Chemistry and Physics Discussions
Tropical cirrus and water vapor: an
effective Earth infrared iris feedback?
Q. Fu1, M. Baker1, and D. L. Hartmann1
1Department of Atmospheric Sciences, Box 351640, University of Washington, Seattle,
Washington 98195, USA
ACPD
1, 221–238, 2001Tropical cirrus and water vapor
Q. Fu et al.
Title Page
Abstract Introduction
Conclusions References
Tables Figures
◭ ◮
◭ ◮
Back Close
Print Version
Interactive Discussion
c
EGS 2001
Abstract
We revisit a model of feedback processes proposed by Lindzen et al. (2001), in which an assumed 22% reduction in the area of tropical high clouds per degree of sea surface temperature increase produces negative feedbacks associated with upper tropospheric water vapor and cloud radiative effects. We argue that the water vapor feedback is
5
overestimated in Lindzen et al. (2001) by at least 60%, and that the high cloud feedback should be small. Although not mentioned by Lindzen et al, tropical low clouds make a significant contribution to their negative feedback, which is also overestimated. Using more realistic parameters in the model of Lindzen et al., we obtain a feedback factor in the range of −0.15 to −0.51, compared to their larger negative feedback factor of
10
−0.45 to−1.03.
1. Introduction
Motivated by the observational evidence that in the Tropics the boundary between re-gions of high and low free-tropospheric relative humidity is sharp, and that areas of high free-tropospheric relative humidity tend to be localized near upper-level cirrus, Lindzen
15
et al. (2001) (hereafter LCH) analyzed cloud data for the eastern part of the western Pacific from the Japanese GMS-5. They concluded that the area of upper-level cloud coverage normalized by the area of cumulus coverage decreases about 22% per de-gree Celsius increase in the sea surface temperature (SST) of the cloudy region. They interpreted this as the effects of ocean surface temperature on cirrus detrainment from
20
cumulus convection. This observational result, while open to question (Hartmann and Michelsen, 2001), is not the focus of the present paper. Instead, we will explore the cli-matic implications of the decrease of high cloud area with increasing SST by employing the same model framework as in LCH.
LCH suggested that decreasing areas of upper-level cloud and moisture with
in-25
ACPD
1, 221–238, 2001Tropical cirrus and water vapor
Q. Fu et al.
Title Page
Abstract Introduction
Conclusions References
Tables Figures
◭ ◮
◭ ◮
Back Close
Print Version
Interactive Discussion
c
EGS 2001
thus a negative feedback in the climate system. Such a feedback was referred to as an adaptive infrared iris. LCH examined the iris feedback using a two-dimensional radiative-convective model. Their calculations showed that changes of the relative ar-eas of tropical moist and dry air in response to changes in SST could lead to a feedback factor of about−1.03. Such a large negative feedback would more than cancel all the
5
positive feedbacks in the more sensitive current climate models. According to their calculations, even if regions of high humidity were not coupled to cloudiness, the feed-back factor due to clouds alone would still amount to about−0.45, which would cancel model water vapor feedback in almost all climate models.
In the iris effect suggested by LCH, the cloud and water vapor feedbacks are
inextri-10
cably tied to each other. Based on the calculations by LCH, the feedback factor due to water vapor is negative and lies between 0 and−0.58 depending on how closely the moist area follows the cirrus cloud area. The feedback factor due to clouds is−0.45. The strong negative feedbacks that result from the assumed negative correlation be-tween SST and high cloud area are based on two major arguments in LCH. First, the
15
effect of tropical high clouds on the OLR is much larger than their effect on reflected so-lar radiation. Second, the greenhouse effect of water vapor in the tropical moist regions is much greater than that in tropical dry regions.
It should be noted that the strong negative feedback presented in LCH is not only due to water vapor and high clouds, but also due to low clouds, which was not
acknowl-20
edged in LCH. LCH assume that low clouds are everywhere in tropics with a constant cloud cover, a high cloud albedo, and thus a strongly negative cloud radiative forc-ing. Therefore, a decrease in cirrus cloud cover would increase the area with strong negative cloud forcing, which would always produce a cooling (negative feedback).
In this paper, we will examine the major arguments used in LCH to derive the
neg-25
ACPD
1, 221–238, 2001Tropical cirrus and water vapor
Q. Fu et al.
Title Page
Abstract Introduction
Conclusions References
Tables Figures
◭ ◮
◭ ◮
Back Close
Print Version
Interactive Discussion
c
EGS 2001
feedback due to cloud changes is related as much to the low clouds as to the high clouds, a fact not mentioned by LCH. Observations suggest that the net radiative effect of high clouds is near zero and the net radiative effect of low clouds is smaller than as-sumed by LCH. These two changes give a much reduced magnitude for the negative feedback associated with the radiative effect of clouds. Assuming a 22% decrease in
5
high cloud coverage per degree of SST increase, and using the model framework of LCH, we obtain a feedback factor of−0.15 to−0.51, compared to the range of−0.45 to−1.03 obtained by LCH.
2. The feedback factor and LCH’s 3.5-box model
Following LCH, the net response,∆T, of the climate system to an external forcing,∆Q,
10
can be expressed in the equation
∆T =G0(∆Q+F∆T) (1)
whereG0 is the no-feedback gain of the climate system and F is the additional forcing
per degree increase in the net response due to the feedback process. Solving for∆T, we have
15
∆T =G0∆Q/(1−G0F) = ∆T0/(1−f) (2)
where∆T0 ≡ G0∆Q is the response of the climate system to the forcing in the
ab-sence of feedbacks and f ≡ G0F is referred to as the feedback factor. In the iris
mechanism, F is the product of two parts. The first part is the reduction of the high cloud fraction per degree Kelvin of SST,∆A/∆Ts, which is assumed to be 22%. The
20
ACPD
1, 221–238, 2001Tropical cirrus and water vapor
Q. Fu et al.
Title Page
Abstract Introduction
Conclusions References
Tables Figures
◭ ◮
◭ ◮
Back Close
Print Version
Interactive Discussion
c
EGS 2001
LCH constructed a 3.5-box model with radiative-convective equilibrium to calculate
G0 and ∆Rnet/∆A . In this model, the world is divided into three regions: the moist Tropics (25%), the dry Tropics (25%), and the extratropics (50%). The SSTs for the tropical and extratropical regions are assumed to be 10 degrees higher and lower, respectively, than the global mean SST that has a current value of 288 K. The moist
5
region of the Tropics is further divided into a cloudy-moist region (11%) covered by upper level cirrus, and a clear-moist region (14%) clear of such cirrus. The low cloud cover is assumed to be 25% everywhere in the Tropics; that is, 25% of the surface in the Tropics is covered by low clouds. The reflectivities of tropical high and low clouds are assumed to be 0.24 and 0.42, respectively. The tropical clear sky reflectivity is 0.13.
10
The emission temperatures used are the tropical SST minus 27.6 K, 37 K, and 76 K for the tropical dry, clear-moist, and cloudy-moist regions, respectively. These choices give OLRs of 303 W m−2, 263 W m−2 , and 138 W m−2, respectively. The complete
list of choices of parameters for the 3.5-box model are given in Table 1 of LCH. They are consistent with the Earth Radiation Budget Experiment (ERBE) observations of
15
the reflectivities and emission temperatures averaged for the tropical and extratropical regions and the globe.
To evaluate the magnitude of the iris feedback, LCH varied the areas of the tropi-cal regions, decreasing the tropitropi-cal cloudy- and clear-moist regions and increasing the tropical dry region accordingly. Here it is instructive to evaluate the relative
contribu-20
tions of water vapor, low clouds, and high clouds to the top of the atmosphere (TOA) radiative energy budget change in response to changes of high cloud area. Consider a decrease of high cloud cover by 20% as an example and assume that the tropi-cal moist region follows the area of cloudy moist air with the same relative decrease. Based on the 3.5 box model with the parameters in LCH, the changes of the radiative
25
energy budget at the TOA are−2 W m−2due to water vapor,−0.84 W m−2due to high
clouds, and−0.7 W m−2
ACPD
1, 221–238, 2001Tropical cirrus and water vapor
Q. Fu et al.
Title Page
Abstract Introduction
Conclusions References
Tables Figures
◭ ◮
◭ ◮
Back Close
Print Version
Interactive Discussion
c
EGS 2001
−1.03 derived by using the relation between the high cloud cover and SST from LCH. Note that the water vapor effect corresponding to the change of moist area can be from 0 to−2 W m−2, depending on how closely the area of the moist region follows the area
of cloudy moist air. Therefore, the feedback factor in LCH ranges from about−0.45 to
−1.03.
5
Since choices of all parameters used in the 3.5-box model in LCH are not com-pletely constrained by observations, in what follows we will examine the dependence of∆Rnet/∆Aon the choices of model parameters. In particular, we will use additional information derived from modeling and observations to further constrain the contrast in OLR between dry and moist regions and the net radiative effects of high and low
10
clouds.
3. Radiative effects of tropical water vapor in the iris feedback
The response of the climate system to changing the area of the clear-moist region is proportional to the difference in the OLR between the tropical dry and clear-moist re-gions. The OLRs used in LCH for these two regions are 303 and 263 W m−2, which
15
result in a difference of 40 W m−2. The OLR for the cloudy-moist region is set to 138
W m−2
to match the ERBE full sky OLR for the Tropics. In order to examine the OLR in the tropical regions, we use a radiation model developed by Fu and Liou (1993). In this model, the radiative transfer scheme used is the delta-four-stream approximation. Gaseous absorption due to H2O, CO2, O3, CH4, and N2O is incorporated into the
scat-20
tering model by employing the correlated k-distribution method (Fu and Liou, 1992). The H2O continuum absorption is included by using CKD2.2 (Charlock et al., 1999).
We use the tropical standard temperature profile (McClatchey et al., 1971) with mod-ification to be consistent with the sea surface temperature of 298 K. The relative hu-midity for the moist region is assumed to be 70% from the surface to 14 km, which is
25
ACPD
1, 221–238, 2001Tropical cirrus and water vapor
Q. Fu et al.
Title Page
Abstract Introduction
Conclusions References
Tables Figures
◭ ◮
◭ ◮
Back Close
Print Version
Interactive Discussion
c
EGS 2001
decreasing linearly from 30% to 5% from 1.5 to 14 km (Larson et al., 1999; Manabe and Wetherald, 1967). Above 14 km, the tropical standard water vapor profile is used. Figure 1 shows our assumed temperature and relative humidity profiles below 14 km.
The OLRs from the radiation model are 293 W m−2 and 268 W m−2, respectively,
for the tropical dry and clear-moist regions. To match the ERBE full sky OLR for the
5
Tropics, we require an OLR of 154 W m−2
for the cloudy-moist region. The OLR differ-ence between the dry and clear-moist regions is then 25 W m−2, which is 15 W m−2
lower than that derived from LCH. Our sensitivity study shows that in order to produce the OLR of 303 W m−2
for the clear-dry region as used in LCH, the free-tropospheric relative humidity must be less than∼10%. For their OLR of 263 W m−2in the tropical
10
moist region the relative humidity must be as high as 80%.
The OLR differences between moist and dry regions are also examined using the ECMWF water vapor data. The mean relative humidity profiles over tropical ocean are obtained for different regions that are defined based on their monthly precipitation (Bretherton, private communication, 2001). Here an interval of 1 mm day−1
from 0 to
15
16 mm day−1 is considered. Using the relative humidity profile for the areas with the
monthly precipitation smaller (larger) than 1 mm day−1 (15 mm day−1), corresponding
to the extreme dry (moist) region, we derive an OLR difference of 23 W m−2
, which is 2 W m−2 smaller than the value given by our calculation. Thus the OLR difference
between moist and dry regions used in the 3.5-box model should not be larger than
20
∼25 W m−2
.
ERBE observations suggest a clear-sky OLR difference of about 20 W m−2 between
moist and dry regions (e.g. Harrison et al., 1990). For example, for the Western Pa-cific convective region (0–15 N, 120–150 E) and the Central PaPa-cific “dry zone” (0–15 S, 130–150 W), we have clear-sky OLRs of 280 W m−2 and 301 W m−2, respectively
25
(Hartmann et al., 2001). Note that the SSTs are∼302 K for the convective region and
re-ACPD
1, 221–238, 2001Tropical cirrus and water vapor
Q. Fu et al.
Title Page
Abstract Introduction
Conclusions References
Tables Figures
◭ ◮
◭ ◮
Back Close
Print Version
Interactive Discussion
c
EGS 2001
gion. The conversion here is based on radiation model simulations by assuming that the relative humidity profiles do not change with the changes of the temperature pro-files. Therefore, the OLR difference due to water vapor between moist and dry regions based on ERBE observations is also smaller than 25 W m−2. Here we argue that the
effect of water vapor on the area feedback is overestimated in LCH by at least 60%.
5
4. Radiative effects of tropical clouds in the iris feedback
LCH used the values of a tropical reflectivity of 0.24 and a tropical clear sky reflectivity of 0.13 based on ERBE observations to constrain their model parameters related to solar radiation in the Tropics. Their choices, however, are not the only ones consis-tent with the ERBE data. Figure 2 shows rl, the reflectivity of tropical low clouds, as
10
a function of rh, the reflectivity of high tropical clouds, required to match the ERBE tropical reflectivity. Other parameters in the calculations follow LCH. We can see that
rl decreases asrh increases in order to maintain the mean reflectivity for the Tropics. Figure 2 indicates that consistency with ERBE reflectivities is possible for a wide range ofrhandrl. The symbol “x” represents the choice of tropical cloud reflecitvities used in
15
LCH. The cloud radiative effect on the proposed area feedback is very sensitive to the cloud reflectivities chosen in the model. Note that the relation betweenrlandrhshown in Fig. 2 does not depend on the emission temperatures. The question that arises now is, what are therhandrlwe should use? It is clear that more observational information is needed to choose appropriate reflectivities for the 3.5-box model.
20
Cloud radiative forcing at the TOA is a useful quantity for understanding the role of clouds in the climate system. The cloud radiative forcing is defined as the difference in the net radiative fluxes at the TOA between cloudy-sky and clear-sky conditions. (The net radiation here is the difference between absorbed solar radiation and outgoing longwave radiation at the TOA.) Cloud radiative forcing gives a measure of the effect
25
ACPD
1, 221–238, 2001Tropical cirrus and water vapor
Q. Fu et al.
Title Page
Abstract Introduction
Conclusions References
Tables Figures
◭ ◮
◭ ◮
Back Close
Print Version
Interactive Discussion
c
EGS 2001
region is +38 W m−2. The cloud radiative forcing for LCH’s tropical low clouds with a
cloud cover of 25% is−32 W m−2. The positive radiative forcing of high clouds and
negative forcing of low clouds assumed in LCH contribute powerfully to the negative feedback that they obtain. Note that the calculated radiative forcing of high clouds depends on the emission temperatures assumed for the tropical regions through the
5
longwave radiation. In the following, we will discuss the reflectivities of tropical high and low clouds by using the emission temperatures based on our new clear-sky OLRs. The symbol “o” in Fig. 2 represents the reflectivities when the cloud radiative forcing for the tropical high cloud region (i.e. cloudy moist region) is zero. Here the high cloud reflectivity is increased torh=0.342 and the low cloud reflectivity is reduced to
10
rl = 0.331. The cloud radiative forcing of the tropical cloudy moist region is positive (negative), whenrh is smaller (larger) than 0.342. Therefore the role of tropical high clouds in the area feedback can be either positive or negative, depending on the rh used. We can constrain the value ofrhby known limits on the cloud radiative forcing in high cloud regions.
15
Since the low cloud forcing is always negative, low clouds always produce negative feedback associated with a decrease of high cloud cover. But this negative feedback effect decreases as the rh increases, if we constrain the tropical mean reflectivity to match ERBE observations. We will discuss the low cloud effects more later.
4.1. Tropical high cloud effects
20
The shortwave effect of clouds cools the earth-atmosphere system by reflecting the solar radiation back to space, while their longwave effect warms the system by trapping the infrared radiation emitted from the warmer underlying atmosphere and surface. For tropical high clouds, their longwave effect can dominate their shortwave effect or vice versa, which would yield a positive and negative cloud radiative forcing, respectively.
25
ACPD
1, 221–238, 2001Tropical cirrus and water vapor
Q. Fu et al.
Title Page
Abstract Introduction
Conclusions References
Tables Figures
◭ ◮
◭ ◮
Back Close
Print Version
Interactive Discussion
c
EGS 2001
al. (1998). The temperature, water vapor, and ozone profiles are those of the tropical standard atmosphere (McClatchey et al., 1971). The mean effective size of ice particles in the cirrus is assumed to be 50µm (Fu, 1996) and the ocean surface albedo is 0.05. The solar radiation is set at equinox conditions at the equator.
Figure 3 indicates that the radiative forcing due to cirrus clouds can range from
pos-5
itive to negative, depending on the cloud optical depth and cloud top height. For given cloud top height, the cloud radiative forcing is usually positive for very small optical depths and increases with the optical depth. As the optical depth continues to increase, the forcing reaches a maximum and then decreases to zero and becomes negative for large optical depths. Figure 3 also shows that for given cloud optical depth, the cloud
10
forcing increases with the cloud top height.
Observations based on ERBE data indicate that longwave and shortwave cloud forc-ing for tropical convective clouds nearly cancel (Ramanathan et al., 1989; Kiehl and Ramanathan, 1990); i.e. the total cloud radiative forcing is near zero. By analyzing ERBE and ISCCP data in a large region from 10◦S to 10◦N and 140◦E to 90◦W, Kiehl
15
(1994) found that the longwave cloud forcing and shortwave cloud forcing are for the most part dependent on the high cloud amount. Kiehl (1994) explained the cancellation of the longwave and shortwave cloud forcing at the top of the atmosphere as a result of macro- and micro-physical properties of the prevalent anvil clouds.
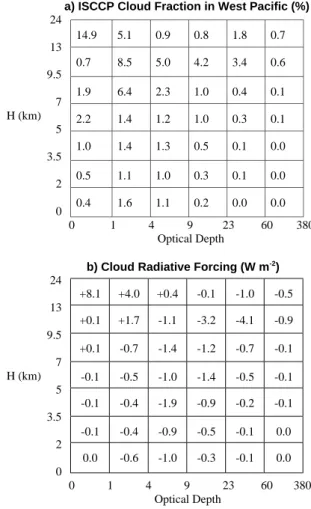
Recently, Hartmann et al. (2001) used ERBE and ISCCP data in conjunction with the
20
radiative transfer model (Fu et al., 1998) to estimate the effect of various cloud types on the TOA radiative budget in tropical convective region. The area considered is from 0–15◦N, 120–150◦E during July and August 1985 and 1986, which can be considered
a typical tropical moist region. Figure 4a shows cloud cover versus cloud top heights and visible optical depths for this region. The sum of numbers in the boxes for high
25
ACPD
1, 221–238, 2001Tropical cirrus and water vapor
Q. Fu et al.
Title Page
Abstract Introduction
Conclusions References
Tables Figures
◭ ◮
◭ ◮
Back Close
Print Version
Interactive Discussion
c
EGS 2001
input and−7 W m−2from ERBE. Note that although the overcast cloud forcing for each
individual cloud category can be strongly positive or negative (Fig. 3), the ensemble of cloud types that occurs in association with deep convection in the tropics arranges itself so that the individual positive and negative contributions cancel each other when averaged over the convective cloud system (Hartmann et al., 2001). From Fig. 4b, the
5
total cloud radiative forcing due to high clouds, which is sum of numbers in relevant boxes, is−0.6 W m−2
. Since the high cloud cover is 0.6, we infer that overcast cloud radiative forcing for the high cloud region is only−1 W m−2.
Therefore, we choose rh = 0.342 and rl = 0.331 for the 3.5-box model so that the cloud radiative forcing for the cloudy-moist region is zero, as observed. Since
10
the feedback due to the direct radiative effect of high clouds related to area changes is proportional to the cloud radiative forcing for the high cloud region, we can argue that the direct radiative effect of the tropical high clouds cannot constitute an effective “infrared iris”.
4.2. Tropical low cloud effects
15
Given constant low cloud cover, tropical low clouds produce a negative feedback re-lated to changing the relative area of the high cloud region. This feedback is propor-tional to the low cloud radiative forcing. Using arl of 0.331 with a cloud cover of 25%, and assuming no greenhouse effect of the low clouds, the cloud radiative forcing for the tropical low clouds based on the 3.5-box model becomes−24 W m−2
. Since this
20
is smaller than the low cloud radiative forcing of−32 W m−2 in LCH, we argue that the
negative feedback due to low clouds is also exaggerated in LCH.
Low cloud forcing in the trade cumulus regions adjacent to deep convection over the warm water may be even much smaller in magnitude than 24 W m−2, since ERBE
estimates suggest a value less than 10 W m−2 (Hartmann et al., 2001). The most
25
ACPD
1, 221–238, 2001Tropical cirrus and water vapor
Q. Fu et al.
Title Page
Abstract Introduction
Conclusions References
Tables Figures
◭ ◮
◭ ◮
Back Close
Print Version
Interactive Discussion
c
EGS 2001
cloud cover in the simple 3.5-box model.
5. Conclusions and Discussion
Using a simple 3.5-box radiative-convective model, LCH obtained a feedback factor be-tween−0.45 and−1.03 related to the changes of tropical high cloud area with changes of SST. This feedback factor can be attributed to the radiative effects of water vapor (0
5
to−0.58), high clouds (−0.25), and low clouds (−0.20). In this paper, we argue that the contribution of tropical high clouds to the feedback process would be small since the radiative forcing over the tropical high cloud region is near zero and not strongly positive as LCH assume. It is also shown that the water vapor and low cloud effects are overestimated by at least 60% and 33%, respectively, in LCH. Using the model of
10
LCH with our revised parameters we obtain a feedback factor ranging from−0.15 to
−0.51 rather than−0.45 to−1.03.
In this paper we have assumed that the result of 22% high cloud cover decrease for a 1◦C increase in SST from LCH is valid. However, Hartmann and Michelsen (2001)
pointed out that the negative correlation between cloud-weighted SST and average
15
high cloud fraction derived by LCH from observations within the domain considered by them is not really evidence that tropical cloud anvil area is inversely proportional to SST. Further research is needed to investigate the relation between high cloud cover and SST. It should be noted that for ANY rate of changes of cloudy- and clear-moist areas with changing SST, the feedback due to such a change will be significantly smaller than
20
that suggested by LCH.
One final note we would like to make here is about the tropical low clouds. In LCH, the low cloud cover is assumed to be constant, which results in a significant contribution to the negative feedback they find. ERBE estimates suggest a low cloud forcing in the trade cumulus regions adjacent to deep convection over the warm water (Hartmann et
25
ACPD
1, 221–238, 2001Tropical cirrus and water vapor
Q. Fu et al.
Title Page
Abstract Introduction
Conclusions References
Tables Figures
◭ ◮
◭ ◮
Back Close
Print Version
Interactive Discussion
c
EGS 2001
low cloud cover in the simple 3.5-box model. On the other hand, Bajuk and Leovy (1998) suggested a negative correlation between the ocean temperature and the low cloud amount, which might introduce a positive feedback in the climate system. Further research is also needed to examine the variation of tropical low cloud properties and its implication in climate sensitivity.
5
Acknowledgements. The research work contained herein has been supported by DOE Grant DE-FG03-00ER62931, NSF Grant ATM-9704156 and NASA Grant NAG5-6101. We gratefully acknowledge Profs. Chris Bretherton, Conway Leovy, and Mike Wallace for helpful discussions. We also thank Prof. Bretherton for providing the ECMWF water vapor data.
References
10
Bajuk, L. J. and Leovy, C. B., Seasonal and interannual variations in stratiform and convective clouds over the tropical Pacific and Indian oceans from ship observations. J. Climate, 11, 2922–2941, 1998.
Brown, R. G. and Zhang, C., Variability of midtropospheric moisture and its effect on cloud-top height distribution during TOGA COARE, J. Atmos. Sci., 54, 2760–2774, 1997.
15
Charlock, T. P., Rose, F. G., Alberta, T. L., Fu, Q., Hu, Y., Minnis, P., Morcrette, J. J., and Wong, T., Application of SGP data to CERES retrievals of shortwave and longwave fluxes, Proceedings of the 9th DOE ARM STM, 22–26 March, San Antonio, Texas, 1999.
Fu, Q. and Liou, K. N., On the correlated k-distribution method for radiative transfer in nonho-mogeneous atmosphere, J. Atmos. Sci., 49, 2139–2156, 1992.
20
Fu, Q. and Liou, K. N., Parameterization of the radiative properties of cirrus clouds, J. Atmos. Sci., 50, 2008–2025, 1993.
Fu, Q., An accurate parameterization of the solar radiative properties of cirrus clouds for climate models, J. Climate, 9, 2058–2082, 1996.
Fu, Q., Yang, P., and Sun, W. B., An accurate parameterization of the infrared radiative
proper-25
ties of cirrus clouds for climate models, J. Climate, 11, 2223–2237, 1998.
ACPD
1, 221–238, 2001Tropical cirrus and water vapor
Q. Fu et al.
Title Page
Abstract Introduction
Conclusions References
Tables Figures
◭ ◮
◭ ◮
Back Close
Print Version
Interactive Discussion
c
EGS 2001
Hartmann, D. L., Moy, L., and Fu, Q., Tropical convection and the energy balance at the top of the atmosphere, J. Climate, (accepted), 2001.
Hartmann, D. L. and Michelsen, M. L., No evidence for iris, Bull. Amer. Meteorol. Soc., (submit-ted), 2001.
Kiehl, J. T. and Ramanathan, V., Comparison of cloud forcing derived from the Earth Radiation
5
Budget Experiment with that simulated by the NCAR Community Climate Model, J. Geophys. Res., 95, 11679 -11698, 1990.
Kiehl, J. T., On the observed near cancellation between longwave and shortwave cloud forcing in tropical regions, J. Climate, 7, 559–565, 1994.
Larson, K. and Hartmann, D. L., The role of clouds, water vapor, circulation, and boundary layer
10
structure in the sensitivity of the tropical climate, J. Climate, 12, 2359–2374, 1999.
Lindzen, R. S., Chou, M. D., and Hou, A. Y., Does the Earth have an adaptive infrared iris? Bull. Amer. Meteorol. Soc., 82, 417–432, 2001.
Manabe, S. and Wetherald, R. T., Thermal equilibrium of the atmosphere with convective ad-justment, J. Atmos. Sci., 24, 241–259, 1967.
15
McClatchey, R. A., Fenn, W. S., Selby, J. E. A., Volz, F. E., and Garing, J. S., Optical properties of the atmosphere, Rep. AFCrl-71-0279, 85 pp., Air Force Cambridge Res. Lab., Bedford, Mass., 1971.
Ramanathan, V., Cess, R. D., Harrison, E. F., Minnis, P., Barkstrom, B. R., Ahmad, E., and Hart-mann, D. L., Cloud radiative forcing and climate: Results from the Earth Radiation Budget
20
ACPD
1, 221–238, 2001Tropical cirrus and water vapor
Q. Fu et al.
Title Page
Abstract Introduction
Conclusions References
Tables Figures
◭ ◮
◭ ◮
Back Close
Print Version
Interactive Discussion
c
EGS 2001
0 1 2 3 4 5 6 7 8 9 10 11 12 13 14
200 220 240 260 280 300
Height (km)
Temperature (K)
0 1 2 3 4 5 6 7 8 9 10 11 12 13 14
0 0.2 0.4 0.6 0.8 1
Height (km)
Relative Humidity
0 1 2 3 4 5 6 7 8 9 10 11 12 13 14
0 0.2 0.4 0.6 0.8 1
Height (km)
Relative Humidity Tropical
clear-moist region Tropical dry region
Fig. 1. Tropical atmospheric profiles used in clear-sky OLR simulations: (a) temperature; (b)
ACPD
1, 221–238, 2001Tropical cirrus and water vapor
Q. Fu et al.
Title Page
Abstract Introduction
Conclusions References
Tables Figures
◭ ◮
◭ ◮
Back Close
Print Version
Interactive Discussion
c
EGS 2001
X
0
0.1
0.2
0.3
0.4
0.5
0
0.1
0.2
0.3
0.4
0.5
0.6
Reflectivity of Tropical Low Clouds (r
l
)
Reflectivity of Tropical High Clouds (r
h)
0
0.1
0.2
0.3
0.4
0.5
0
0.1
0.2
0.3
0.4
0.5
0.6
Reflectivity of Tropical Low Clouds (r
l
)
Reflectivity of Tropical High Clouds (r
h)
O
0
0.1
0.2
0.3
0.4
0.5
0
0.1
0.2
0.3
0.4
0.5
0.6
Reflectivity of Tropical Low Clouds (r
l
)
Reflectivity of Tropical High Clouds (r
h)
Lindzen et al.Zero cloud radiative forcing over high cloud region
Curve when tropical albedo matches ERBE
Fig. 2. Reflectivity of tropical low clouds versus reflectivity of tropical high clouds, required to
ACPD
1, 221–238, 2001Tropical cirrus and water vapor
Q. Fu et al.
Title Page
Abstract Introduction
Conclusions References
Tables Figures
◭ ◮
◭ ◮
Back Close
Print Version
Interactive Discussion
c
EGS 2001
-200 -150
-100 -50
-50
0
0
50
15
5 7 9 11 13
Cloud Top Height (km)
Log10
τ
-1 0 1 2
Net Cloud Radiative Forcing
17
Fig. 3. Calculated daily-averaged cloud radiative forcing (W m−2) for overcast high clouds as
ACPD
1, 221–238, 2001Tropical cirrus and water vapor
Q. Fu et al.
Title Page
Abstract Introduction
Conclusions References
Tables Figures
◭ ◮
◭ ◮
Back Close
Print Version
Interactive Discussion
c
EGS 2001
a) ISCCP Cloud Fraction in West Pacific (%)
24
13
9.5
7 H (km)
5
3.5
2
0
0 1 4 9 23 60 380 Optical Depth
b) Cloud Radiative Forcing (W m-2
)
24
13
9.5
7 H (km)
5
3.5
2
0
0 1 4 9 23 60 380 Optical Depth
14.9 5.1 0.9 0.8 1.8 0.7
0.7 8.5 5.0 4.2 3.4 0.6
1.9 6.4 2.3 1.0 0.4 0.1
2.2 1.4 1.2 1.0 0.3 0.1
1.0 1.4 1.3 0.5 0.1 0.0
0.5 1.1 1.0 0.3 0.1 0.0
0.4 1.6 1.1 0.2 0.0 0.0
+8.1 +4.0 +0.4 -0.1 -1.0 -0.5
+0.1 +1.7 -1.1 -3.2 -4.1 -0.9
+0.1 -0.7 -1.4 -1.2 -0.7 -0.1
-0.1 -0.5 -1.0 -1.4 -0.5 -0.1
-0.1 -0.4 -1.9 -0.9 -0.2 -0.1
-0.1 -0.4 -0.9 -0.5 -0.1 0.0
0.0 -0.6 -1.0 -0.3 -0.1 0.0
Fig. 4. (a) ISCCP cloud cover versus cloud top height and visible optical depth and (b)