www.atmos-chem-phys.net/10/8077/2010/ doi:10.5194/acp-10-8077-2010
© Author(s) 2010. CC Attribution 3.0 License.
Chemistry
and Physics
Chemical composition of ambient aerosol, ice residues and cloud
droplet residues in mixed-phase clouds: single particle analysis
during the Cloud and Aerosol Characterization Experiment
(CLACE 6)
M. Kamphus1,*, M. Ettner-Mahl2,**, T. Klimach2, F. Drewnick2, L. Keller3, D. J. Cziczo3,***, S. Mertes4,
S. Borrmann1,2, and J. Curtius1,****
1Institute for Atmospheric Physics, Johannes Gutenberg University, Mainz, Germany 2Max Planck Institute for Chemistry, Mainz, Germany
3Institute for Atmospheric and Climate Science, ETH Zurich, Zurich, Switzerland 4Leibniz Institute for Tropospheric Research, Leipzig, Germany
*now at: Emerson Process Management GmbH & Co OHG, Hasselroth, Germany **now at: Boehringer Ingelheim Pharma GmbH & Co KG, Ingelheim am Rhein, Germany
***now at: Atmospheric Science & Global Change Division, Pacific Northwest National Laboratory, Richland, WA, USA ****now at: Institute for Atmospheric and Environmental Sciences, Goethe-University Frankfurt,
Frankfurt am Main, Germany
Received: 30 June 2009 – Published in Atmos. Chem. Phys. Discuss.: 17 July 2009 Revised: 30 July 2010 – Accepted: 12 August 2010 – Published: 30 August 2010
Abstract. Two different single particle mass
spectrome-ters were operated in parallel at the Swiss High Alpine Re-search Station Jungfraujoch (JFJ, 3580 m a.s.l.) during the Cloud and Aerosol Characterization Experiment (CLACE 6) in February and March 2007. During mixed phase cloud events ice crystals from 5–20 µm were separated from larger ice aggregates, non-activated, interstitial aerosol particles and supercooled droplets using an Ice-Counterflow Virtual Impactor (Ice-CVI). During one cloud period supercooled droplets were additionally sampled and analyzed by chang-ing the Ice-CVI setup. The small ice particles and droplets were evaporated by injection into dry air inside the Ice-CVI. The resulting ice and droplet residues (IR and DR) were analyzed for size and composition by the two single particle mass spectrometers: a custom-built Single Particle Laser-Ablation Time-of-Flight Mass Spectrometer (SPLAT) and a commercial Aerosol Time-of-Flight Mass Spectrom-eter (ATOFMS, TSI Model 3800). During CLACE 6 the SPLAT instrument characterized 355 individual IR that pro-duced a mass spectrum for at least one polarity and the ATOFMS measured 152 IR. The mass spectra were binned
Correspondence to:J. Curtius
in classes, based on the combination of dominating sub-stances, such as mineral dust, sulfate, potassium and elemen-tal carbon or organic material. The derived chemical infor-mation from the ice residues is compared to the JFJ ambi-ent aerosol that was sampled while the measuremambi-ent station was out of clouds (several thousand particles analyzed by SPLAT and ATOFMS) and to the composition of the residues of supercooled cloud droplets (SPLAT: 162 cloud droplet residues analyzed, ATOFMS: 1094). The measurements showed that mineral dust was strongly enhanced in the ice particle residues. Close to all of the SPLAT spectra from ice residues did contain signatures from mineral compounds, al-beit connected with varying amounts of soluble compounds. Similarly, close to all of the ATOFMS IR spectra show a min-eral or metallic component. Pure sulfate and nitrate contain-ing particles were depleted in the ice residues. Sulfate and nitrate was found to dominate the droplet residues (∼90% of
1 Introduction
In the atmosphere, freezing of water can occur homoge-neously or heterogehomoge-neously. The homogeneous process is the spontaneous formation of ice within a liquid droplet and requires temperatures of<−37◦
C and saturation near that of liquid water (Koop et al., 2000). The heterogeneous process requires the presence of an ice nucleus (IN) which allows ice phase formation starting at temperatures already slightly be-low 0◦
C for some types of IN (Vali, 2008; Szyrmer and Za-wadzki, 1997). Heterogeneous ice nucleation in clouds with supercooled water results in subsequent efficient growth of the ice crystals due to the Bergeron-Findeisen process. This represents the main initiation process of precipitation at mid-latitudes (Pruppacher and Klett, 1997; Lau and Wu, 2003).
For a better understanding of ice formation in mixed-phase clouds, for improved forecasting of precipitation and for es-timating the anthropogenic influence on these processes it is important to know how the chemical composition of an aerosol particle influences its ability to act as an IN. Cantrell and Heymsfield (2005) describe the current understanding of the production of ice in tropospheric clouds. While signifi-cant progress in understanding homogeneous nucleation and secondary ice production has been made, much less is known about heterogeneous nucleation. Some important sources of ice nuclei have been identified, but there is still a lack of a theoretical framework and open questions exist concerning the physical and chemical properties of the IN and, in partic-ular, the question of anthropogenic influence. Also, the state of mixing of the IN and the influence of possible coatings on ice nucleation require detailed further analysis.
For primary ice production there are several heteroge-neous pathways of freezing: deposition, condensation, im-mersion, contact and evaporation freezing (Pruppacher and Klett, 1997; Durant and Shaw, 2005). To investigate the heterogeneous freezing process for some of these pathways in the laboratory, aerosol particles are introduced in an en-vironment with defined temperatures and supersaturations, for example, in continuous flow diffusion chambers (CFDC, Rogers et al., 2001; Bundke et al., 2008; Stetzer et al., 2008). Salam et al. (2006) investigated the ice nucleation efficiency for kaolinite and montmorillonite in deposition/condensation nucleation. Both mineral dust samples acted as very effi-cient IN but no activity in the deposition mode for kaoli-nite above−22◦C and for montmorillonite above −15◦C
were observed. For immersion freezing, similar results were obtained by Ettner et al. (2004) for sulfuric acid solu-tion droplets of various concentrasolu-tions containing kaolinite, montmorillonite and graphite as IN. Field et al. (2006) in-vestigated the ice nucleating ability of desert dust particles from the Asian and Saharan desert in the AIDA (Aerosol In-teractions and Dynamics in the Atmosphere) chamber. The activated fraction of dust particles forming ice was 5–10% at
−20◦C.
In the ice nucleation studies described in the previous sec-tion aerosol particles with known composisec-tion, size and ori-gin were introduced into ice chambers. The nature of ambi-ent IN cannot be investigated as easily with chamber experi-ments due to the low,∼10’s per liter, number density of IN in the atmosphere (DeMott et al., 2003). To analyze the chemi-cal composition and ice nucleating ability of ambient aerosol, several field studies have applied a CFDC in combination with mass spectrometric analysis, mainly on single particle basis (DeMott et al., 2003). A CVI (counterflow virtual im-pactor) was used between the CFDC and the PALMS (Par-ticle Analysis by Laser Mass Spectrometry) instrument to evaporate condensed phase water from the IN before chemi-cal analysis (Cziczo et al., 2003). During the INSPECT (Ice Nuclei Spectroscopy) campaigns this combination was oper-ated at the Storm Peak Laboratory, CO, USA, at 3220 m a.s.l. (Cziczo et al., 2003, DeMott et al., 2003; Richardson et al., 2007). It is reported that IN which formed in the CFDC were dominated by Si and SiO. A classification of all INSPECT ice nuclei spectra (Cziczo et al., 2006) identified mineral dust and fly ash as the predominant species, but also metallic com-pounds, sulfate, organics and potassium were found.
Recently, studies by Prenni et al. (2009) and Pratt et al. (2009) highlighted the potential role of biological par-ticles for atmospheric ice nucleation. Single particle mass spectrometry was used by Pratt et al. to reveal that biological particles accounted for∼33% of the ice residues measured in
clouds during the fall season at∼8.0 km altitude. The
freez-ing behaviour of primary biological aerosol particles has also been studied with supercooled water droplets in the Mainz Vertical Wind Tunnel facility (von Blohn et al., 2005). A detailed discussion about the role of biological particles in cloud physics is given by M¨ohler et al. (2007).
To date, cirrus clouds were the only ice-containing clouds for which ice residues were chemically analyzed in the nat-ural environment. In contrast, it was not possible to separate the ice particles from supercooled cloud droplets in mixed phase clouds. With a newly designed Ice-CVI (Mertes et al., 2007), it is possible to separate small ice crystals from super-cooled cloud droplets thus enabling in-situ analysis of the ice residues. A suitable site for such measurements is the High Alpine Research Station Jungfraujoch located in the Swiss Alps which is frequently exposed to mixed phase clouds dur-ing winter with 37% average cloud coverage (Cozic et al., 2007).
In order to characterize the ice residues, single particle laser ablation mass spectrometry was utilized during the CLACE 6 campaign. The chemical compounds within a sin-gle particle are vaporized and ionized with one laser pulse. In contrast to mass spectrometers, which use thermal evap-oration at temperatures<1000◦C such as the AMS
(Cana-garatna et al., 2007), even refractory material like mineral dust particles, which are likely to be important IN, can be analyzed. The limitation of this technique is that it is not quantitative because the process of laser ablation is not un-derstood in detail for complex aerosol particles (Schoolcraft et al., 2000). Nevertheless, the importance of different chem-ical compounds for heterogeneous ice nucleation can be es-timated by classifying the ice residue particles into differ-ent chemical groups and comparing them to the background aerosol.
Single particle mass spectrometry for ambient aerosol par-ticles (but no ice or droplet residues) has been performed previously at the Jungfraujoch research station by Hinz et al. (2005).
2 Experimental
2.1 Sphinx laboratory at the Jungfraujoch
The Sphinx laboratory is situated at 3580 m a.s.l. at the Jungfraujoch (JFJ) in the Swiss Alps at 7◦
59′
2′′
E, 46◦
32′
53′′
N. During the winter months it is located in the free troposphere without regular injections from the plane-tary boundary layer (Coen et al., 2007) and it is frequently surrounded by mixed-phase clouds. The intensive measure-ment period of the Cloud and Aerosol Characterization Ex-periment 6 (CLACE 6) took place from 17 February to 14 March 2007. During that time almost exclusively westerly or northwesterly flow conditions were present. There were no indications of Saharan dust events within this period from any of the measurements or from backtrajectory analysis. The first seven days and the last four days of the measure-ment period no clouds were present at the measuremeasure-ment sta-tion, except for a short cloud event on 19 February. From 24 February until 10 March several cloud events took place when orographic clouds formed locally at JFJ or the station
was exposed to stratiform clouds. Temperatures during the cloud events ranged between −6◦C and−16◦C. As
mea-surement statistics are limited by the low number of analyzed ice residues, it is not attempted to extend the analysis to the differences between single cloud events. Instead, an average over all the cloud events observed over the time period of the campaign is presented.
All inlets for cloud and aerosol sampling were placed on the top platform with the laboratory underneath, ensuring short inlet lines and minor wall losses on the way to the dif-ferent instruments. Two difdif-ferent aerosol inlets were used for the measurements. The permanently installed total aerosol inlet, which is part of the Global Atmosphere Watch (GAW) project, is heated to 25◦
C and is designed to sample the total aerosol when no clouds are present (termed ambient or back-ground aerosol) and to sample the entire aerosol population (interstitial aerosol particles, cloud droplet residues and ice residues of hydrometeors up to 40 µm) during cloud condi-tions (Weingartner et al., 1999). Residence times in the inlet lines from the total inlet to the mass spectrometers were 4– 6 s. The other inlet for the selective sampling of small ice particles is the Ice-CVI, which is operated by Leibniz Insti-tute for Tropospheric Research (IfT) Leipzig. This inlet is described in more detail in the following section.
2.2 Sampling, separation and preparation of ice nuclei
with the Ice-CVI
The sampling principle and the experimentally determined sampling behavior of the Ice-CVI, which consists of four ver-tically aligned modules, is described in detail by Mertes et al. (2007). The cloud air is aspirated by an omni-directional, exponentially-tapered, upward looking horn. The 90◦
sam-pling with respect to the horizontal wind substantially re-duces the undesired collection of ice crystals larger than about 50 µm, which is the size range above which riming and aerosol impaction scavenging by crystals becomes important and resulting residue particles of such large crystals would thus not only contain the ice nuclei. However, during precip-itation periods, the collection of much larger, falling or resus-pended, snowflakes and graupel cannot be completely pre-vented during 90◦
sampling, although the inlet is protected by a roof.
In order to remove the precipitating or windblown particles inside the Ice-CVI and to ensure a controlled upper sampling size, a virtual impactor (VI) is connected downstream of the inlet horn. The dimensions are chosen such that particles larger than 20 µm (D50%cut size diameter) are virtually
Downstream of the VI a pre-impactor (PI) is installed which separates the small ice particles from supercooled droplets. The latter freeze upon contact with impaction plates colder than 0◦
C, while the former bounce off and remain in the sample airflow. A two-stage design was chosen for the PI with upper cut-off diameters of 10 µm and 4 µm for the super-cooled droplets, respectively. Because all sampling was car-ried out at temperatures below−5◦C, the impaction plates
of the PI were not actively cooled and thus equilibrated with the ambient temperature.
The CVI itself is located downstream of the PI to reject the interstitial particles. The CVI inlet is installed inside a wind tunnel where the incoming air is accelerated to up to 120 m s−1, which is needed to reach a D
50%cut size of about
5 µm (Schwarzenb¨ock et al., 2000). A controlled counter-flow is blown out of the inlet tip, which allows only hydrom-eteors of sufficient inertia to enter the system. The super-cooled drops and larger ice crystals have already been re-moved by the PI and VI, respectively, so only small ice parti-cles (5 µm<Dice<20 µm) are sampled with the lower and
up-per cut-off diameters determined by the CVI and the VI. In-side the CVI the small ice particles are injected into particle-free and dry carrier air for complete sublimation of the ice, leaving a residue particle in the sample flow for further analy-sis. Downstream of this section the water vapor representing the sampled ice water content (IWC) and the released residue particles can be analyzed by dedicated instrumentation. The released residue particles are considered to be mainly the original ice nuclei that were responsible for the ice forma-tion in the cloud but it has to be emphasized that the residues were measured after the sublimation of the ice. By use of the inlet horn, the VI, the PI and the CVI, it is ensured that only ice particles in the size range of 5 to 20 µm enter the sampling line and are evaporated. These small ice crystals are expected to be freshly formed and are too small to be significantly af-fected by riming and aerosol scavenging processes. How-ever, secondary ice particles in this size range, if existent, would also be sampled where production processes could be rime splintering, fragmentation during collisions of ice crystals and shattering of some drops during freezing. They mostly will not comprise the original IN but might contain material from the former drop activating CCN, scavenged interstitial particles and trace gases that were taken up and potentially chemically processed by the ice particle. Thus they will leave behind residue particles after evaporation in the CVI as well. However, Mertes et al. (2007) showed that these residues are mainly smaller than about 100 nm and are clearly size-separated from larger ice residues. As the single particle mass spectrometers only detected parti-cles >150 nm (ATOFMS) and >200 nm (SPLAT), the ice residues that were chemically analyzed behind the Ice-CVI are assumed to be mainly the original ice nuclei (IN) in the following. Similarly, we consider the droplet residues that are measured behind the Ice-CVI when the pre-impactor is not installed to be cloud condensation nuclei (CCN).
Nev-ertheless, the exact determination whether an individual ice residue (IR) (or droplet residue (DR)) is really just the origi-nal IN (CCN) or an IN (CCN) plus some additioorigi-nal material or not an IN (CCN) at all is a complex issue that merits fur-ther investigation but is beyond the scope of this paper. Fur-thermore, note that we have no information about the sam-pling location within the cloud, i.e. cloud base, cloud top, cloud edge or cloud core. Moreover, it is not known which heterogeneous nucleation processes were active (deposition, immersion, contact freezing etc.). The small primary ice par-ticles sampled by the Ice-CVI are those that formed most re-cently, thus, we may usually do not sample the most efficient IN which form ice particles first. In some sampling situations however, when ice particles just start to form in the cloud, the most efficient ice nuclei are activated and sampled, and in these situations we miss the less efficient ones. Therefore, we can only state that the sampled primary ice particles had to be quite young. Assuming measured ice particle growth rates between 0.4 and 0.9 µm s−1(Mertes et al., 2001) result
in ice particles “life times” before sampling between 22 and 50 seconds.
The CVI sampling principle, that is the inertial separation of particles in non-equivalent input and output flows, leads to an enrichment (by a factor 5 to 10 depending on the sampling and detection configuration) of the collected hydrometeors and thus of the residue particles (Ogren et al., 1985). This enrichment provides for improved statistics at the low ambi-ent IR number and mass concambi-entrations encountered during CLACE. Quoted ambient IR concentrations have been cor-rected for this enrichment factor.
Temperatures in the Ice-CVI are ambient temperatures from the inlet via VI and PI to CVI tip. From the CVI to the sensors, ice particles are injected into dry and particle-free carrier air at lab temperature, i.e. at 25 to 30◦
C. Ice-CVI residence times are: 6 s from inlet via VI and PI to CVI tip: 6 s, 0.01 s from the CVI tip to the evaporation tube, 6 s inside the evaporation tube and 1–2 s from the evaporation tube to the sensors.
As the concentration difference between ice particles in the cloud and the interstitial aerosol is very large, it is im-portant to show that the Ice-CVI is very efficient at discrimi-nating the interstitial aerosol. If, for example, only 1 % of the interstitial aerosol particles were able to pass the Ice-CVI, the spectra from these particles would typically out-number the IR spectra. To make sure that this is not the case, tests were performed regularly during completely cloud-free periods. When the Ice-CVI was tested under these condi-tions, the CPC counted about 100–1000 times less particles than during cloud events (CPC concentrations<0.005 cm−3
vs. 1–10 cm−3during cloud events). Only the rare particles
that are not activated. This test was done in the beginning, several times during and at the end of the campaign.
2.3 Chemical analysis of single particles
2.3.1 SPLAT
The Single Particle Laser Ablation Time-of-Flight Mass Spectrometer (SPLAT) was developed at the University of Mainz and the Max Planck Institute for Chemistry in Mainz. A full description of the instrument can be found in Kamphus et al. (2008). Here a brief introduction is given.
Particles enter the instrument through an aerodynamic lens assembly which was designed by Schreiner et al. (1999). It consists of seven orifices with decreasing diameters from 1300 µm to 650 µm. The final accelerating orifice has an in-ner diameter of 200 µm. The lens is optimized to focus par-ticles with a vacuum aerodynamic diameter (dva) of 300 nm
to 3.0 µm into a narrow particle beam. During the CLACE 6 campaign the inlet pressure of the aerodynamic lens was held constant at 90 mbar. At this working pressure particles with advabetween 300 nm and 400 nm are detected with highest
overall efficiency.
After passing the aerodynamic lens, the velocity of the particles, and thus their vacuum aerodynamic diameter, is measured by light scattering at two locations separated by 28 mm. The light of a 532 nm cw Nd:YAG laser is cou-pled into a glass fiber equipped with a 50/50 splitter. At the exit of the two fibers the laser beam is focused with a gradient index lens. The scattered light from particles pass-ing through the laser beam is collected in the direction of the laser beam propagation with two lenses, spatially filtered with a 200 µm pinhole and detected with a photomultiplier. From the flight time between the two light scattering signals the particle velocity, and hence the time required to trigger the ablation laser, are calculated. The ablation laser is an ArF excimer laser operating at 193 nm with pulse duration of 8 ns. The laser beam is focused with a 270 mm focal length lens onto the particle beam resulting in power densities of 6.6×10⁹W cm−2. When the laser pulse hits the particle its
components are evaporated and ionized. The resulting ions are detected in a bipolar time-of-flight mass spectrometer equipped with reflectrons. Thus, for every particle detected by both sizing lasers and hit by the ablation laser, informa-tion about the size and its chemical composiinforma-tion is obtained. Not every particle, which is sized, is hit by the ablation laser and generates a measurable mass spectrum. Therefore, for some particles only the size information is available.
The time-of-flight spectra are converted into mass spectra and are integrated for integer masses up tom/z220 for pos-itive and negative ions. No signals were found beyond this value. The resulting vector contains all information about the positive and negative ion spectrum for each particle and is stored consecutively in a matrix. Further data analysis is performed with this matrix.
For classification of mass spectra of single particles differ-ent classification algorithms like k-means (e.g. Zelenyuk et al., 2006), fuzzy c-means (e.g. Hinz et al., 1999) and ART2a neural networks (e.g. Zhao et al., 2005; Zhou et al., 2006) were used and discussed in the literature. A comparison of different clustering algorithm is presented by Hinz and Spengler (2007) and Rebotier and Prather (2007). For anal-ysis of the SPLAT single particle data the open source data mining program Rapid Miner Version 4.1 (Mierswa et al., 2006) was used. Classifications were performed using a k-means algorithm and varying the number of class centers, which is the mean value of all particles belonging to a cer-tain class, from two to ten. The classification algorithm is optimizing the location of the class center in the way that the distance between particles which belong to a certain class center is minimized in comparison to the distance between the class centers. Compared to the fuzzyc-means classifica-tion where particles can be member of more than one class (soft classification), thek-means algorithm assigns a paticle to exactly one class (hard classification). On the basis of the Davies Bouldin validation index (Maulik and Bandyopad-hyay, 2002), and by evaluating the MS-spectra for the cluster center depending on the number of classes, the appropriate number of classes was found for classifying the ice residues, the background aerosol and the droplet residues measured with the SPLAT instrument.
In addition to the k-means algorithm analysis, the peak height for each of the most frequently detected ions is recorded for every particle. This allows to determine how frequent some individual species (e.g. lead) are detected in-dependent of affiliation to a class.
Size calibration of the SPLAT instrument was performed at the beginning of the CLACE campaign with PSL spheres. As the position of the detection lasers was not changed dur-ing the campaign further calibrations were not necessary. Mass calibration was carried out with external calibration at the beginning of the campaign and was refined during the campaign by internal calibration.
2.3.2 ATOFMS
The TSI Model 3800 Aerosol Time of Flight Mass Spectrom-eter (ATOFMS) is a commercially available single particle mass spectrometer. It has been described in detail previously by Gard et al. (1997). A brief description follows.
The ATOFMS functions in a manner similar to most sin-gle particle laser ablation instruments. There are, how-ever, instrument-to-instrument differences to the SPLAT that bear noting. Aerosol enters the instrument through an aerodynamic lens optimized for vacuum aerodynamic diameters (dva) between 100 nm and 600 nm (Liu et al.,
larger than 2000 nm dva during CLACE 6. Particles
within this range are imparted with adva-dependant
veloc-ity. After exiting the lens, particles are detected and opti-cally sized using the transit time between two continuous 532 nm frequency-doubled neodymium-doped yttrium alu-minum garnet (Nd:YAG) lasers. Insufficient scattered light leads to reduced detection efficiency below∼300 nmdva,
al-though this limit is ultimately dependent on the specific light scattering property of the particle. No particles smaller than 150 nmdvawere detected during CLACE 6.
The measured velocity is calculated and used to trigger a 266 nm frequency-quadrupled Nd:YAG laser at a time appro-priate to strike the particle. The purpose of this laser is the same as that of the excimer laser in the SPLAT instrument (i.e., to ablate and ionize the particle). The benefit of the 266 nm YAG is that it is a robust, solid state laser that does not require complex optics or daily maintenance, for exam-ple the change of the gas charge, that an excimer laser does. The downside is that the longer wavelength of this laser lim-its the components which can be detected. For example, pure sulfates and organics do not absorb sufficient radiation at this wavelength to produce ions and, ultimately, a mass spectrum (Thomson and Murphy, 1993; Thomson et al., 1997).
After creation, ions are accelerated in opposite directions down dual linear reflectrons, allowing both positive and neg-ative mass spectra to be recorded for each individual particle. An ideal ‘event’ thus results in a record of particledvaas well
as a positive and negative ion mass spectrum. Negative ions are sometimes not detected (i.e., they are harder to create than positive ions, see below). Particles which pass through only one of the sizing lasers do not generate a recorded sig-nal. Particles which pass through both sizing lasers but are not struck by the ablation and ionization laser, or which do not produce ions, produce advarecord.
The ATOFMS is operated with software provided by TSI. Cluster analysis was performed using the open source soft-ware Enchilada (Gross et al., 2006). This requires a peri-odic calibration using input of known size PSL spheres to allow for the determination of particle size. The procedure lasts approximately one hour and was performed every two days. PSL spheres of 260, 300, 500, 670, 1000, and 2000 nm were used. Calibration of the mass spectrum requires input of aerosol with known components to correlate flight time in the mass spectrometer to a known mass peak. This process requires approximately 30 minutes and was performed daily during CLACE 6.
2.4 Optical particle counter measurements
An optical particle counter (OPC) (Grimm, 1.108) was oper-ated at the same inlet as the SPLAT instrument. The OPC uses 15 channels for measuring particle size distributions larger than 300 nm with a 6 s time resolution. Particles larger than 20 µm are detected in the last channel. As the OPC mea-sures in the same size range (particles>300 nm in
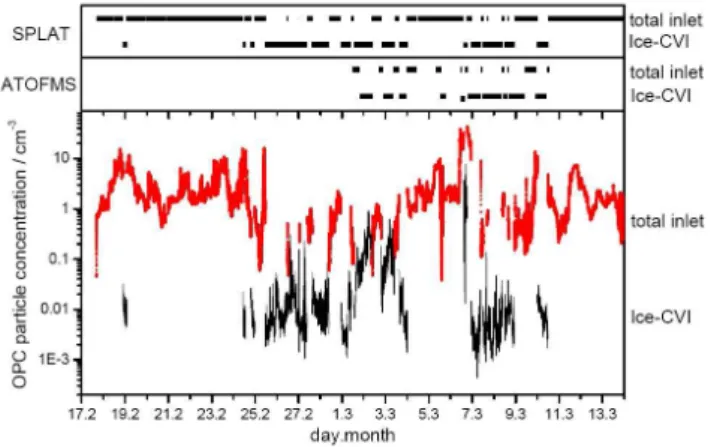
diame-Fig. 1. SPLAT (upper panel) and ATOFMS (middle panel) instru-ments connected to the total inlet and Ice-CVI. For the measure-ments of 6 March the CVI was operated in droplet mode with the pre-impactor removed. Lower panel shows particle concentrations measured with an OPC. Mean particle concentrations with diame-ters>300 nm were 2.6 particles cm−3at the total inlet (red trace)
and 0.03 particles cm−3at the Ice-CVI (black trace, corrected for
Ice-CVI enhancement factor).
ter) as the two single particle mass spectrometers, it delivers an important comparative measurement of particles size and concentration. It is not intended to discuss the size distribu-tions measured by the OPC in detail, instead for the present study the OPC is mostly used as an indicator of the total number of particles>300 nm in diameter that are present in the sampling line after the inlet. For a more detailed discus-sion of size distributions of ice residues etc., see Mertes et al. (2007).
3 Results
During the CLACE 6 field experiment the SPLAT instrument was operated from 17 February to 13 March with only short interruptions for realignment of the particle beam and lasers. Similarly, during periods of mixed-phase clouds the ATOFMS was connected to the Ice-CVI inlet as well. For some periods out of cloud the ATOFMS remained connected to this inlet to verify zero particle counts. At other times the instrument was switched to the total aerosol inlet.
The ATOFMS was operated from 1 through 10 March 2007 for these studies. During the early portion of the CLACE campaign the ATOFMS did not sample due to a fail-ure and subsequent replacement of the desorption and ioniza-tion laser. After 10 March, and during the open intervals in the schedule displayed in Fig. 1, the ATOFMS was also uti-lized to investigate hygroscopic growth of particles (Herich et al., 2008).
the Ice-CVI. During overnight hours both instruments were often operated at a single inlet unattended.
3.1 Concentration and size distribution of background
aerosol particles, ice residues and cloud droplet residues
During the presence of mixed-phase clouds the two single particle mass spectrometers operated at the Ice-CVI, other-wise sampling from the total inlet. The upper panel of Fig. 1 shows at which inlet the SPLAT instrument and the OPC were operated during CLACE 6. The middle panel shows the time periods when the ATOFMS measured at the total or the Ice-CVI inlet. Furthermore, the particle concentration mea-sured with the OPC is plotted in the lowest panel. The arith-metic mean concentration of particles with diameters larger than 300 nm over all measurement periods of CLACE 6 was 2.6 particles cm−3at the total inlet and 0.03 particles cm−3at
the Ice-CVI, respectively, after correction for the ICE-CVI enhancement factor.
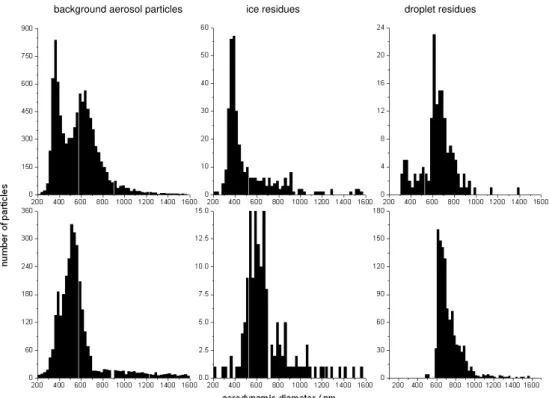
Despite the low particle concentration after the Ice-CVI, mass spectra of 355 ice residues, 162 droplet residues (mea-surements of 6 March with the droplet pre-impactor removed at the Ice-CVI) and 9764 background aerosol particles were analyzed by the SPLAT instrument and 152 ice residues, 1094 droplet residues, and 3212 background particles were analyzed by the ATOFMS, respectively. Figure 2 shows the overall size statistics of the background aerosol particles, ice residues, and droplet residues analyzed by the SPLAT and the ATOFMS instruments. This figure indicates the typical sizes of the particles that were chemically analyzed by the two mass spectrometers. The size distributions from the two instruments do not represent the true size distributions of the respective particles in the sampling line because the detection efficiency of single particle instruments varies strongly with particle size as discussed in detail above and by Kamphus et al. (2008).
It is not possible to quantify exactly the size-dependent de-tection efficiencies for the present measurements. The parti-cle shape and density influences the detection efficiency sig-nificantly and therefore the findings from laboratory studies with spherical PSL particles (Kamphus et al., 2008) cannot be transferred directly to the background aerosol particles, ice and droplet residues measured in the field. As mentioned above, for the SPLAT instrument the detection efficiency at 300-400 nm particle size is over-represented.
Besides the different particle-size dependent detection ef-ficiencies of the two mass spectrometers also note that the time periods of measurement throughout CLACE 6 were only partly overlapping as indicated in Fig. 1, due to instru-mental constraints, use of the ATOFMS for hygroscopicity studies, etc. Therefore, the size measurements from the two instruments should not be compared directly as the aerosol sampled at different times had different size characteristics. Only for the measurement of the droplet residue on 6 March
and for the background measurements before and after the DR event, both spectrometers were measuring and statisti-cally sufficient particles were sampled, so for this measure-ment period a direct comparison is performed.
Furthermore, a comparison of the size information from the two single particle mass spectrometers to the size-resolved measurements from the OPC is limited. The den-sities and the refractive indices of the particles have to be known to be able to compare the vacuum aerodynamic ameter from the single particle instruments with particle di-ameters inferred from the OPC measurements directly. Fur-thermore, the OPC gives only very crude size information for particles<1 µm compared to the size resolution of the mass spectrometers. Nevertheless, from a comparison with the OPC data it can be seen that there is a clear drop in the efficiency when particles were analyzed with sizes be-low 300 nm for both, the SPLAT and the ATOFMS instru-ment. Furthermore, there are relatively few particles ob-served above 1 µm dva by the mass spectrometers during
CLACE 6. This is due to both, the low concentrations and less efficient analysis at these sizes. Note also that a small fraction of particles extend beyond the range of the his-tograms.
The size distributions shown in Fig. 2 contain variations. At the total inlet most of the detected particles had diame-ters of 350–700 nm. The size statistics for the background aerosol over the whole measurement period show a bimodal size distribution. This is largely attributed to the integral statistics for the long time period as the aerosol size dis-tribution varied over the course of the campaign. Specifi-cally, there was a larger average aerosol particle size during cloud-influenced periods whereas in periods without clouds the smaller mode at 300–400 nm dominated.
The ice residue mode diameter was larger than that of the total aerosol, with most particles analyzed with 350–450 nm size for the SPLAT and 500–700 nm for the ATOFMS. Larger yet was the mode diameter of the DR particles, peak-ing at∼600 nm. The addition of DR mass due to sulfate
pro-duction by aqueous phase cloud processing may have added considerably to the large size of the droplet residuals. For the SPLAT and ATOFMS data, there was a noticeable, al-most step-like increase in particle concentration just below 600 nmdva.
3.2 SPLAT results: chemical characterization of
background aerosol particles, ice and droplet residues
3.2.1 Background aerosol particles
17 Feb-13 Mar
ice residues droplet residues background aerosol particles
Fig. 2.Overall size statistics of the background aerosol particles (left), cloud ice residues (middle) and cloud droplet residues (right) detected with the SPLAT instrument (upper row) and the ATOFMS (lower row) during CLACE 6 for the different particle types. Note that these do not represent the actual particle size distributions but represent the sizes of particles that are chemically analyzed instead (see text).
and a negative ion mass spectrum. This may introduce some bias into the classification as only those particles are ana-lyzed where some negative ion spectrum could be generated. In addition to the broad average over all BG data of the cam-paign, as a case study for one specific sitation, for the BG aerosol measured before and after the DR event on 6 March a classification is generated. This allows a comparison be-tween the DR and BG data when comparing the data for the same meteorological situation.
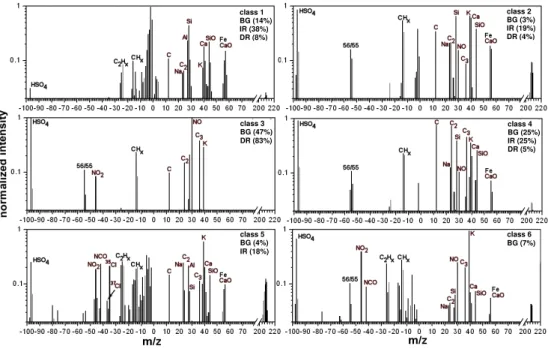
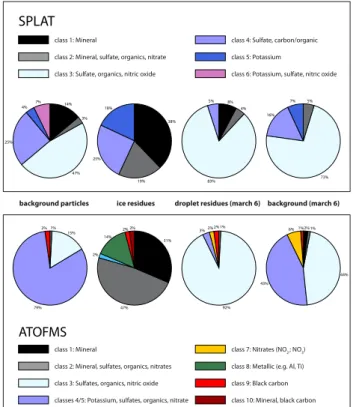
With thek-means clustering approach six different classes for the background aerosol were found, which are presented in Fig. 3. Class 1 and 2 show the strongest signals for min-eral dust, especially peaks from Si, SiO, Al, Ca and CaO/Fe are detected in both classes. They both sum up to∼17% of the background aerosol particles. The biggest difference be-tween these two classes is their sulfate signal. In class 1 there is hardly any sulfate, whereas in class 2 sulfate represents a strong anion signal. This indicates most likely that particles of class 1 are relatively fresh mineral dust particles that have not been coated by sulfate and other liquid secondary aerosol components during atmospheric processing, while particles of class 2 seem to be more aged and at least partly coated.
Whenever strong signals for mineral dust were found, sig-nals fromm/z1 tom/z6 in the negative ion spectrum are present which cannot be assigned to reasonable ions. We tested the influence of these signals by conducting another
classification with the intensity for the negative ion mass channels 1 to 6 set to zero. The resulting class centers were very similar to those presented in Fig. 3 (the percentages for the different classes only changed between 1% and 2%). This demonstrates that the negative ion mass signals atm/z 1 to m/z6 do not influence the classification results.
Almost 50% of the background particles belong to class 3, which is strongly dominated by signals from sulfate (HSO−4), nitric oxide (NO+
), carbon/organics, potassium and nitrate. This class characterizes mostly the typical soluble back-ground aerosol of inorganic and organic secondary aerosol, which is liquid at the encountered temperatures and relative humidity conditions. In class 4 sulfate is also the strongest signal in the anionic spectrum but different to the former class the relation between carbon/organic signals and NO+
signals changes substantially. Nitrates are hardly found, but signals characteristic for mineral dust appear. Along with the signal from HSO−4 at an ion mass to charge ration of 97 amu a signal at 55 or 56 amu is frequently detected (see Fig. 3). It is probably caused by a secondary electron process within the time-of-flight region and does not represent a regular sig-nal.
Finally, in classes 5 and 6 which play only a minor role for the background aerosol particles, potassium is the strongest signal. Class 5 exhibits the largest variety of negative ions: HSO−4, Cl−
, CNO−
class 1 BG (14%) IR (38%) DR (8%)
class 3 BG (47%) DR (83%)
class 5 BG (4%) IR (18%)
class 6 BG (7%) class 4 BG (25%) IR (25%) DR (5%) class 2 BG (3%) IR (19%) DR (4%)
Fig. 3. Cluster centers from the classification of background aerosol particles (BG), ice residues (IR) and droplet residues (DR). For each class only one example from the background aerosol particles or the ice residue SPLAT measurements is given.
is not found in any other class. In the positive ion spec-trum sodium, mineral dust and signals for carbon/organics were found besides potassium. In class 6 NO+
signals are more important while signals for sodium, carbon/organics and mineral dust are depleted.
All classes, except class 1, show a fairly high degree of in-ternal mixing for the background aerosol, which is indicative for processed, aged aerosol, as expected at a rather remote site. Note that class 1 is also the class with the lowest sulfate signals. There is hardly any class described by mass signals which cannot be found in one of the other classes at all. The relation of the intensity of different mass signals is the most important criterion for defining the different particle classes. Table 1 lists how frequently individual chemical com-pounds are found in the BG particles. The table gives the fraction of particles for which the compound is found with a count rate of more than 10% (or more than 1%) of the maxi-mum peak of the spectrum.
3.2.2 Cloud ice residues
When mixed phase clouds were present and the Ice-CVI was operated, the SPLAT instrument and the OPC were con-nected to the Ice-CVI. During that time 355 individual ice residues (IR) were chemically analyzed with a positive and negative ion mass spectrum. The ice residues were sampled during 12 individual cloud phases between 24 February and 10 March. The individual cloud phases lasted from 3 h to >48 h. A large fraction of the spectra (167 IN) were ac-quired between 1 March, 13:30, and 2 March, 09:00, when the OPC measured relatively high particle concentrations
of up to 0.55 particles cm−3. Backward trajectories
calcu-lated with the LME (Local Model Europe) by the DWD (Deutscher Wetterdienst) showed strong westerly flow condi-tions for that time period. Wind speeds of up to 15 m/s were encountered. This raises the risk of windblown snow crystals and secondary ice passing the inlet. It is shown by Mertes et al. (2007) that the residues of such secondary particles are generally smaller than 200 nm and would therefore not be detected by the single particle mass spectrometers. Analyz-ing the particles from this period separately from all other ice residue samples shows that the results are very similar (cf. Table 1) and therefore a bias seems unlikely.
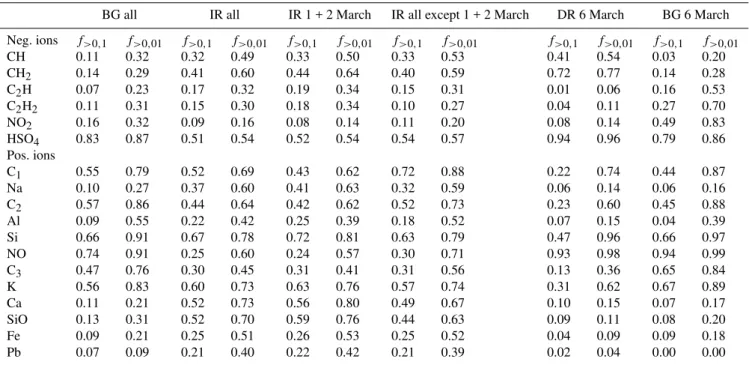
Table 1.Frequency of occurrence of a signal strength of>10% (>1%, respectively) for the listed ion compared to the largest peak of the
spectrum for the SPLAT data; example: in 11% of all background particle spectra the CH−peak was at least as high as 10% of the highest
peak of the spectrum (normalized intensity>0.1).
BG all IR all IR 1 + 2 March IR all except 1 + 2 March DR 6 March BG 6 March
Neg. ions f>0,1 f>0,01 f>0,1 f>0,01 f>0,1 f>0,01 f>0,1 f>0,01 f>0,1 f>0,01 f>0,1 f>0,01
CH 0.11 0.32 0.32 0.49 0.33 0.50 0.33 0.53 0.41 0.54 0.03 0.20
CH2 0.14 0.29 0.41 0.60 0.44 0.64 0.40 0.59 0.72 0.77 0.14 0.28
C2H 0.07 0.23 0.17 0.32 0.19 0.34 0.15 0.31 0.01 0.06 0.16 0.53
C2H2 0.11 0.31 0.15 0.30 0.18 0.34 0.10 0.27 0.04 0.11 0.27 0.70
NO2 0.16 0.32 0.09 0.16 0.08 0.14 0.11 0.20 0.08 0.14 0.49 0.83
HSO4 0.83 0.87 0.51 0.54 0.52 0.54 0.54 0.57 0.94 0.96 0.79 0.86
Pos. ions
C1 0.55 0.79 0.52 0.69 0.43 0.62 0.72 0.88 0.22 0.74 0.44 0.87
Na 0.10 0.27 0.37 0.60 0.41 0.63 0.32 0.59 0.06 0.14 0.06 0.16
C2 0.57 0.86 0.44 0.64 0.42 0.62 0.52 0.73 0.23 0.60 0.45 0.88
Al 0.09 0.55 0.22 0.42 0.25 0.39 0.18 0.52 0.07 0.15 0.04 0.39
Si 0.66 0.91 0.67 0.78 0.72 0.81 0.63 0.79 0.47 0.96 0.66 0.97
NO 0.74 0.91 0.25 0.60 0.24 0.57 0.30 0.71 0.93 0.98 0.94 0.99
C3 0.47 0.76 0.30 0.45 0.31 0.41 0.31 0.56 0.13 0.36 0.65 0.84
K 0.56 0.83 0.60 0.73 0.63 0.76 0.57 0.74 0.31 0.62 0.67 0.89
Ca 0.11 0.21 0.52 0.73 0.56 0.80 0.49 0.67 0.10 0.15 0.07 0.17
SiO 0.13 0.31 0.52 0.70 0.59 0.76 0.44 0.63 0.09 0.11 0.08 0.20
Fe 0.09 0.21 0.25 0.51 0.26 0.53 0.25 0.52 0.04 0.09 0.09 0.18
Pb 0.07 0.09 0.21 0.40 0.22 0.42 0.21 0.39 0.02 0.04 0.00 0.00
ice nuclei from fires in the Petters et al. study. Class 3 (char-acterized by strong sulfate and NO+
signals), which is dom-inating the background classification with almost 50% and which is typical for soluble aerosol particles, was not found for the ice residue classification at all. Note that in this class mineral compounds like Si, SiO, Ca and Na are virtually ab-sent (Fig. 3).
As can be seen in Fig. 3 some of the classes show signals at a mass to charge ratio of 206–208 which can be identified as the characteristic isotopic pattern of lead (206Pb+−208Pb+
). Signals from lead were detected with SPLAT in 9% of the background aerosol particles and in 40% in the IR. Although lead was frequently detected in the BG and IR particles it was not a compound that was specific to certain particle classes when applying thek-means classification. It seems that lead indeed is a compound that enhances ice nucleation consider-ably. The lead most likely stems from combustion of leaded fuel that is still allowed to be used today for aviation fuel of helicopters and small aircraft. After combustion, the lead attaches to various particle types. A detailed discussion of the enhanced frequency of lead occurence in ice residues, its effects for ice nucleation and the consequences for cloud for-mation and climate, including a discussion of the ice residual data from the CLACE 6 campaign is given by Cziczo et al., 2009, therefore we will not extend the discussion of this issue here. Earlier studies already suggested that lead, especially in the form of lead iodide, plays a role for ice nucleation (e.g.,
Schaefer, 1945 and 1966; Borys and Duce, 1979; Detwiler and Vonnegut, 1981).
The lead found in various classes after thek-means classi-fication, albeit with relatively small signal strength, demon-strates a general issue of the classification for the ice resid-uals. The ability of a particle to act as an ice nucleus may depends on small amounts of certain substances that do not make up the main components of the particle which deter-mine the classification. Therefore, Table 1 lists the frequency of occurrence for various compounds detected by SPLAT with signal strengths larger than 10% (and larger than 1%, re-spectively) of the highest signal found in the particle spectra, independent of the classification. This shows that especially mineral and metal compounds like Ca, Na, SiO, Fe and Pb are found with considerably higher frequency in ice residues than in the background aerosol.
3.2.3 Cloud droplet residues
backward trajectories calculated with the LME model by the DWD showed that air masses were coming from the Iberian Peninsula and the western Mediterranean Sea during this pe-riod.
For the DR the composition changes completely compared to the IR. Predominantly sulfate and nitrate (NO+
) are found. Class 3 makes up 83% of the particles, HSO−4 and NO+
are detected with signals larger than 0.1 of the normalized inten-sity in 94% and 93% of the particles (Table 1). The other classes 1, 2 and 4 contribute to the droplet residues only to a very small extent. Class 5, dominated by potassium accom-panied by a variety of anions, and class 6, potassium with nitrates, were not found for the DR classification on this day. Note that potassium is still present in∼31% of the DR par-ticles with signal strength>0.1 of the maximum signal, but is substantially less frequent than in the BG particles of 6 March (67%; Table 1).
3.2.4 Comparison of particle class abundance for ice
and droplet residues and background aerosol particles
Due to the low particle concentrations, for the ice residues only mean particle populations are compared, averaged over long time periods with air masses coming from different re-gions. Therefore, only general statements on the chemical composition of the IR are made and it is not attempted to discuss the temporal evolution of the IR composition or dif-ferences in IR composition as a function of cloud type, tem-perature during sampling, etc. Nevertheless, it can be seen from Table 1 that the IR analyzed, e.g., just during 1 and 2 March do not show a substantially different composition from the IR analyzed over the rest of the campaign.
It is not justified to compare IR composition from one pe-riod with BG paricles from another pepe-riod, when the origin of the air masses and the particle sources were different. There-fore, a direct comparison of the pie charts of Fig. 4 for the different particle types is limited. If comparisons are made these should be regarded as qualitative. For a more substan-tial direct comparison, only the time period of 6 March is analyzed in detail, when statistically sufficient numbers of BG and DR particles were sampled in comparable air mass conditions and when both mass spectrometers operated si-multaneously.
The abundances of the different particle classes are given in Fig. 4 as percentages for the background aerosol particles, ice and droplet residues. For the IR it can be seen that class 1 and class 2, which are dominated by mineralic compounds, account for 57% of the IR particles. The mineral class with minimal sulfate (class 1) represents 38% of the total IR. This class can also be found for the BG and DR but in these cases only 14%, and 8% respectively, of the analyzed particles are classified into these categories. The mineral class with sul-fate (class 2) constitutes 19% of the IR particles but only 4% of the DR and 3% of the BG. In summary, this demonstrates
class 6: Potassium, sulfate, nitric oxide class 5: Potassium
class 4: Sulfate, carbon/organic
class 3: Sulfate, organics, nitric oxide class 2: Mineral, sulfate, organics, nitrate class 1: Mineral
class 9: Black carbon class 8: Metallic (e.g. Al, Ti) class 7: Nitrates (NO2 ; NO3)
class 3: Sulfates, organics, nitric oxide class 2: Mineral, sulfates, organics, nitrates class 1: Mineral
class 10: Mineral, black carbon classes 4/5: Potassium, sulfates, organics, nitrate
background (march 6) droplet residues (march 6)
ice residues background particles
SPLAT
ATOFMS
38%
19% 25%
18%
3% 14%
47% 25%
4%
7% 8%
4%
83% 5%
73% 5%
16% 7%
44%
43% 6% 1%2% 1%
92% 3%2% 2% 1%
47% 31% 2% 2% 14%
2%
79% 15% 2% 1%
Fig. 4.Frequency of occurrence of particle classes for SPLAT (up-per row) background particles (9764), ice residues (355), droplet residues (6 March, 162), background particles (6 March). ATOFMS (lower row) background particles (3212), ice residues (152), droplet residues (6 March, 1094), background particles (6 March).
the important role of mineral components for the ability of a particle to act as an efficient ice nucleus in the atmosphere.
Another chemical component which exhibits strong vari-ations between IR, BG and DR is sulfate. For the IR classi-fication strong sulfate signals can be found in class 2 (19%) and class 4 (25%). Together they account for 44% of the IR. The classification for the background aerosol resulted in three classes with strong sulfate signals: class 3 (47%), class 4 (25%) and class 6 (7%). All three classes sum up to 79% which shows that sulfate is depleted, on a particle number basis, in the ice residues. Class 3, characterized by a strong signal for HSO−
4 and NO
+, is not present in the IR
Class 5 is found in the IR and BG classification (Fig. 3), which shows mainly potassium combined with some mineral peaks and a large variety of negative ion signals. In addition to NO−2, carbon/organic fragments and sulfate also substan-tial amounts of lead are present. Furthermore, this is the only class where chloride (m/z35 andm/z37) can be found. This class is not present in the DR classification. It can be stated that there is a qualitative enhancement of this particle class in the IR compared to the BG aerosol even when considering the limited comparability of the two groups as stated above. This enhancement may be due to the role of lead in ice acti-vation.
3.3 ATOFMS results: chemical characterization for
background aerosol particles, ice residues, and droplet residues
3.3.1 Background aerosol particles
The background aerosol particles (BG) analyzed during CLACE 6 were grouped into 8 classes. Not all classes were required to individually group the IR and DR subsets of spec-tra but all were present, albeit some at low concenspec-trations, in the background aerosol (i.e., those sampled from the to-tal inlet over the course of CLACE 6). The classification for each group is given in Fig. 4. Classes are not meant to repeat those given for the SPLAT instrument but many are correlated. For consistency with the SPLAT data, compa-rable classes were numbered the same as the corresponding SPLAT classes. Further information is given in the discus-sion.
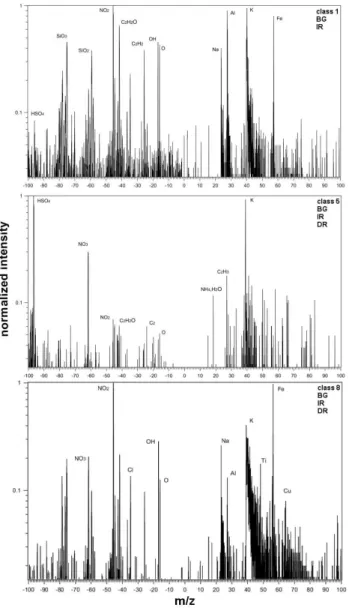
Class 3 exhibited large sulfate signals as negative ions, with lesser abundances of organic fragments in this and the positive. Nitrate fragments were occasionally observed, nor-mally as NO−2 and NO−3. Class 5 exhibited the same ions as class 3 but with potassium in the positive polarity; this is of-ten associated with biomass burning aerosol (Hudson et al., 2004). A dual polarity spectrum of a particle of class 5 is shown in Fig. 6. Notable features include a large signal due to potassium but with a lack of other elements that would be associated with mineral dust or sea salt. Instead, organic fragments are found in both polarities and this may be indica-tive of material associated with the combustion process or later taken up from the gas phase. Sulfate, most pronounced in negative polarity, is most likely due to gas-phase uptake or coagulation with other particles.
Class 1 includes mass spectra with potassium, sodium, cal-cium, iron, aluminum, and barium, among other metals, in the positive spectra. Silicon and silicon oxides were com-monly observed in negative polarity, as was chlorine. Few volatile compounds were present in this class. This class would commonly be termed mineral dust or fly ash. An ex-ample of this type is also given in Fig. 6. It is noteworthy that this class was diverse, with any combination of the aforemen-tioned species being from the largest feature in the spectrum
or not being present. Class 2 exhibited many of the same features as class 1 but included sulfate, nitrate, and organic fragments, most often as negative ions. Thus, this would be typical for mineral dust or fly ash that had taken up gas-phase species. Nitrate fragments were often found in the negative polarity. Class 10 includes the same mineral features as class 1 and 2 but with features, normally in negative polarity, due toCn(where C is mass 12 andnis an integer). This class
appears to be an agglomeration of black carbon and mineral dust.
Class 8 is termed metallic. This is a diverse class com-posed of spectra with features due exclusively to metals. For example, several spectra had signal only due to aluminum ions in the positive or, alternately, only titanium. An exam-ple is given in Fig. 6. More information regarding this class is contained in the ice residue section. Class 9 contained features due toCn, predominantly in negative polarity, often
along with organic fragments in both the negative and pos-itive. Class 7 predominantly exhibited fragments of nitrate (e.g., NO−2 and NO−3).
In sampling from the total inlet most of the particles were analyzed outside clouds. The most abundant class was 5, dominated by a potassium peak that indicates an influence from biomass burning. These particles comprised almost 8 in 10 particles analyzed. This is consistent with the work of Murphy et al. (2006) who observed non-volatile materials, most commonly from combustion processes, in 60–80% of mid-tropospheric particles using single particle mass spec-trometry from airborne platforms. The second most abun-dant class was 3, sulfates and organics with little or no potassium. The other classes made up the remaining 6% of spectra. Noteworthy is that mineral dust and fly ash with some volatile material (class 2) was approximately 1%, about twice the abundance of mineral dust without volatiles. Black carbon was about 2% of the aerosol. This is somewhat less, by about a factor of two, than was observed during a previous CLACE campaign (Cozic et al., 2008).
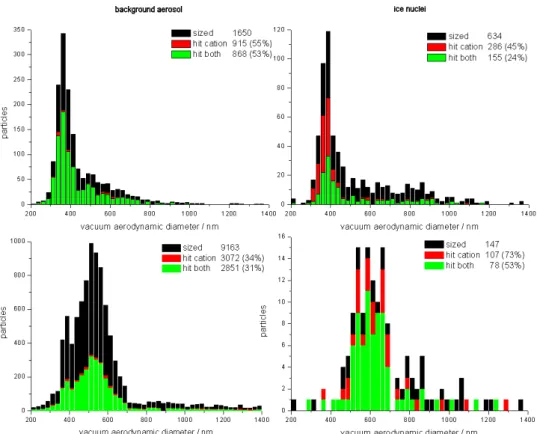
Fig. 5. Histograms for sized particles (black), particles with only a positive ion spectrum (red) and particles with both polarity spectra (green). Left: background aerosol particles; right: ice residues. Top row: SPLAT, data from 19 February for BG and from 1 March for IR; bottom row: ATOFMS, all data.
3.3.2 Cloud ice residues
As described in the introduction, ice nucleation in the het-erogeneous regime requires the presence of a surface that en-hances the formation of the solid phase (e.g., Pruppacher and Klett, 1997). As such, it is not expected that entirely aqueous particles, e.g. class 3, would act as efficient nuclei. This ap-pears to be the case. The vast majority of ice residues fall into class 1 (31%, mineral dust and fly ash), class 2 (47%, min-eral dust and fly ash and some volatiles) and class 8 (14%, metallic). Black carbon and black carbon associated with mineral dust each comprised about 2% of the ice residues. It is noteworthy that black carbon measured with Particle Soot Absorption Photometers and the ATOFMS, in addition to be-ing more common durbe-ing the previous experiment CLACE 5, was also enhanced by a factor of about 2 in the ice phase (Cozic et al., 2008). During CLACE 6 the ATOFMS mea-surements revealed no obvious enhancement of BC in the ice phase, being∼2% of the population by number in both the
background and IR aerosol populations.
Two striking features are worth mentioning. First, very similar to the SPLAT results, no particles falling into class 3 (sulfates and organics) were found in the ice phase. Likewise, no particles in class 7 (nitrates) were either. Second, the pre-dominant background class 5, associated with biomass
burn-ing signatures from potassium mixed with signatures from sulfates, nitrates and organics, was extremely depleted in the ice phase. While class 5 particles made up almost 80% of the background aerosol it made up less than 2% of the IR.
3.3.3 Cloud droplet residues
On 6 March the Ice-CVI was used for droplet analysis. Dur-ing this period spectra from just under 1100 particles were obtained. Of these, 92% were from class 3 (i.e., sulfates and organics). As for the IR there was a significant depletion of the potassium containing class 5 from 43% in the back-ground aerosol particles on 6 March to 3% in the DR. The nitrate class 7 was observed at about 2% in the DR. Black carbon (class 9) and minerals with volatiles (class 2) were found at about their background levels. No pure mineral, metallic, or mixed mineral and BC particles were observed in the DR during this period.
3.3.4 Comparison of classification results for BG, IR
and DR
Fig. 6.Particle spectra representative of ATOFMS class 1 (mineral dust or fly ash), 5 (biomass burning) and 8 (metallic). Presence of each type in the background aerosol (BG), ice residues (IR) and droplet residues (DR) is noted.
and a biomass burning signature (potassium). Particles of mineral dust, black carbon, and a combination of these were all found at the sub-2% level.
The DR were the most easily grouped into a single class. Over 9 in 10 DR particles fell into class 3. This is not alto-gether surprising. Sulfates and some organics are highly hy-groscopic and readily uptake water. Note that the most pop-ulous background category, the one revealing a high fraction of potassium, which most likely is of biomass burning origin, makes up only 3% of the DR. This may be explained by the fact that biomass burning aerosol, especially before uptake of gases, is concentrated in hydrophobic materials and has been referred to as “tar balls” (Posfai et al., 2003). It is also possi-ble that the air masses that were sampled on the day when the
DR measurements were conducted did not contain as much biomass burning aerosol components as on other days.
The IR population is more diverse but is predominantly derived from a much smaller segment of the background aerosol. Specifically, the majority of IR come from the min-eral dust and fly ash, minmin-eral dust and fly ash with volatiles, and metallic categories. This is again not unexpected. De-Mott et al. (2003), for example, found mineral dust, fly ash, and metals highly enhanced in ice-forming aerosol even though these are not abundant in the background aerosol. Furthermore, biomass burning aerosol was not common in the IN analyzed by DeMott et al. (2003) although it was abundant in the background aerosol.
One issue that bears mentioning is the possibility that the metallic particles could be due to artifacts. Previous studies have shown that metallic particles can be shed when ice crys-tals strike inlets during aircraft flight (Murphy et al., 2004). Although the impaction of small ice particles on surfaces in the drop pre-impactor cannot be avoided for their separation from super-cooled drops, their impinging velocities are lower than for aircraft studies (Mertes et al., 2007). Empirically, neither SPLAT nor the ATOFMS spectra showed significant signatures of Fe and these were not accompanied by other peaks typically found for stainless steel particles (e.g., Mo, Ni and Cr). Nevertheless, further experiments to rule out po-tential artifacts in the Ice-CVI are warranted.
3.3.5 Comparison of classification results between the
two instruments
The classes used for the ATOFMS data are not directly re-lated to those found for the SPLAT but there are noteworthy similarities. For example, bare mineral dust classes are found in both data sets (class 1 for the SPLAT and ATOFMS). Likewise, mineral dust with volatile materials is also found with both instruments (class 2 for the SPLAT and ATOFMS). Class 3 for the ATOFMS, which contains sulfates and organ-ics and some nitrate, is a combination of SPLAT classes 3 and 4. For the ATOFMS, the ratios among sulfate, organic and nitrate fragment signals are variable and do not allow for separation into sub-classes. While the sulfate signal was commonly the most dominant in negative polarity mass spec-tra, the specific ratio of sulfate to organic fragment signals varied continuously such that at times they were equivalent, or even dominated by the organics. There was, therefore, no ratio that could be chosen as a logical breakpoint between sub-classes. Likewise, class 5 of the ATOFMS data, likely attributed to biomass burning, contains K+with sulfates,
or-ganics, and some nitrate fragments in variable ratios. This is equivalent to SPLAT classes 5 and 6.
instruments were measuring. Therefore, only the 6 March BG data of the two instruments can be compared directly (Fig. 4). Most aerosol particles are composed of sulfates and organics with some nitrate and K+
. Specific numeri-cal differences are most likely attributed to the fact that the ATOFMS clusters do not account for variation in the ratios among these (i.e., sulfate to organic ratio). As classes 3 and 4 of the SPLAT data also contain significant potassium signals (see Fig. 3 and abundancy of K+
in Table 1), the differences between these classes for the data from the two instruments do not represent a contradiction. A classification of the data from the two instruments using identical classification pro-cedures would be desirable but is beyond the scope of this paper.
There is both agreement and disagreement in the IR data sets of the two instruments. Mineral dust, with and without volatiles, is common in both data sets (78% for ATOFMS, 57% for SPLAT). Class 3, the pure secondary aerosol, is ab-sent in the IR in the SPLAT as well as in the ATOFMS. Little biomass burning aerosol can be found in the ATOFMS data. There is a higher abundance of K+
-containing aerosol in the SPLAT data (class 4 and 5). As K+
is found in mineral dust as well as in biomass aerosol, it is not clear if some of this material is due to the former in the SPLAT data. Class 4 of SPLAT contains signals from Ca, Fe and Si (Fig. 3), therefore it is likely that this class represents particles with an insoluble core that can act as the IN that are coated by soluble com-pounds like sulfate, nitrate and organics. The discrepancy between SPLAT and ATOFMS in this case warrants further field and laboratory investigations. Furthermore, some sig-natures from metals such as titanium or copper were found in some of the ATOFMS IR data that were not detected in the SPLAT IR spectra (class 8).
The droplet residue data are very similar for both instru-ments. The vast majority of both data sets indicate sulfates and organics with some nitrate accounting for 95% for the ATOFMS and 88% for the SPLAT spectra (classes 3 and 4). Mineral dust is found in a lesser abundance in both data sets. K+
-containing (i.e., biomass burning) aerosol particles were strongly depleted as DR in both data sets (classes 4, 5 and 6) compared to the BG particles of 6 March. Although these classes were not as abundant in the BG aerosol on 6 March as in the BG average (Fig 4), the reduction of K+
-containing particles in the DR is substantial and indicates that the potassium-containing particles seem to be less CCN active.
For all particle categories, the different wavelength of the desorption and ionization lasers between the two instruments is important. Fragment ratios and classification would not be expected to be exactly the same between the two instruments since the SPLAT, with the shorter wavelength laser, is ex-pected to detect substances that are difficult to ionize, such as sulfates and organics, more easily. Furthermore, even for laboratory-generated particles, single mass spectra vary in relative intensity for different mass signals from particle to
particle (Hinz and Spengler, 2007). Therefore, the results presented are not quantitative. In addition to this, the power density of the ablating laser plays an important role (John-ston, 2000; Hinz and Spengler, 2007). In summary, these effects are likely to explain some of the differences observed in the chemical classification between the two instruments. With the deployment of the SPLAT and the ATOFMS dur-ing the CLACE 6 campaign, which operate with 193 nm and 266 nm ablation laser wavelength, respectively, the results obtained were similar in general, but it should be emphasized that the two instruments were basically run as complemen-tary measurements. Even when restricting the comparison to identical short time periods as for the BG particles of 6 March only, substantial differences between the two instru-ments remain (Fig 4). A strict and comprehensive intercom-parison of the two instruments was not intended and would have required a different measurement strategy and common calibration and classification procedures.
In Fig. 5 the size distributions for sized particles, chem-ically analyzed particles with only positive ion mass spec-tra, and for chemically analyzed particles with bipolar mass spectra are shown for the IR and the BG particles for both in-struments. For the SPLAT instrument, the hit rate, which is defined as the relation of chemically analyzed particles to de-tected particles, is 45% for those IR resulting in only positive ion mass spectra, and 24% resulting in bipolar spectra. For the background aerosol these percentages are 55% and 53%, respectively. For the ATOFMS these values are 73% for the IR resulting in only positive ion mass spectra, and 53% re-sulting in bipolar spectra. For the background aerosol these percentages are 34% and 30%, respectively.
This can be explained by two effects: in the IR popula-tion there are many non-spherical mineral particles causing a broader particle beam and thus a lower hit rate because many ablation laser pulses miss the particles in the broad beam. This could explain the lower hit rate of the SPLAT for the IR. In contrast, the SPLAT instrument with the lower abla-tion wavelength is able to detect particle types that are hard to ionize, whereas the ATOFMS does not detect, for example, pure sulfate particles efficiently. Therefore, the ATOFMS likely does not resolve a fraction of the sulfate and organic rich particles which dominate the background aerosol caus-ing the lower hit rate for the ATOFMS background measure-ment. From these data this effect appears to be larger than the beam broadening effect for this instrument that also exists in the IR measurements. A discussion of this effect is presented in a review article by Murphy (2007) and references.
Almost all spectra with only positive ion signals exhibit a common pattern showing C+
analogue both resulted in pure carbon peaks (C+, C+
2 and
C+3) for the positive ions. Also, in the negative ion spec-tra pure carbon signals dominated, but in addition, for the PSL particles signals for C2Hxappeared. With this, a
differ-entiation between OC and BC might be feasible but further laboratory studies on this topic with special emphasis on the fragmentation with varying laser power density need to be conducted.
3.4 Comparison with other studies
Our results can be compared with data from the INSPECT campaign where a single particle mass spectrometer was op-erated behind a continuos flow diffusion chamber (CFDC) to analyse ice nuclei at Storm Peak Laboratory, CO, USA, at 3220 m a.s.l. (Cziczo et al., 2003; DeMott et al., 2003; Richardson et al., 2007). In these studies, ice nuclei acti-vated in the CFDC were dominated by Si and SiO. The clas-sification of the INSPECT ice nuclei spectra identified min-eral dust and fly ash as the dominant category of the het-erogeneous ice nuclei, furthermore metallic particles as well as sulfate and organic particles formed important IN parti-cle classes (Cziczo et al., 2006; De Mott et al., 2003). TEM analysis of the fly ash/mineral dust category particles sug-gests that 20% are from industry, identified by their high sphericity, and the rest are from natural sources (DeMott et al., 2003). In the fly ash/mineral dust category a quar-ter of the particles contained measurable sulfate or organ-ics. Both studies, INSPECT and CLACE show the impor-tance of mineral compounds for the heterogeneous ice nu-cleation process, for CLACE the mineal dust and processed mineral dust group seems to be even larger than for the IN-SPECT data. The metallic particle class (identified by the ATOFMS in CLACE) also represents a significant class (and is enhanced compared to background particles) in both stud-ies. The qualitative agreement between the two studies is re-markable considering the different geographic locations, dif-ferent exposure to anthropogenic sources at the location and the fact that in INSPECT potential ice nuclei were sampled outside clouds while in CLACE ice particle residue from ac-tual clouds were analyzed.
The results of the present study can also be compared with those presented by Cziczo et al. (2004) on cirrus ice residues during CRYSTAL-FACE. Note that the SPLAT and the PALMS instruments utilize ablation lasers with the same wavelength. The combination of sulfate, potassium, organics and NO+(termed as the “SKON group”) forms an important
particle class in both studies. Cziczo et al. (2004) found 95% of the particles outside cirrus clouds and 88% of the intersti-tial aerosol belonging to the SKON group. For the SPLAT results, the corresponding group is class 3 with 47% for the background aerosol. If classes 4 and 6 which also show sig-nals similar to the SKON group are added, the overall per-centages increase to 79%. In their study the authors reported a much lower value of 28% for the SKON group in cirrus ice
nuclei with 8% during a dust event. For the IR in mixed phase clouds we did not find any class 3 particles in our study. But if we consider class 4 in addition, as stated above, we find 25%. As the OPC measurements for particles larger 1 µm and the backward trajectories did not indicate that any dust events influenced the CLACE 6 measurements directly, we have no comparative results for IR during a dust event. Neverthe-less, the agreement concerning the SKON group between the two studies is noteworthy, although for the CRYSTAL-FACE data homogeneous ice nucleation might have taken place.
During the CRYSTAL-FACE campaign mineral dust/fly ash was found in 1% of the particles outside clouds and in 6 % of the interstitial particles. These values increased to 44% and 64% for ice residues in general and IR during a dust event, respectively. In mixed phase clouds during CLACE 6 we detected signals for mineral dust in 57% of the IR (class 1 and 2). For the background aerosol particles this value de-creased to 17%. This is also in good agreement with the CRYSTAL-FACE data. Again, similar to the agreement with the INSPECT study, the agreement between CLACE and CRYSTAL-FACE for the SKON type particles and the min-eral dust/fly ash classes might indicate that the enhancement of mineral dust and fly ash components in IR is a rather uni-versal feature of ice nucleation in the free troposphere rather independent of geographic location, cloud type and altitude. Recently, Pratt et al. (2009) studied ice particle residues in orographic ice clouds at∼8 km altitude (−31 to−34◦C)
over Wyoming during the fall season using aircraft-aerosol time-of-flight mass spectrometry. They found that mineral dust (especially clay minerals such as illite, montmorillonite and kaolinite) accounted for∼50% and biological particles for∼33% of the ice crystal residues. The biological particles were identified by characteristic signals from organic nitro-gen and phosphor m/z 42 (CNO−
), 26 (CN−
), 79 (PO−3) in negative ion mode and simultaneous organic and calcium markers in positive-ion mode such m/z12 (C+
), 24 (C+2), 27 (C2H+3), 40 (Ca+), 56 (CaO+), and others. We inspected
the ice residue spectra from SPLAT and ATOFMS for these characteristic markers and found only about 2–3% of the ice residue that could be classified as biological. The presence of biological ice nuclei most likely depends strongly on the source region and season of the sampled air masses and the fraction of biological ice residues may vary greatly.