Programa de P´os-Gradua¸c˜ao em Engenharia El´etrica - PPGEE Escola de Engenharia - EE
Universidade Federal de Minas Gerais - UFMG
Ride-Through Fault Capability Improvement
Through Novel Control Strategies Applied
for Doubly-Fed Induction Wind Generators
Victor Flores Mendes
Tese submetida `a banca examinadora designada pelo Colegi-ado do Programa de P´os-Gradua¸c˜ao em Engenharia El´etrica da Universidade Federal de Minas Gerais, como parte dos re-quisitos necess´arios para `a obten¸c˜ao do t´ıtulo de Doutor em Engenharia El´etrica.
Orientador : Prof. Dr. Selˆenio Rocha Silva Co-orientador : Prof. Dr. Ing. Wilfried Hofmann
iii
important thing is not to stop questioning.”
Acknowledgment
I would like to thank: God in first place;
my wife, Marina, who is always supporting me and without her everything would be harder;
my little princess, Eduarda whose smile is my greatest motivation; my parents, Edilson and Silvana, the reasons I am here;
my brothers, Vinicius and Peu, for being so close even being far;
my mother in law and father in law, Eduardo e Vera, who always have been like parents for me;
my grandfathers and grandmothers, here or somewhere else;
my Professor and friend Selˆenio, my master and professional example. Professor Wilfried Hofmann for the opportunity to develop part of my research at TU-Dresden and the incentive in my work;
the co-workers in the laboratory here in Brazil and in Germany: Clo-dualdo, Jo˜ao, Fred, Guilherme, Pedrinho, Tameir˜ao, Tom´as, Caio, Si-las, Heverton, Balduino, Bastian, Sebastian, ... Everyone helped a lot for the realization of this thesis;
the friends and family;
the professors and colleagues of UFMG, UNIFEI and TU Dresden.
Table of Contents
Resumo xiv
Abstract xvi
Table List xvii
Figure List xxxiii
Symbol List xxxvii
Abbreviation List xl
1 Introduction 1
1.1 Brief History of Wind Energy . . . 1
1.2 Overview of Wind Energy Nowadays . . . 2
1.3 Technologies of Wind Energy Conversion Systems . . . 3
1.4 Voltage Sags . . . 6
1.5 Motivation and Objectives . . . 8
1.6 Methodology . . . 10
1.7 State of Art . . . 11
1.8 Contributions . . . 15
2 Doubly-Fed Wind Energy Conversion System 19
2.1 Introduction . . . 19
2.2 The DFIG Technology . . . 19
2.2.1 Wound rotor induction generator . . . 21
2.2.2 LCL Filter . . . 23
2.2.3 Converters . . . 24
2.3 Classical Control Strategy . . . 24
2.3.1 GSC control . . . 24
2.3.2 Phase-Locked Loop (PLL) . . . 25
2.3.3 RSC control . . . 26
2.4 The Simulation Model . . . 28
2.5 The Test Benches . . . 30
2.5.1 Sag generator using impedances (ISG) . . . 33
2.5.2 Industrial Power Corruptor (IPC) . . . 36
2.6 Final Considerations . . . 36
3 DFIG Behavior During Balanced Voltage Sags 37 3.1 Introduction . . . 37
3.2 Mathematical Modeling . . . 37
3.2.1 Time domain model . . . 38
3.2.2 Laplace domain model . . . 39
3.2.3 Open rotor circuit analysis in time domain . . . 42
3.2.4 Open rotor circuit analysis in Laplace domain . . . 50
3.2.5 Complete analysis in Laplace domain . . . 51
3.3 Experimental Results . . . 59
3.3.1 Test 1: Synchronous Speed . . . 59
3.3.2 Test 2: Synchronous Speed, Modifying the Control Gains 66 3.3.3 Test 3: Slip = +0.15 . . . 67
ix
3.3.5 Test 5: Slip = -0.15 - Control Saturation . . . 71
3.3.6 Rotor currents excursion . . . 72
3.4 Simulation Results . . . 73
3.5 Final Considerations . . . 75
4 DFIG Behavior During Unbalanced Voltage Sags 77 4.1 Introduction . . . 77
4.2 Mathematical Modeling . . . 77
4.2.1 Time domain model . . . 78
4.2.2 Open rotor circuit analysis in time domain . . . 79
4.2.3 Laplace domain model . . . 86
4.2.4 Open rotor circuit analysis in Laplace domain . . . 88
4.2.5 Complete analysis in Laplace domain . . . 89
4.3 Experimental Results . . . 95
4.3.1 Test 1: Slip = -0.15, maximum natural component (θ0 = 00) . . . 95
4.3.2 Test 2: Slip = +0.3, no natural component (θ0 = 900) . 101 4.3.3 Test 3: synchronous speed - maximum natural compo-nent (θ0 = 00) . . . 103
4.3.4 Rotor voltage and current excursion . . . 104
4.4 Simulation Results . . . 106
4.5 Final Considerations . . . 108
5 Ride-Through Strategies - Symmetrical Voltage Sags Case 109 5.1 Introduction . . . 109
5.2 Magnetizing Current Control (MCC) . . . 109
5.2.1 Influence of magnetizing current on stator flux linkage 111 5.2.2 Influence of MCC on the rotor currents . . . 116
5.2.4 Influence of the MCC gain on the rotor currents and
voltages . . . 121
5.2.5 Experimental results . . . 124
5.2.6 Application issues . . . 130
5.3 Final Considerations . . . 131
6 Ride-Through Strategies - Asymmetrical Voltage Sags Case133 6.1 Introduction . . . 133
6.2 Compensation of Torque and Reactive Power Pulsations (CTRP)134 6.3 Dual PI Controllers (DPIC) . . . 140
6.3.1 The DPIC strategy . . . 141
6.3.2 Mathematical modeling during the voltage sags . . . . 144
6.3.3 Calculation of the rotor current references . . . 145
6.3.4 Calculation of the grid current references . . . 150
6.3.5 Simulation results . . . 152
6.3.6 Converter limitation analysis . . . 158
6.3.7 Experimental results . . . 163
6.3.8 Considerations about the DPIC strategy . . . 167
6.4 PI Plus Resonant Controllers(PIRC) . . . 168
6.4.1 The PIRC strategy . . . 169
6.4.2 Mathematical modeling during voltage sags . . . 170
6.4.3 Simulation results . . . 174
6.4.4 Considerations about the PIRC . . . 178
6.5 Enhanced PIR Control (EPIRC) . . . 178
6.5.1 The EPIRC strategy . . . 178
6.5.2 Simulation results . . . 179
6.5.3 Experimental results . . . 179
xi
6.6.2 Simulation results . . . 184
6.6.3 Experimental results . . . 185
6.7 Final Considerations . . . 187
7 Conclusions and Future Work 189 7.1 Conclusions . . . 189
7.2 Future Works . . . 191
References 195 A Controllers Tunning and Orientation 205 A.1 Clark and Park Transforms . . . 205
A.2 Modulus Optimum and Symmetrical Optimum . . . 207
A.3 Control Mathematical Modeling and Gains Tunning . . . 209
A.3.1 GSC control . . . 209
A.3.2 RSC control . . . 214
A.4 Controller Discretization . . . 220
B TUD Test Bench Parameters 222
C UFMG Test Bench Parameters 224
Resumo
Devido ao aumento da capacidade de potˆencia instalada em parques e´o-licos pelo mundo, os c´odigos de rede mais modernos contemplam requisitos espec´ıficos para conex˜ao de usinas e´olicas `as redes el´etricas. Dentre esses re-quisitos est´a a suportabilidade dos equipamentos aos afundamentos momen-tˆaneos de tens˜ao, que indica os limites para desconex˜ao das turbinas e´olicas durante estes dist´urbios. Al´em de operar continuamente durante os afunda-mentos de tens˜ao, alguns c´odigos de rede requerem ainda o fornecimento de potˆencia reativa para auxiliar na estabiliza¸c˜ao da rede.
Neste contexto, esse trabalho analisa o comportamento dos aerogeradores de indu¸c˜ao duplamente excitados (DFIG - “doubly-fed induction generator”) durante afundamentos de tens˜ao equilibrados e desequilibrados. Primeira-mente a an´alise ´e realizada atrav´es de equacionamentos matem´aticos no do-m´ınio do tempo e de Laplace que explicam o comportamento das principais vari´aveis envolvidas no processo bem como a influˆencia do ajuste do con-trole cl´assico em tais vari´aveis. Posteriormente resultados experimentais s˜ao utilizados para provar o desenvolvimento matem´atico e evidenciar o com-portamento do gerador e conversores. Tais resultados foram obtidos em duas bancadas de testes: uma de 4kW e outra de 25kW projetada e constru´ıda du-rante este trabalho. Resultados simulados em um modelo representativo de uma turbina de 2MW s˜ao tamb´em analisados para extrapolar os resultados obtidos nas bancadas de pequeno porte.
Os resultados obtidos para o controle cl´assico demonstram as fragilidades do sistema. A partir de tais resultados novas estrat´egias de controle a fim de melhorar a suportabilidade dessa tecnologia s˜ao propostas. O controle da corrente de magnetiza¸c˜ao do gerador ´e utilizado durante afundamentos equili-brados e para o caso desequilibrado este controle ´e utilizado em conjunto com controladores ressonantes. Tais estrat´egias s˜ao avaliadas atrav´es de simula-¸c˜ao e testes experimentais demonstrando-se a melhoria da suportabilidade durante os afundamentos momentˆaneos de tens˜ao.
As principais contribui¸c˜oes desse trabalho s˜ao a modelagem matem´atica no dom´ınio de Laplace, que permite avaliar o efeito dos controladores no comportamento do sistema durante os afundamentos de tens˜ao, e o desenvol-vimento de novas estrat´egias de controle para a melhoria da suportabilidade da tecnologia DFIG. Ademais, o desenvolvimento de uma bancada de 25kW ´e uma importante contribui¸c˜ao, pois apresentam-se resultados em potˆencia maior que os usualmente relatados na literatura, al´em de permitir outros estudos relacionados a esse tema.
Abstract
Due to the continuing growth of the installed power capacity of wind farms worldwide, the modern grid codes define specific requirements to the connection of wind turbines to the grid. One of these requirements is the ride-through fault capability, that is, the equipment capability of continuing operating during voltage sags. The grid codes require that, for some levels and duration of voltage sags, the equipment must not be disconnected from the grid and also supplies reactive power in order to contribute to network voltage stabilization.
In this context, the present work analyzes the behavior of the doubly-fed induction generator technology (DFIG) during balanced and unbalanced voltage sags. First, the analysis is developed based on a mathematical mo-deling in time and Laplace domains that explains the behavior of the main variables and highlight the effect of the classical control tunning on such va-riables. Then, the mathematical approach is proved through experimental results which evidence the behavior of the generator and converters. Such results were obtained in two test benches with rated power of 4kW and a 25kW which was projected and mounted during this work. Furthermore, si-mulation results of a representative model of a 2MW turbine are analyzed in order to extrapolate the conclusions made for the small scale test benches.
The results of the classical control show the system weak points. Based on these results novel control strategies are proposed to improve the DFIG ride-through fault capability. The control of the generator magnetizing cur-rent is used during symmetrical voltage sags whereas for the asymmetrical case this strategy is combined with resonant controllers. The strategies are evaluated using simulation and experimental results that demonstrate the improvement of the system ride-through fault capability.
The main contributions of this work are the mathematical modeling in the Laplace domain, which permits to evaluate the control effects on the system behavior during the voltage sags, and the proposal of novel control strategies to improve the system ride-through fault capability. Furthermore, the development of a 25kW test bench is a important contribution because results with higher power than the usually presented in the literature are presented and it will permit other studies related to this theme.
Table List
6.1 Percentage of unbalance and of oscillations for different simu-lated voltage sags (θ0 = 900). . . 153
B.1 Parameters of the generator of the TUD test bench. . . 222 B.2 Voltage sag parameters of the TUD test bench. . . 222 B.3 Controller gains of the TUD test bench. . . 223 B.4 Other parameters of the TUD test bench. . . 223
C.1 Parameters of the generator of the UFMG test bench. . . 224 C.2 Controller gains of the UFMG test bench. . . 225 C.3 Other parameters of the UFMG test bench. . . 225
D.1 Parameters of the generator used in the simulation model. . . 226 D.2 Controller gains of the simulation. . . 226 D.3 Other parameters of the simulation model. . . 227
Figure List
1.1 Total world installed capacity of WECS (Global Wind Energy Council, 2013). . . 3 1.2 Technologies of wind energy conversion systems (Blaabjerg
et al., 2006). (a) - Generator with direct connection to the grid; (b) - Generator with gearbox and full scale converter; (c) - Gearless generator with full-scale converter; (d) - Doubly-fed generator with partial converter power. . . 5 1.3 Active power flow in the DFIG technology as generator
(Ra-belo, 2009). (a) - Sub-synchronous speed operation; (b) -Super-synchronous speed operation. . . 6 1.4 Ride-through fault capability curve required in the Brazilian
grid code (ONS, 2009a). . . 8 1.5 Ride-through fault capability curve required by EON-Germany
grid code (E.ON, 2006). . . 9 1.6 The principle of voltage support in the event of grid fault
re-quired by EON-Germany grid code (E.ON, 2006). . . 9
2.1 DFIG drive topology (Blaabjerg et al., 2006). . . 20 2.2 LCL filter schematic circuit. . . 23 2.3 Block diagram representation of the GSC control structure. . . 25 2.4 PLL topology - PSOGI (Rodriguez et al., 2006). . . 26
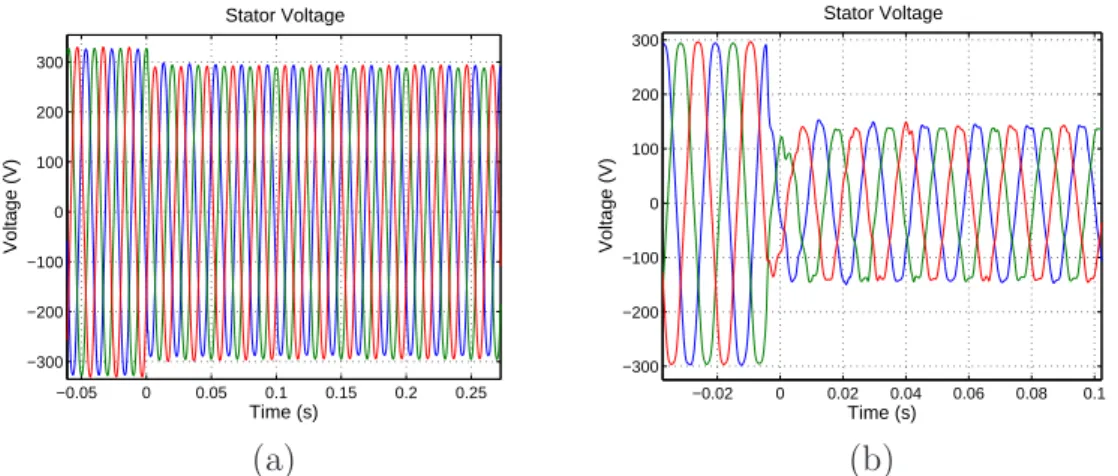
2.5 Block diagram representation of the RSC control structure. . . 27 2.6 Simulation model implemented in Simulink. . . 29 2.7 Diagram of the test benches that emulate DFIG systems. . . . 31 2.8 Picture of the TU Dresden test bench - 4kW system. . . 32 2.9 Picture of the UFMG test bench - 25kW system. . . 32 2.10 Schematic diagram of the ISG voltage sag generator. . . 33 2.11 Tolerance of voltage drop (IEC, 2008). . . 34 2.12 Experimental results of the stator voltage for three-phase
vol-tage sags: (a) - TUD test bench: 85%; (b) - UFMG test bench 50%. . . 34 2.13 Experimental results of the stator voltage for phase-phase
vol-tage sags: (a) - TUD test bench: 90%; (b) - UFMG test bench 50%. . . 35
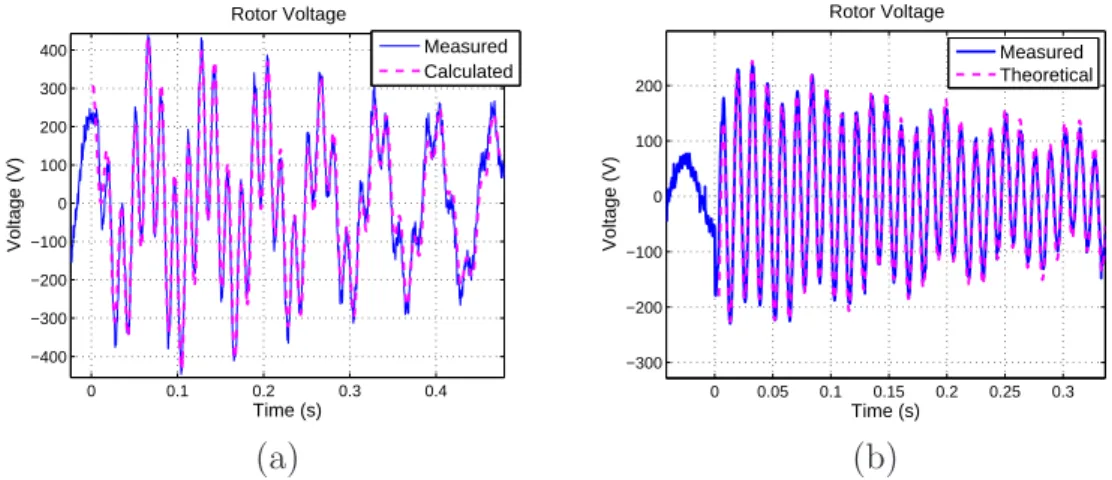
3.1 Complex plane representation of the stator flux linkage during a 50% three-phase voltage sag. . . 43 3.2 Comparison between the rotor voltages calculated and the
ex-perimental results in the TUD test bench: (a) - TUD test bench: 85% three-phase voltage sag, 1950 RPM; (b) - UFMG test bench: 50% three-phase voltage sag, 2340 RPM. . . 45 3.3 Rotor voltage components during the sag obtained through
Equations 3.27, 3.28 and 3.29 for: (a) - TUDb parameters (85% three-phase voltage sag, 1950 RPM); (b) - UFMGb pa-rameters (50% three-phase voltage sag, 2340 RPM). . . 45 3.4 Fourier analysis of the measured rotor voltage during the sag
for the TUDb(85% three-phase voltage sag, 1950 RPM). . . . 46 3.5 Experimental result of the maximum rotor voltage during
xxi 3.6 Comparison between the rotor voltage simulated and
calcula-ted with the parameters of the 2MW system (50% three-phase voltage sag, 1950 RPM). . . 49 3.7 Rotor voltage measured and calculated - TUDb (85%
three-phase voltage sag, 1300 RPM). . . 51 3.8 Block diagram representation of Equations 3.37, 3.38, 3.43 and
3.44. . . 53 3.9 Block diagram representation of the current control. . . 54 3.10 Rotor equivalent circuit. . . 54 3.11 Bode diagram of the PI controller (2MW WECS gains). . . 56 3.12 Direct axis stator flux linkage (2MW WECS, 50% three-phase
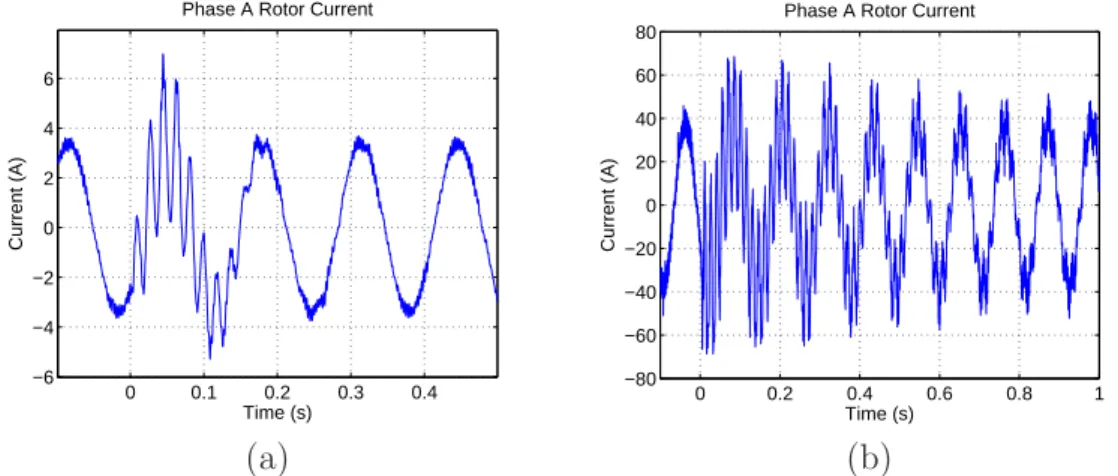
sag). . . 58 3.13 Experimental results of the phase A of the rotor currents at
synchronous speed: (a) - TUD test bench (85% three-phase voltage sag, 1500 RPM); (b) - UFMG test bench (50% three-phase voltage sag, 1800 RPM). . . 60 3.14 Fourier analysis of the phase A rotor current at synchronous
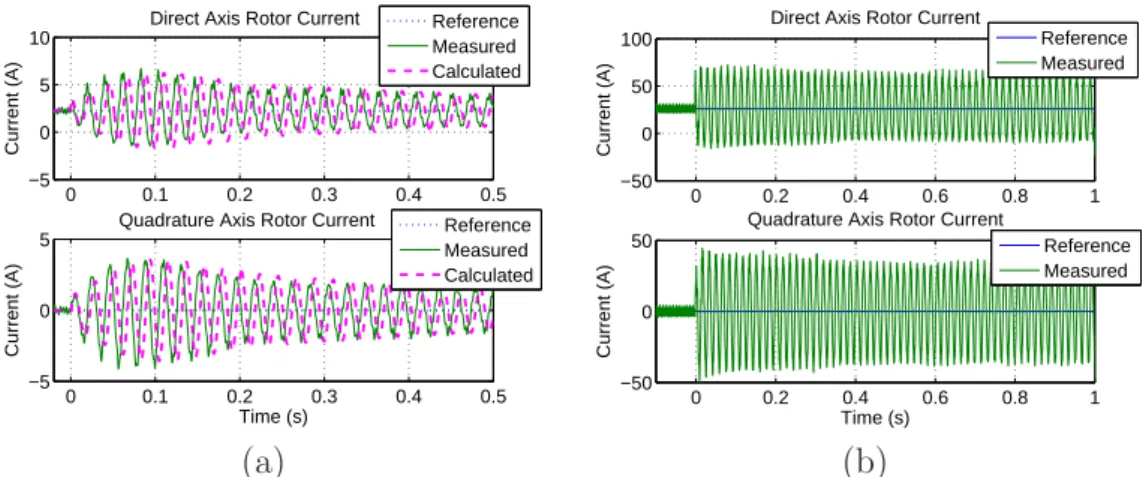
speed: (a) - TUD test bench (85% three-phase voltage sag, 1500 RPM); (b) - UFMG test bench (50% three-phase voltage sag, 1800 RPM). . . 61 3.15 Experimental results of the direct and quadrature axes of rotor
currents at synchronous speed test: (a) - TUD test bench (85% three-phase voltage sag, 1500 RPM); (b) - UFMG test bench (50% three-phase voltage sag, 1800 RPM). . . 62 3.16 Experimental results of the phase A of the rotor voltages at
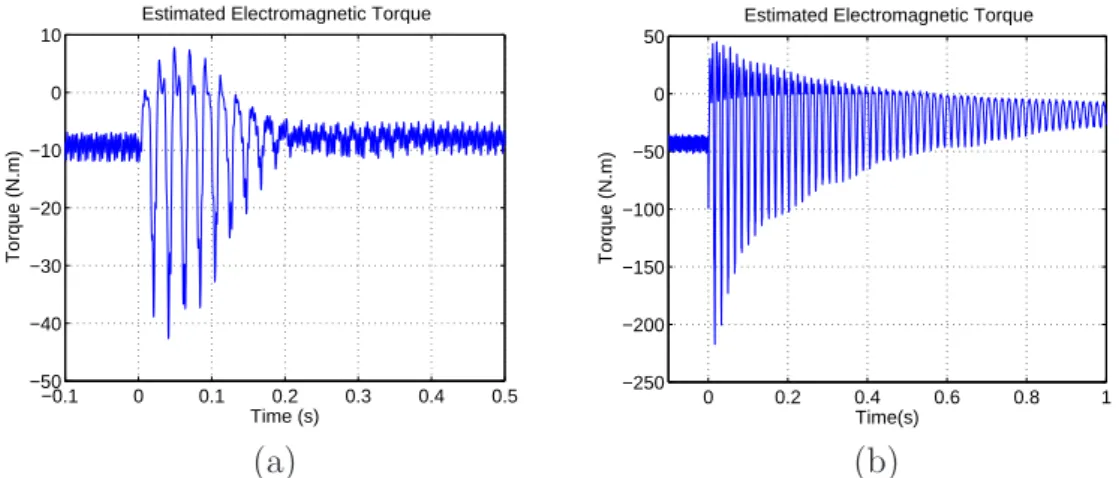
3.17 Experimental results of the phase A of the stator currents at synchronous speed test: (a) - TUD test bench (85% three-phase voltage sag, 1500 RPM); (b) - UFMG test bench (50% three-phase voltage sag, 1800 RPM). . . 64 3.18 Experimental results of the estimated electromagnetic torque
at synchronous speed test: (a) - TUD test bench (85% three-phase voltage sag, 1500 RPM); (b) - UFMG test bench (50% three-phase voltage sag, 1800 RPM). . . 64 3.19 Experimental results of the estimated active and reactive powers
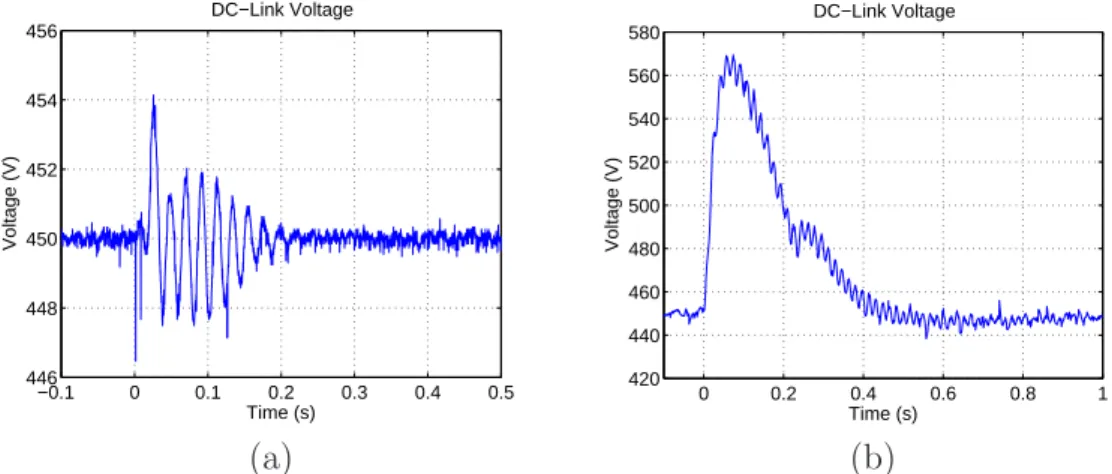
at synchronous speed test: (a) - TUD test bench (85% three-phase voltage sag, 1500 RPM); (b) - UFMG test bench (50% three-phase voltage sag, 1800 RPM). . . 65 3.20 Experimental results of the DC-link voltage at synchronous
speed test: (a) - TUD test bench (85% three-phase voltage sag, 1500 RPM); (b) - UFMG test bench (50% three-phase voltage sag, 1800 RPM). . . 65 3.21 Experimental results of the dq GSC currents at synchronous
speed test: (a) - TUD test bench (85% three-phase voltage sag, 1500 RPM); (b) - UFMG test bench (50% three-phase voltage sag, 1800 RPM). . . 66 3.22 Experimental results of the dq rotor currents at synchronous
speed test with modified gains: (a) - TUD test bench (85% three-phase voltage sag, 1500 RPM); (b) - UFMG test bench (50% three-phase voltage sag, 1800 RPM). . . 67 3.23 Experimental results of the phase A of the rotor voltages at
synchronous speed test with modified gains: (a) - TUD test bench (85% three-phase voltage sag, 1500 RPM); (b) - UFMG test bench (50% three-phase voltage sag, 1800 RPM). . . 67 3.24 Experimental result of the phase A of the rotor currents for
xxiii 3.25 Fourier analysis of the rotor currents for slip=+0.15: (a)
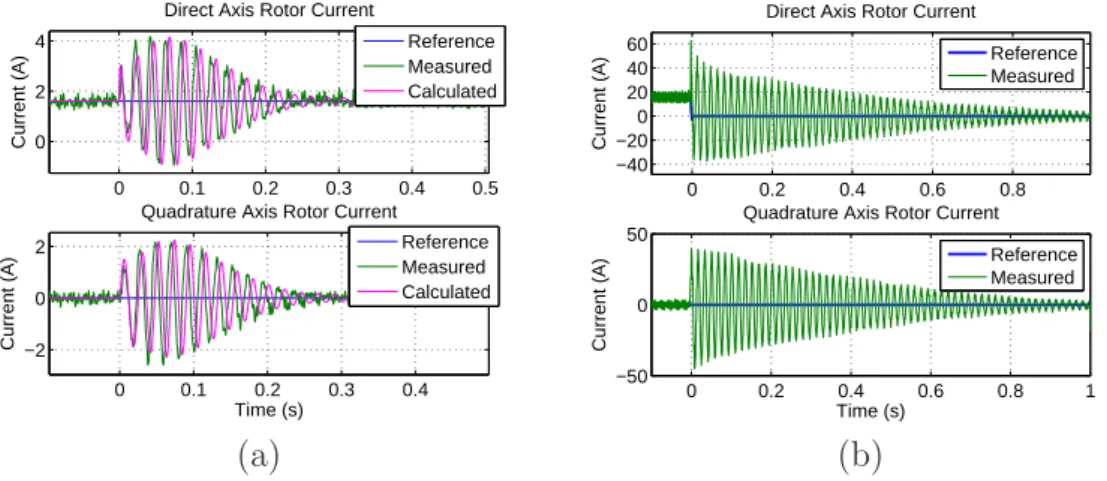
-TUD test bench (85% three-phase voltage sag, 1275 RPM); (b) - UFMG test bench (50% three-phase voltage sag, 1530 RPM). . . 69 3.26 Experimental result of the dq rotor currents for slip=+0.15:
(a) - TUD test bench (85% three-phase voltage sag, 1275 RPM); (b) - UFMG test bench (50% three-phase voltage sag, 1530 RPM). . . 69 3.27 Experimental result of the phase A of the rotor currents for
slip=-0.15: (a) - TUD test bench (85% three-phase voltage sag, 1725 RPM); (b) - UFMG test bench (80% three-phase voltage sag, 2070 RPM). . . 70 3.28 Experimental result of the phase A of the rotor voltages for
slip=-0.15: (a) - TUD test bench (85% three-phase voltage sag, 1725 RPM); (b) - UFMG test bench (80% three-phase voltage sag, 2070 RPM). . . 70 3.29 Experimental result of the TUDb, 1725 RPM, Vdc = 200V:
(a) - Rotor currents; (b) - Rotor Voltages. . . 71 3.30 Experimental result of the TUDb, 1725 RPM, Vdc = 170V:
(a) - Rotor currents; (b) - Rotor Voltages. . . 72 3.31 Maximum rotor currents: (a) - TUD test bench (85%
three-phase voltage sag); (b) - UFMG test bench. . . 73 3.32 Simulation results of the dq rotor currents (1950 RPM, Kp =
0.26Ω and Ki = 1.36Ω/s). . . 74
3.33 Simulation results of the dq rotor currents (1950 RPM, Kp =
0.053Ω and Ki = 0.27Ω/s). . . 75
3.34 Simulation results of the dq rotor currents (1950 RPM, Kp =
0.26Ω and Ki = 1.36Ω/s). . . 75
4.1 Stator flux linkage during a 50% phase-neutral voltage sag in the complex plane: (a) -θ0 = 900 - no natural component; (b)
4.2 Open rotor experimental result for the TUDb with 90% phase-phase voltage sag, θ0 = 900 and 1950 RPM: (a) - Phase A of
the rotor voltages; (b) - Fourier analysis of the rotor voltages. . 82 4.3 Open rotor experimental result for the TUDb with 90%
phase-phase voltage sag, θ0 = 00 and 1950 RPM: (a) - Phase A of
the rotor voltages; (b) - Fourier analysis of the rotor voltages. . 82 4.4 Open rotor experimental result for the UFMGb with 50%
phase-phase voltage sag,θ0 = 900 and 2340 RPM: (a) - Phase
A of the rotor voltages; (b) - Fourier analysis of the rotor vol-tages. . . 83 4.5 Open rotor experimental result for the UFMGb with 90%
phase-phase voltage sag,θ0 = 00and 2340 RPM: (a) - Phase A
of the rotor voltages; (b) - Fourier analysis of the rotor voltages. 83 4.6 Maximum experimental and theoretical rotor voltage in the
UFMGb for different phase-to-phase voltage sags in the case without natural component (θ0 = 900). . . 85
4.7 Maximum experimental and theoretical rotor voltage in the UFMGb for different phase-to-phase voltage sags in the case with the maximum natural component (θ0 = 00). . . 86
4.8 Simulated result of the stator voltage sequence components in different reference frames. . . 91 4.9 Bode diagram of the transfer functions in Equation 4.43 -
di-rect voltage (continuous line) and quadrature voltage (dashed line). Parameters of the 2-MW system. . . 93 4.10 Bode diagram of the transfer functions 4.47 for different
con-troller gains with the 2-MW system parameters. . . 95 4.11 Experimental results of the phase A of the rotor currents for
a slip = -0.15, θ0 = 00: (a) - TUD test bench (90%
xxv 4.12 Fourier analysis of the rotor currents for a slip = -0.15,θ0 = 00:
(a) - TUD test bench (90% phase-to-phase voltage sag, 1725 RPM); (b) - UFMG test bench (65% phase-to-phase voltage sag, 2070 RPM). . . 97 4.13 Experimental result of the dq rotor currents for a slip = -0.15,
θ0 = 00: (a) - TUD test bench (90% phase-to-phase voltage
sag, 1725 RPM); (b) - UFMG test bench (65% phase-to-phase voltage sag, 2070 RPM). . . 97 4.14 Experimental results of the phase A of the rotor voltages for
a slip = -0.15, θ0 = 00: (a) - TUD test bench (90%
phase-to-phase voltage sag, 1725 RPM); (b) - UFMG test bench (65% phase-to-phase voltage sag, 2070 RPM). . . 98 4.15 Experimental result of the estimated electromagnetic torque
for a slip = -0.15, θ0 = 00: (a) - TUD test bench (90%
phase-to-phase voltage sag, 1725 RPM); (b) - UFMG test bench (65% phase-to-phase voltage sag, 2070 RPM). . . 99 4.16 Experimental result of the active and reactive powers for a
slip = -0.15, θ0 = 00: (a) - TUD test bench (90%
phase-to-phase voltage sag, 1725 RPM); (b) - UFMG test bench (65% phase-to-phase voltage sag, 2070 RPM). . . 99 4.17 Experimental results of the DC-link voltage for a slip = -0.15,
θ0 = 00: (a) - TUD test bench (90% phase-to-phase voltage
sag, 1725 RPM); (b) - UFMG test bench (65% phase-to-phase voltage sag, 2070 RPM). . . 100 4.18 Experimental results of the dq GSC currents for slip = -0.15,
θ0 = 00: (a) - TUD test bench (90% phase-to-phase voltage
sag, 1725 RPM); (b) - UFMG test bench (65% phase-to-phase voltage sag, 2070 RPM). . . 100 4.19 Experimental results of the phase A of the rotor currents for
a slip = +0.3, θ0 = 900: (a) - TUD test bench (90%
4.20 Fourier analysis of the rotor current for a slip = +0.3,θ0 = 900:
(a) - TUD test bench (90% phase-to-phase voltage sag, 1050 RPM); (b) - UFMG test bench (65% phase-to-phase voltage sag, 1260 RPM). . . 102 4.21 Experimental results of the dq rotor currents for a slip = +0.3,
θ0 = 900: (a) - TUD test bench (90% phase-to-phase voltage
sag, 1050 RPM); (b) - UFMG test bench (65% phase-to-phase voltage sag, 1260 RPM). . . 102 4.22 Experimental results of the phase A of the rotor currents at
synchronous speed,θ0 = 00: (a) - TUD test bench (90%
phase-to-phase voltage sag, 1500 RPM); (b) - UFMG test bench (65% phase-to-phase voltage sag, 1800 RPM). . . 103 4.23 Fourier analysis of the rotor current at synchronous speed,
θ0 = 00: (a) - TUD test bench (90% phase-to-phase voltage
sag, 1500 RPM); (b) - UFMG test bench (65% phase-to-phase voltage sag, 1800 RPM). . . 103 4.24 Experimental result of the maximum rotor currents for
dif-ferent speeds and voltage sags: θ0 = 900: (a) - no natural
componentθ0 = 900; (b) - maximum natural componentθ0 = 00.104
4.25 Experimental result of the maximum rotor voltages for dif-ferent speeds and voltage sags: θ0 = 900: (a) - no natural
componentθ0 = 900; (b) - maximum natural componentθ0 = 00.105
4.26 Simulation result of the dq rotor currents, 1950 RPM, 50% phase-neutral voltage sag: (a) -θ0 = 900 - no natural
compo-nent; (b) - θ0 = 00 - maximum natural component. . . 107
4.27 Simulation result of the dq rotor currents, 1950 RPM, 50% phase-neutral voltage sag, recovering instant: (a) - no natural component; (b) - maximum natural component. . . 107
xxvii 5.2 Simulation and theoretical results of the dq stator flux linkage,
50% three-phase voltage sag, 1950 RPM: (a) - Without the MCC strategy ; (b) - With the MCC strategy -Kpim = 15. . . 116
5.3 dq rotor currents simulated for a 50% three-phase voltage sag, rated power (no reactive power control). . . 117 5.4 dq rotor currents simulated for a 50% three-phase voltage sag,
rated power (no reactive power control): (a) - Without the magnetizing current control; (b) - With the magnetizing cur-rent control. . . 118 5.5 Simulation results for 50% three-phase voltage sag, rated power,
using the MCC strategy and reactive power control: (a) - dq rotor currents; (b) - Stator active and reactive powers. . . 118 5.6 Comparison between the rotor voltages with and without the
MCC strategy - simulation result. . . 120 5.7 Rotor voltage calculated and simulated for different voltage
sags and speeds using the MCC strategy - Kpim = 15. . . 121
5.8 Rotor currents simulated for different voltage sags and speeds (MCC strategy). . . 122 5.9 Time constant of the stator flux linkage decay varying the
magnetizing current control gain - 2MW parameters. . . 123 5.10 Maximum rotor current simulated for different voltage sags
and varying the magnetizing current control gain. . . 123 5.11 Maximum rotor voltage simulated for different voltage sags
and varying the magnetizing current control gain. . . 124 5.12 Experimental results of the estimated dq stator fluxes using
the MCC strategy: (a) - TUD test bench - Kpim = 4 (85%
three-phase voltage sag, 1500 RPM,Kp = 100Ω,Ki = 10000Ω/s);
(b) - UFMG test bench -Kpim = 2.5 (50% three-phase voltage
5.13 Experimental results of the dq rotor currents using the MCC strategy: (a) - TUD test bench - Kpim = 4 (85% three-phase
voltage sag, 1500 RPM, Kp = 100Ω, Ki = 10000Ω/s); (b)
-UFMG test bench -Kpim = 2.5 (50% three-phase voltage sag,
1800 RPM). . . 126
5.14 Experimental results of the dq rotor voltages using the MCC strategy: (a) - TUD test bench - Kpim = 4 (85% three-phase
voltage sag, 1500 RPM, Kp = 100Ω, Ki = 10000Ω/s); (b)
-UFMG test bench -Kpim = 2.5 (50% three-phase voltage sag,
1800 RPM). . . 127
5.15 Experimental results of the dq rotor currents using the MCC strategy: (a) - TUD test bench - Kpim = 4 (85% three-phase
voltage sag, 1750 RPM, Kp = 100Ω, Ki = 10000Ω/s); (b)
-UFMG test bench -Kpim = 2.5 (50% three-phase voltage sag,
2070 RPM). . . 128
5.16 Experimental results of the estimated dq stator fluxes using the MCC strategy: (a) - TUD test bench - Kpim = 4 (85%
three-phase voltage sag, 1750 RPM,Kp = 100Ω,Ki = 10000Ω/s);
(b) - UFMG test bench -Kpim = 2.5 (50% three-phase voltage
sag, 2070 RPM). . . 128
5.17 Experimental results of the dq rotor currents using the MCC strategy and reactive power control: (a) TUD test bench
-Kpim = 4 (85% three-phase voltage sag, 1800 RPM, Kp =
100Ω, Ki = 10000Ω/s); (b) - UFMG test bench - Kpim = 2.5
(50% three-phase voltage sag, 1530 RPM). . . 129
5.18 Experimental results of the dq rotor voltages using the MCC strategy and reactive power control: (a) TUD test bench
-Kpim = 4 (85% three-phase voltage sag, 1800 RPM, Kp =
100Ω, Ki = 10000Ω/s); (b) - UFMG test bench - Kpim = 2.5
xxix 5.19 Experimental results of the active and reactive stator powers
using the MCC strategy and reactive power control: (a) - TUD test bench - Kpim = 4 (85% three-phase voltage sag, 1800
RPM, Kp = 100Ω,Ki = 10000Ω/s); (b) UFMG test bench
-Kpim = 2.5 (50% three-phase voltage sag, 1530 RPM). . . 130
6.1 Control of RSC with the strategy of compensating the torque and reactive power oscillations. . . 134 6.2 Simulation result of the electromagnetic torque with and without
the CTRP strategy (80% phase-neutral voltage sag, θ0 = 900
and 1950 RPM). . . 136 6.3 Stator active and reactive powers with and without the CTRP
strategy (80% phase-neutral voltage sag, θ0 = 900 and 1950
RPM). . . 136 6.4 Simulation results of the ABC rotor currents (80%
phase-neutral voltage sag, θ0 = 900 and 1950 RPM): (a) - Without
the CTRP strategy; (b) - With the CTRP strategy. . . 137 6.5 Simulation result of the ABC rotor voltages with the CTRP
strategy (80% phase-neutral voltage sag, θ0 = 900 and 1950
RPM). . . 138 6.6 Simulation result of the electromagnetic torque with the CTRP
strategy (80% phase-neutral voltage sag, θ0 = 00 and 1950
RPM). . . 138 6.7 Simulation results of the ABC rotor currents (80%
phase-neutral voltage sag, θ0 = 00 and 1950 RPM): (a) - Without
the CTRP strategy; (b) - With the CTRP strategy. . . 139 6.8 Simulation result of the electromagnetic torque with the CTRP+MCC
strategy (80% phase-neutral voltage sag, θ0 = 00 and 1950
6.11 Simulation results of the phase A of the rotor currents (50% phase-neutral voltage sag, θ0 = 900 and 1950 RPM): (a)
-Without RTFC strategies; (b) - With the DPIC-Target I stra-tegy. . . 154 6.12 Simulation results of the phase A of the rotor voltages (50%
phase-neutral voltage sag, θ0 = 900 and 1950 RPM): (a)
-Without RTFC strategies; (b) - With the DPIC-Target I stra-tegy. . . 155 6.13 Simulation results of the ABC stator currents (50%
phase-neutral voltage sag, θ0 = 900 and 1950 RPM): (a) - Without
RTFC strategies; (b) - With the DPIC-Target II strategy. . . . 156 6.14 Simulation results of the stator active and reactive powers
(50% phase-neutral voltage sag, θ0 = 900 and 1950 RPM):
(a) - Without RTFC strategies; (b) - With the DPIC-Target III strategy. . . 156 6.15 Simulation results of the electromagnetic torque (50%
phase-neutral voltage sag, θ0 = 900 and 1950 RPM): (a) - Without
RTFC strategies; (b) - With the DPIC-Target IV strategy. . . 157 6.16 Simulation results of the total active and reactive powers (50%
phase-neutral voltage sag,θ0 = 900and 1950 RPM): (a) - With
the DPIC-Target IV strategy; (b) - With the DPIC-Target IV
+ GSC control strategy. . . 157 6.17 Simulation results with DPIC-Target IV (50% phase-neutral
voltage sag, θ0 = 00 and 1950 RPM): (a) - Positive sequence
rotor current; (b) - Negative sequence rotor current; (c) - Phase A of the rotor currents; (d) - Phase A of the rotor voltages; (e) - Total active and reactive powers; (f) - Electromagnetic Torque. . . 159 6.18 Maximum calculated rotor voltage with DPIC-Target IV
stra-tegy for different unbalanced voltage sags, using the 2MW WECS parameters (θ0 = 900). . . 161
xxxi 6.20 Experimental result of the total dq rotor currents - TUDb
(90% phase-to-phase voltage sag, θ0 = 900 and 1750RPM):
(a) - Without the RTFC strategies; (b) - With DPIC-Target I
strategy. . . 164
6.21 Experimental result of the phase A of the rotor voltages -TUDb (90% phase-to-phase voltage sag,θ0 = 900and 1750RPM):
(a) - Without the RTFC strategies; (b) - With DPIC-Target I
strategy. . . 165
6.22 Experimental result of the ABC stator currents - TUDb (90% phase-to-phase voltage sag, θ0 = 900 and 1750RPM): (a)
-Without the RTFC strategies; (b) - With DPIC-Target II stra-tegy. . . 165
6.23 Experimental result of the estimated electromagnetic torque -TUDb (90% phase-to-phase voltage sag,θ0 = 900and 1750RPM):
(a) - Without the RTFC strategies; (b) - With DPIC-Target IV strategy. . . 166
6.24 Experimental result of the total active and reactive powers -TUDb (90% phase-to-phase voltage sag, θ0 = 900 and 1750
RPM): (a) - Without the RTFC strategies; (b) - With
DPIC-Target IV + GSC control strategy. . . 166
6.25 Experimental result of the total dq rotor currents - TUDb (90% phase-to-phase voltage sag, θ0 = 00 and 1750 RPM):
(a) - Without the RTFC strategies; (b) - With DPIC-Target I
strategy. . . 167
6.26 Control of the RSC using the resonant control. . . 169
6.27 Control of the GSC using the resonant control . . . 170
6.29 Simulation results using PIRC-Target I strategy (50% phase-neutral voltage sag, θ0 = 900 and 1950 RPM): (a) - Positive
sequence rotor current; (b) - Negative sequence rotor current; (c) - Phase A of the rotor currents; (d) - Phase A of the rotor voltages. . . 175 6.30 Simulation results using PIRC-Target IV + GSC control
stra-tegy (50% phase-neutral voltage sag,θ0 = 900and 1950 RPM):
(a) - Total dq rotor currents; (b) - Electromagnetic Torque; (c) - Total dq GSC currents; (d) - Total active and reactive powers; 176 6.31 Simulation results using PIRC-Target IV strategy (50%
phase-neutral voltage sag, θ0 = 00 and 1950 RPM): (a) - Positive
sequence rotor current; (b) - Negative sequence rotor current; (c) - Total dq rotor currents; (d) - Electromagnetic Torque. . . 177 6.32 Simulation results using EPIRC-Target IV strategy (50%
phase-neutral voltage sag, θ0 = 00 and 1950 RPM): (a) - Positive
sequence rotor current; (b) - Negative sequence rotor current; (c) - Phase A of the rotor currents; (d) - Electromagnetic torque.180 6.33 Experimental results using EPIRC-Target I strategy for a 50%
phase-to-phase voltage sag,θ0 = 00 and 2340RPM - UFMGb:
(a) - Total dq rotor currents; (b) - ABC rotor currents; (c) -Electromagnetic Torque; (d) - Phase A of the rotor voltages. Straight line - voltage limits. . . 181 6.34 Experimental results for different voltage phase-to-phase
vol-tage sags with maximum natural component (θ0 = 00) and
varying the speed - UFMGb: (a) - Maximum rotor voltages; (b) - Maximum rotor currents. . . 182 6.35 Resonant control + Magnetizing current control (RMCC). . . 184 6.36 Simulation results using EPIRC and the RMCC - Target IV
strategy (50% phase-neutral voltage sag, θ0 = 00 and 1950
xxxiii 6.37 Experimental results using RMCC - Target I strategy for a
50% phase-to-phase voltage sag, θ0 = 00 and 2070RPM
-UFMGb: (a) - dq rotor currents; (b) - ABC rotor currents; (c) - Phase A of the rotor voltages; (d) - Electromagnetic torque.186
A.1 Graphical representation of Clark and Park Transforms. . . 206 A.2 Block diagram of the GSC current control. . . 210 A.3 Schematic diagram of the DC-link. . . 212 A.4 Block diagram representing the DC-link voltage control loop. . 213 A.5 Block diagram representation of the GSC reactive power control.214 A.6 Vector diagram of the grid voltage and stator flux: (a) -
Vir-tual flux orientation; (b) - Stator flux orientation. . . 215 A.7 Stator or grid voltage orientation. . . 216 A.8 Block diagram representation of the rotor currents control
structure. . . 218 A.9 Block diagram representation of the stator active power
con-trol structure. . . 220 A.10 Block diagram representation of the stator reactive power
Symbol List
Superscript
∗ Reference values
r Variable referred to the rotor
g Variable in the synchronous reference frame
→ Vector
+ Positive Synchronous Reference Frame
− Negative Synchronous Reference Frame b Complex Conjugate
Subscript
d Variable referred to the direct axis
q Variable referred to the quadrature axis
f Forced Component
n Natural Component
+ Positive Sequence Component
− Negative Sequence Component 0 Zero Sequence Component
Variables
λotm Optimum Speed Relation
ψs Stator Flux Linkage
ψsv Grid Virtual Flux ψr Rotor Flux Linkage
ηg Generator Efficiency
θ Rotor Electrical Position ˆ
θN Grid Voltage Angle
θr Rotor Voltages and Currents Angle
θ0 Stator Voltage Angle in the Sag Beginning τa Converter Time Constant
τs Stator Time Constant
ω Electrical Rotor Speed (rad/s)
ωm Mechanical Rotor Speed (rad/s)
ωN Grid Voltage Angular Frequency (rad/s)
ωs Stator Voltages and Currents Angular Frequency (rad/s)
ωr Stator Voltages and Currents Angular Frequency (rad/s)
A Generic Variable
Cpmax Maximum Turbine Power Coefficient
Cf Filter Capacitance
f Electrical Rotor Speed (Hz)
fm Mechanical Rotor Speed (Hz)
fN Grid Voltage Frequency (Hz)
fs Stator Voltages and Currents Frequency (Hz)
fr Stator Voltages and Currents Frequency (Hz)
in Filter Current
is Stator Current
ir Rotor Current
J Inertia
Ki Integral Gain
Kp Proportional Gain
Kr Resonant Gain
Kpim Proportional Gain of the Magnetizing Current Controller
Ksr Stator and Rotor Turns Ratio
L1 Inductance of the Parallel Inductor in the VSG L2 Inductance of the Series Inductor in the VSG Lf Filter Inductance
Lm Magnetizing Inductance
Ls Stator Self Inductance
Lr Rotor Self Inductance
Lσs Stator Leakage Inductance
xxxvii
P Pole Pairs
Pe Electromagnetic Power
Ps Stator Active Power
Q Band-pass Filter Selectivity
Qn GSC Reactive Power
Qs Stator Reactive Power
R1 Equivalent Resistance in the VSG Rf Filter Resistance
Rs Stator Resistance
Rr Rotor Resistance
slip Slip
Ss Stator Apparent Power
Td Converter Dead Time
Te Electromagnetic Torque
TfQn Time Constant of the GSC Reactive Power Filter
TfPs Time Constant of the Stator Active Power Filter
TfQs Time Constant of the Stator Reactive Power Filter
Ti Integrative Control Time Constant
Tmec Mechanical Torque
Tmec Electromagnetic Torque
Ts Sampling Time
vn Grid Side Converter Voltage
vN Grid Voltage
vs Stator Voltage
vr Rotor Voltage
Abbreviation List
CNF Compensation of the Natural Stator Flux Linkage CNV Compensation of the Natural Rotor Voltage
CTRP Compensation of Torque and Reactive Power Pulsations DFIG Doubly-Fed Induction Generator
DPIC Dual PI Controllers EMF Back Electromotive Force GSC Grid Side Converter
IGBT Insulated Gate Bipolar Transistor INV Inverter
IPC Industrial Power Corruptor ISG Impedance Sag Generator
LCCE Laboratory of Energy Conversion and Control “Laborat´orio de Controle e Convers˜ao de Energia”
MCC Magnetizing Current Control
MO Modulus Optimum
MPPT Maximum Power Point Tracking
MVS Momentary Voltage Sag
ONS National Electric System Operator
“Operador Nacional do Sistema El´etrico”
PI Proportional-Integral Controller
PIRC Proportional-Integral Plus Resonant Controller
PLL Phase-Locked Loop
PSOGI PLL with Dual Second Order Generalized Integrators
PWM Pulse Width Modulation
RMCC Resonant Control + Magnetizing Current Control RSC Rotor Side Converter
RTFC Ride-through Fault Capability
SO Symmetrical Optimum
SVPWM Space Vector Pulse Width Modulation TUD “Technische Universit¨at Dresden”
TUDb TUD test bench
UFMG Federal University of Minas Gerais
UFMGb UFMG test bench
VSG Voltage Sag Generator
Chapter 1
Introduction
1.1
Brief History of Wind Energy
Mankind has used the wind energy for thousands of years. Archaeological studies point out that the wind energy is employed since the beginning of the Modern Era (Heier, 2005). In the 10th century, windmills were used in Persia which were brought by the Crusaders to Europe where the technology was changed and widespread. These windmills have been used to grind grains and to pump water.
In the United States, in the 19th century, windpumps were extensively used on farms and ranches and they are still used nowadays. These mills feature a large number of blades so that they turn slowly with considerable torque in low winds and are self regulating in high winds (Clements, 2003).
The first wind turbines with aerodynamic blades constructed to produce electrical energy were introduced in the mid-twentieth century. Just in the 1950s, a German developed the first high power turbine (Heier, 2005). The grid connected wind power plants is only 25 to 30 years old (Rasmussen and Jørgensen, 2005).
con-version systems (WECS) have evolved, mainly because the development of power electronics. Nowadays there exist multi-megawatts turbines with high efficiency, operating with variable speed, thus, allowing maximum wind power extraction. They are connected to the grid using power converters that are also used to supply the reactive power needed by the grid. As it will be seen hereafter, the increase of the wind power plants connected to the grid leads the system operators to develop specific grid code requirements for this technology.
1.2
Overview of Wind Energy Nowadays
In recent years, the entire society has become increasingly concerned over the global warming and other environmental issues caused by the use of polluting energy sources like petroleum, coal, gas, etc. Thereby, the govern-ments and companies have invested in alternative energy sources like solar, wind, biomass, etc.
The environmental impact of using WECS compared with the traditio-nal energy sources is relatively small. During the operation, wind turbines cause virtually no emissions and very little during their manufacture, installa-tion and removal (European Wind Energy Associainstalla-tion - EWEA, 2009). The environmental benefits associated with the generation of electricity from re-newable energy, including wind power, can be quantified in economic terms in the so-called “external costs” that include effects on human health, da-mage to the environment, loss of amenity as well as economic effects such as payment of subsidies and employment benefits. The most detailed analysis of external costs has been carried out through the European Commission’s ExternE project that values the external costs of wind energy at less than 0.26 euro-cents/kWh whilst those for coal-fired generation range from 2 to 15 euro-cents/kWh (European Wind Energy Association - EWEA, 2009).
1.3 Technologies of Wind Energy Conversion Systems 3
with an average value of R$99.58/MWh, value below the average price of thermal power plants using gas (R$103.26/MWh), and the expansion of the Jirau hydroelectric power plant (R$102.00/MWh) (Instituto Acende Brasil, 2011). In the auction A-5, occurred in December 2012, the average price of small hydroelectric power plant was R$93.46/MWh, while for wind energy this prices was R$87.94/MWh (Instituto Acende Brasil, 2012), confirming the continuous price decreasing.
Being a renewable, not-pollutant and cost-effective energy source, the number of wind power plants worldwide has increased so fast, as it can be seen in Figure 1.1.Brazil is one of the countries with the highest growth rates of installed wind power capacity. The country has now almost 1.96 GW of wind farms in operation (ANEEL, 2012). This number is so small when compared with other countries, but the investments are growing and so is the number of power plants.
Figure 1.1: Total world installed capacity of WECS (Global Wind Energy Council, 2013).
1.3
Technologies of Wind Energy Conversion
Systems
There exist different WECS technologies that differ in the generator te-chnology, the mechanical connection with the turbine and the electric con-nection to the grid. Next, the most common topologies, depicted in Figure 1.2, are listed and shortly explained:
2006). Generally it is used a squirrel cage induction generator connec-ted to the wind turbine using a gearbox. It is basically a fixed speed technology, because of the absence of converters, thus the efficiency of wind power extraction is low. For reactive power compensation, capa-citors are used. It is also common the use of a induction machine with two speeds (different number of poles), permitting a discrete change in the speed;
• Topology with generator connected to the grid using full-scale converter (Jamil et al., 2012). The converter permits the control of active and reactive power, allowing variable speed operation and, thus, the ability of maximum wind energy extraction. Normally synchronous machines with or without a gearbox are used. In the case without gearbox, called gearless technology, the synchronous generator can be externally excited or permanent magnets can be employed;
• Topology with doubly-fed (wound rotor) induction generator (Pena et al., 1996). This is also a variable speed technology, but the con-verter is dimensioned just for a parcel of the rated power. As this system is the object of the present work, it is better described in this section and in the next chapter.
WECS using doubly-fed induction generators (DFIG) are one of the most commercialized topologies over the world. This technology consists of a wound rotor induction generator with the stator connected to the grid and the rotor supplied by a back-to-back converter, as depicted in Figure 1.2(d). Its main advantage is the use of converters dimensioned for a parcel of the generator rated power (normally 30%), so the equipment costs are reduced. This is a variable speed technology where the generator speed is controlled normally in the range of±30%, permitting the extraction of maximum wind power.
1.3 Technologies of Wind Energy Conversion Systems 5
(a)
(b)
(c)
(d)
Figure 1.2: Technologies of wind energy conversion systems (Blaabjerg et al., 2006).
(a) - Generator with direct connection to the grid; (b) - Generator with gearbox and full scale converter; (c) - Gearless generator with full-scale converter;
(a)
(b)
Figure 1.3: Active power flow in the DFIG technology as generator (Rabelo, 2009). (a) - Sub-synchronous speed operation;
(b) - Super-synchronous speed operation.
Nevertheless the advantages of the DFIG, due to the direct connection of the generator stator to the grid, it is more susceptible to grid disturbances than technologies which use full-scale converters. During voltage sags, over-voltages and over-currents are induced in the rotor circuit which may damage the converter (Mendes, 2009), (L´opez et al., 2008a), (L´opez et al., 2008b), (de Ara´ujo Lima, 2009), (Oliveira, 2009).
In the next chapter more details about the DFIG operation are presented and the classical control strategy is briefly described.
1.4
Voltage Sags
1.4 Voltage Sags 7
voltage sags and develops strategies to improve the system response during this kind of disturbance.
According to the Brazilian national grid code (PROREDE) a momen-tary voltage sag (MVS), phenomena analyzed in this work, is defined as an event in which the RMS voltage value is between 0.1 and 0.9pu and the du-ration is greater than 1 cycle (60 Hz = 16.67ms) and minor than 3 seconds (ONS, 2009b). Events with voltage below 0.1pu are characterized as voltage interruptions, whereas events with duration between 3 seconds and 1 minute are called temporary voltage sags. These events together with different ty-pes of voltage elevation are classified as the short duration voltage variation phenomena.
The MVS may be caused by grid faults (short-circuits), overload or direct starting of high power machines (Bollen, 2000). They are classified as phase-phase, phase-to-ground, phase-phase-to-ground or three-phase depending on the number of phases affected. The latter is a balanced or symmetrical voltage sag, whereas the others are unbalanced or asymmetrical voltage sags. The faults may occur hundreds of kilometers from the connection point of the wind farm, therefore the MVS is a common phenomena that the system has to deal with. Depending on the fault characteristics and the point of occurrence, the voltage can drop abruptly and present slower recovering. In a faulty condition, it is also possible the occurrence of phase angle jumps in the instantaneous voltage.
The international standard IEC 61400-21 (IEC, 2008) specifies measu-rement and assessment of power quality characteristics of grid connected wind turbines, including questions related to the WECS behavior during voltage sags. The standard recommends the MVS tests characteristics and also presents the requirements of the voltage sag generator used to test the equipment.
1.5
Motivation and Objectives
With the higher penetration of wind power plants in the interconnected electrical system, power system operators have developed grid codes with specific requirements for regulating the connection of wind power plants to the electrical network (Erlich and Bachmann, 2005). One of these is the system ride-through fault capability (RTFC), i.e., the ability of the power plant to remain connected to the grid during voltage sags.
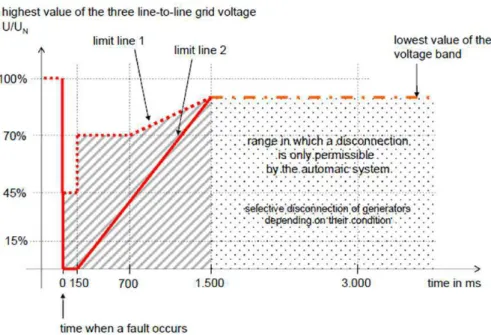
Figure 1.4 shows the RTFC curve required by the Brazilian grid code (ONS, 2009a) for balanced and unbalanced voltage sags. The vertical axis is the per unit remaining voltage in the common point of connection of the wind farm and the horizontal axis is the sag duration. The hatched area denotes the sag amplitude and duration characteristics for which the WECS must not be disconnected from the grid.
Figure 1.4: Ride-through fault capability curve required in the Brazilian grid code (ONS, 2009a).
1.5 Motivation and Objectives 9
Figure 1.5: Ride-through fault capability curve required by EON-Germany grid code (E.ON, 2006).
In this context, the present work intends to scrutinize the DFIG beha-vior during symmetrical and asymmetrical voltage sags using a mathematical modeling, simulation and experimental results. Analyzing these results, new control strategies to improve the system rithrough fault capability are de-veloped. Also, some strategies present in literature are tested in order to evaluate and compare the results with the ones proposed in this work. The main objective here is not to develop a final and definitive solution, but a strategy that can be used in some situations or in conjunction with other ones.
1.6
Methodology
The first objective of this work is to analyze the DFIG behavior during the balanced and unbalanced voltage sags. This analysis is carried out using three methodologies:
• Mathematical modeling in the time and Laplace domains of the gene-rator dynamic behavior during voltage sags;
• Simulation results using a computational model that represents the relevant system dynamics of a 2 MW WECS;
• Experimental results obtained in two test benches: a 4kW and a 25kW rated power.
The mathematical modeling gives the understanding of the system vari-ables behavior and comprehension of the influence of the system parameters. The experimental results are used to observe and prove the behavior of the measured variables (voltages, currents, speed, ...). As the test benches are small-scale models of a real WECS, in order to extrapolate the results, a 2MW simulation is used.
1.7 State of Art 11
Through these results, new control strategies are proposed and their behavior are analyzed using the simulation and experimental results. The mathematical analysis of these strategies is also carried out, focusing mainly on the influence in the voltage and current behavior.
1.7
State of Art
With the increasing number of wind power plants worldwide, several works have been published contemplating the different aspects of WECS, like mechanical studies of the blades, electrical characteristics of the different types of generators, power electronic conveters used to connect the system to the grid, etc.
The DFIG technology is one of the most studied topologies due to its high market penetration and also due to its susceptibility to grid disturbances. Wound rotor induction machines have been used for many decades. In the beginning they were used as motor with the connection of variable resistances in the rotor circuit to increase the starting torque or to vary the machine speed. Only with the development of power electronics that in the end of 1980’s the wound rotor machine started to be studied and used as generator in wind conversion systems.
Tang and Xu (1992) present a system using the DFIG technology with the control implemented using the stator flux orientation. This pioneer paper shows, through simulation results, that it is possible to operate with the optimum torque and speed, extracting the maximum wind power. In Pena et al. (1996) the use of PWM converters in the rotor circuit is presented and the vector control strategy is described. The independent control of active and reactive power is demonstrated using experimental results obtained in a DFIG small-scale test bench. This paper is one of the most cited papers in this topic and it is the basis of the DFIG technology.
short-circuit current and simulation results are shown. These and several other papers address the DFIG behavior in the time domain, but they lack of a deeper analysis that explain the variables behavior.
L´opez et al. (2007) and L´opez et al. (2008a) present a useful mathema-tical modeling, scrutinizing the behavior of the flux linkages and voltages in the generator during balanced and unbalanced voltages sags, respectively. The mathematical development is validated using experimental results. The authors simplify the analysis using the machine with open rotor circuit which is a useful tool that permits correlating the different variables behavior with the system parameters and sag severity. These papers are cited in several works, but despite the useful analysis, the current control influence in the DFIG dynamic behavior has not been analyzed.
With the development of specific grid codes to the connection of WECS in the grid including the ride-through fault capability requirements, several recent publications about the DFIG technology have focused in the deve-lopment of new strategies to improve the system RTFC. The most popular solution for this problem is the crowbar device, wich is discussed in several papers. The crowbar is a switched resistance that is inserted in parallel with the rotor circuit during the sag in order to avoid that the high rotor currents damage the converter.
In their works, Lohde et al. (2007), Anaya-Lara et al. (2008) and Zhang et al. (2010) basically deal with the crowbar resistance sizing. Morren and de Haan (2005), Ling et al. (2009) and Erlich et al. (2007) show simulation results, presenting different strategies to activate and deactivate the crowbar device.
When the crowbar device is activated, the generator acts like a squirrel cage machine consuming reactive power from the grid, which is undesirable. This device is useful for the protection of the converter, but to use it for RTFC solution, modifications are necessary.
1.7 State of Art 13
In order to avoid the disconnection of the RSC during the dip, Yang et al. (2009) proposes the use of series resistances, instead of using the crowbar in parallel with the rotor. In this paper, a method for calculating the currents during the sag is developed and simulation results are used to validate the modeling and the proposed strategy. Rahimi and Parniani (2010) uses the resistances in series with the stator instead of the rotor.
The solutions using the crowbar or series resistances require the addi-tion of extra hardware, increasing system complexity and costs. Therefore, software modifications in the control strategy are preferred, enhancing the system behavior during the dips. The crowbar may be used just as a protec-tion device to avoid high currents in the converters.
In Xiang et al. (2006) the stator flux linkage is used to calculate the rotor current reference during the sags and an analysis of the feasible conditions when the strategy can ride-through the sag is shown. Using experimental and simulation results the strategy feasibility is demonstrated for balanced and unbalanced voltage sags.
The stator flux linkage is also used to generate the rotor current referen-ces during balanced voltage sags in L´opez et al. (2008b). Through simulation results it is demonstrated that the strategy increase the flux damping, but the rotor currents, the most important variable, are not analyzed in this work. Probably, to damp the flux as shown, extremely high rotor currents are necessary.
The reduction of the rotor currents during the sag is performed in Liang et al. (2010) using feed-forward compensators to deal with the rotor voltages and currents transients caused by the voltage sag, but it is shown that the stator flux damping is reduced.
Ling et al. (2009) compares two strategies to control the rotor current using the reference values calculated through the stator flux linkage. Simu-lations results are shown, but the analysis of the rotor current is missing.
voltage sags shows that the strategy reduces the rotor overcurrents, but the stator flux linkage oscillations are not analyzed. The authors also develop a modeling in the Laplace domain to describe the behavior of the voltage and currents during the voltage sags.
The control strategies proposed in the discussed papers show results for symmetrical voltage sags, but the majority of the dips in the power system are unbalanced. The DFIG ride-through during unbalanced conditions is a little more complicated, because, as it will be demonstrated in this work, negative sequence current arise.
In Brekken and Mohan (2004) and Brekken and Mohan (2007) a feed-forward compensation is employed in the classic current control in order to decrease the torque and power oscillations caused by the negative sequence current during unbalanced voltage sags. Simulation and experimental results are presented to validate the proposed strategy and a mathematical model is used to tune the filters used for the compensation.
Several works in the literature present the use of a dual-PI structure to control separately the current positive and negative sequence components. Xu and Wang (2007), Park et al. (2007), Kearney and Conlon (2008) and Hu et al. (2009b) show the mathematical modeling of the machine under grid voltage unbalance and demonstrate the use of the dual-PI structure to control the RSC currents. Navarro and Richter (2007), Abo-Khalil et al. (2007), Zhou et al. (2007), Qiao and Harley (2008), Xu (2008), Wang et al. (2008), Zhou et al. (2009), Fan et al. (2009) and Wang and Xu (2010) extend the analysis and the use of this control structure also for the GSC. It is presented the coordinate control of the RSC and GSC in order to reduce the grid power oscillation.
The works cited in the last paragraph deal just with the DFIG control when there is a small grid voltage unbalance. The transient caused during voltage sags is not analyzed. Gomis-Bellmunt et al. (2008) analyzes the same control structure showing results also for asymmetrical voltage sags. Wang et al. (2009) proposes the use of the dual-PI control with the addition of a compensation term to deal with the voltage transient.
1.8 Contributions 15
a PI-resonant control structure. Resonant controllers are also employed in Hu and He (2009b) and Luna et al. (2009) in a stationary reference frame. All these papers show the reduction in the electromagnetic torque pulsation due to the negative sequence, but the transient caused by the voltage sag is not analyzed since just long term voltage unbalances in the network are addressed.
The works presented in this section are deeper analyzed in the following chapters. Some of the control strategies proposed in the literature are imple-mented and analyzed for the sake of comparison.
To finish the presentation of the state of art, it is important to mention the large experience of the “Laborat´orio de Controle e Convers˜ao de Energia” (LCCE) studying wind energy conversion systems. In the last three years four Master dissertation and one PhD thesis were developed about different aspects of the doubly-fed technology: Ramos (2009), Mendes (2009), da Silva (2009), Liu (2011) and Oliveira (2009). Other technologies are also studied as synchronous machines with permanent magnets. The research group ex-perience contributed for the development of the present work.
1.8
Contributions
The core of this work is the analysis of the DFIG behavior during vol-tage sags and the development of new ride-through control strategies, but it intends to go one step further to the works presented in the previous section. The following new contributions can be listed:
• The development of a mathematical modeling in the Laplace domain which permits the inclusion of the control effect in the machine dynamic behavior during voltage sags;
• Extension of the proposed Laplace domain mathematical modeling with separation in positive and negative sequence components;
• Development of new control strategies to improve the DFIG ride-through fault capability during balanced and unbalanced voltage sags, including the analysis of the voltage sag transient.
All the analysis carried out is validated using mathematical demonstra-tion, simulation results in a Simulink model and experimental results.
Besides the contributions cited, the author gives the contribution of de-sign and assembly of the 25kW test bench which could be used in several other works to be developed in the LCCE. A system like that, with all its functionality and such rated power, probably is unique in Brazil, contributing with the national science development.
The results produced in this work originated five conference papers and one paper in a journal. They are cited below per chronological order:
• V. F. Mendes, B. Rabelo, C. V. Sousa, F. F. Matos, W. Hofmann and S. R. Silva (2010). Comportamento de Aerogeradores de Dupla Excita¸c˜ao Frente a Afundamentos de Tens˜ao. III Simp´osio Brasileiro de Sistemas El´etricos - SBSE, pages 1-6.
• V. F. Mendes, C. V. Sousa, S. R. Silva, B. Rabelo, S. Krauss and W. Hofmann (2010). Behavior of Doubly-Fed Induction Generator During Symmetrical Voltage Dips Experimental Results. IEEE International Symposium on Industrial Electronics - ISIE, pages 2345-2350.
• V. F. Mendes, W. Hofmann, S. R. Silva (2010). Control of Doubly-Fed Induction Generator during Symmetrical Voltage Sags. IEEE Power & Energy Student Summit - PESS, pages 26-29.
• V. F. Mendes, C. V. Sousa, S. R. Silva, B. Rabelo, S. Krauss and W. Hofmann (2011). Modeling and Ride-Through Control of Doubly Fed Induction Generators During Symmetrical Voltage Sags. IEEE Transactions on Energy Conversion, v.26, issue4, pages 1161 - 1171.
1.9 Text Organization 17
• V. F. Mendes, C. V. Sousa, G, M. Rezende, S. Y. Liu, S. R. Silva (2012). Estrat´egias de Controle Aplicadas a Aerogeradores Duplamente Excita-dos Durante Afundamentos de Tens˜ao DesequilibraExcita-dos. XIX Congresso Brasileiro de Autom´atica, v. 1, p. 3118-3125.
The journal of the publication is classified as Qualis A by CAPES and this paper has been cited 9 times according to Scopus and 5 times according IEEE. The paper presented in the PESS (IEEE Power & Energy Student Summit) received the 2nd Best Paper Award Prize. This publications and this prize contribute to the divulgation of the work results and the evaluation by the scientific community.
The author has also contributed in areas related to this work, publishing seven papers as co-author in national and international conferences during the doctorate.
It is important to mention that this work was developed in cooperation between the Federal University of Minas Gerais (UFMG) and Dresden Tech-nological University (TUD - “Technische Universit¨at Dresden”) in Germany. Part of the studies presented in this document was developed during the sandwich doctorate realized during 2010 under supervision of Prof. Dr. Ing-Wilfried Hofmann.
1.9
Text Organization
In this first chapter an overview of the use of wind energy is presented and the technology studied in this work is briefly described. The motivation and objectives of the present dissertation is clarified, as well as the methodo-logy used in order to reach these aims. A bibliographic review is presented, emphasizing the present state of art. Finally the intended contributions are set.
The second chapter is dedicated to describe the DFIG control topology. The simulation model and the test benches used to analyze and validate the results are also described.
effect on the DFIG behavior, these two cases are analyzed separately in Chapters 3 and 4, respectively. The analysis is carried out using in both cases a mathematical approach, simulation and experimental results.
The proposed ride-through control strategies for symmetrical and asym-metrical case are presented in Chapter 5 and 6, respectively. The simulation and experimental are shown in order to validate the strategies.
Chapter 2
Doubly-Fed Wind Energy
Conversion System
2.1
Introduction
Wind energy conversion systems are constituted of a wind turbine that converts the kinetic wind energy into mechanical power in the generator shaft. There are technologies with a gearbox between the turbine and the generator, as the DFIG, and others called gearless technologies. The mechanical power is converted by the generator into electric power which is supplied to the grid using or not using power converters.
This chapter is dedicated to briefly describe the energy conversion process in the DFIG technology, explaining the generator classical control strategies. Furthermore, the simulation model and test benches are also presented.
As the objective of the present work is to analyze the electrical behavior of the machine which is much faster than the mechanical dynamics, the latter is not described here. Details about the turbine, the gearbox and a simple mechanical modeling can be found in Mendes (2009) and Rabelo (2009).
2.2
The DFIG Technology
turbine speed to a higher speed in the generator shaft. The stator circuit of the generator is directly connected to the grid, therefore, under normal operation, it is supplied by a constant voltage amplitude and frequency. The rotor circuit is supplied by converters through slip rings. The Figure 2.1 depicts the schematic diagram of the DFIG drive topology.
Figure 2.1: DFIG drive topology (Blaabjerg et al., 2006).
Two voltage source converters (VSC) connected using a DC-link in the so-called back-to-back configuration are used. Generally, these converters use IGBTs (Insulated Gate Bipolar Transistor) commanded using PWM (Pulse Width Modulation) switching method.
The grid side converter (GSC) is connected to the grid through a filter used to reduce the harmonics due to the converter switching. A transformer can be used or not for the connection of the filter to the grid. When the transformer is used, its role is to decrease the rotor circuit voltage, decreasing the DC-link voltage. The GSC controls the DC-link voltage and can be also used to control the reactive power flowing from or to the grid.
2.2 The DFIG Technology 21
on supersynchronous speeds, whereas the active power injection results in subsynchronous operation. The changing in the rotor current represents a changing in the stator power flow, therefore the RSC is used to control the stator active and reactive powers.
In the next subsections, the electric components of the technology are mathematically modeled. Based on this modeling the GSC and RSC classical control strategies are presented in the following sections.
2.2.1
Wound rotor induction generator
The construction of the wound rotor induction machine is similar to the squirrel cage one. The stator windings are supplied by alternating voltage and currents, in such a way that the spatial winding distribution produces a rotating magnetic flux in the machine air gap. The windings in the rotor end up on copper slip-rings mounted to the shaft that permits the use of a external source to supply rotor circuits. The rotor currents also impose a rotating flux in the air gap whose frequency depends on the currents frequency, defining the machine speed in such value that warrant the production of continuous torque.
In this section, the classical induction motor model in a synchronous reference frame is presented. The stator and rotor differential equations in the synchronous reference frame are written as (Kov´acs, 1984):
→ vs=Rs
→ is+
d dt
→ ψs+jωs
→
ψs, (2.1)
→ vr =Rr
→ ir+
d dt
→ ψr+jωr
→
ψr, (2.2)
where the variables are in the synchronous reference frame and the parame-ters are referred to the stator. The meanings are clarified below:
• vs and vr are the stator and rotor voltages, respectively;