Vol. 34, No. 03, pp. 759 – 773, July – September, 2017 dx.doi.org/10.1590/0104-6632.20170343s20150584
* To whom correspondence should be addressed
A
n
SBBR APPLIED TO BIOMETHANE
PRODUCTION FOR VINASSE TREATMENT:
EFFECTS OF ORGANIC LOADING, FEED
STRATEGY AND TEMPERATURE
W.A. Almeida
1, S.M. Ratusznei
2, M. Zaiat
1and J.A.D. Rodrigues
2,*1Escola de Engenharia de São Carlos, Universidade de São Paulo (USP), Av. Trabalhador São-Carlense 400, 13566-590, São Carlos-SP, Brasil.
2Escola de Engenharia Mauá, Instituto Mauá de Tecnologia (IMT), Praça Mauá 1, 09580-900, São Caetano do Sul-SP, Brasil.
*E-mail: [email protected]
(Submitted: September 14, 2015; Revised: April 19, 2016; Accepted: June 3, 2016)
Abstract – This study assessed the feasibility of an anaerobic sequencing batch and fed-batch biofilm reactor (AnSBBR) with mechanical stirring for vinasse treatment and biomethane production. The amount of liquid medium used was 3 L, and the treated volume was 1 L per cycle. The cycle time was 8 h, with feeding times of 10 min (batch mode) and 240 min (fed-batch mode). Methane productivity increased with the increase in organic load from 1.0 to 10.0 gCOD.L -1.d-1. The maximum molar productivity and yield of methane were 123.4 molCH
4.m
-3.d-1 and 13.8 mmolCH 4.gCOD
-1
(88% of the theoretical), respectively. These parameters were lower in fed-batch mode than in batch mode and were lower at 45°C than at 30°C due to biomass adaptation. In general, the values of the kinetic parameters increased with organic load and were similar for the batch and fed-batch modes. Therefore, the increase in organic load positively
influenced the process by increased COD removal and lower volatile acids accumulation as the load increased. The
batch mode performed better than did the fed-batch mode and 30°C was more suitable than 45°C to produce methane under the studied conditions.
Keywords: AnSBBR; biomethane; applied organic load; feed strategy; temperature.
INTRODUCTION
Vinasse disposal in soil is widely used because vinasse is rich in many nutrients and minerals that are essential to plant growth. However, fertirrigation with vinasse may change physical and chemical characteristics of the soil. This activity leads to the soil salinisation, mainly due to the high concentration of potassium in vinasse. These issues show that there is a need to develop more suitable use options for this type of ethanol production effluent (Santos et al., 2013). Biological treatment is recognized as
an effective method of treatment for the highly polluted wastewaters that result from agroindustry, including distilleries. Anaerobic treatment can be used to convert a significant portion of the organic matter into biogas, which can be used as an energy source in the distillery (Pant and Adholeya, 2007; Vlissidis and Zouboulis, 1993; Wilkie et al., 2000; Cesaro and Belgiorno, 2015).
Within this framework, the anaerobic sequencing batch reactors, ASBR (free cells) and AnSBBR (immobilized cells), are being largely studied for bioenergy generation and environmental compliance (Zaiat et al., 2001). Arooj et al. (2008) and Kim et al. (2005) used an ASBR for
of Chemical
hydrogen production and they analysed the effects of the hydraulic retention time on the process and the effects of the substrate concentration, respectively.
Other researchers used an ASBR for methane production: Massé et al. (2004), studying the effect of scale up; Cassidy et al. (2008a; 2008b), assessing the influence of the organic load rate, solid retention time, and food/microorganism rate; Selma et al. (2010), analysing the effects of organic load (by increasing influent concentration) and the feed strategy (batch or fed-batch); and Silva et al. (2013), varying the organic load, the reactor feed time and the cycle length. On the other hand, Ndegwa et al. (2005), aiming at reactor optimization, and Ruíz et al. (2002), investigating the kinetics of the degradation process, used ASBR for biogas production.
Finally, some papers related to AnSBBR and methane production regarding feed strategy and organic load improvement: Lovato et al. (2012) studied the effects of feed strategy treating the effluent from biodiesel production; Bezerra et al. (2011) treated the same effluent to test the effect of the organic load; and Lullio et al. (2014) aimed at integrating hydrogen and methane production treating the effluent of hydrogen production to produce methane. Only a few studies involved the use of an AnSBBR to produce methane, and there are no papers in the published literature regarding the use of vinasse as a substrate. In addition, note that the anaerobic process is assuming importance in bioenergy production (hydrogen and methane) via the biogas resulting from the biotransformation of polluting substances.
In view of the aspects presented, this study analysed the performance of an anaerobic sequencing batch and fed-batch biofilm reactor (AnSBBR) with mechanical stirring for vinasse treatment and biomethane production. The influence of the applied volumetric organic load (AVOL – from 1.0 to 10.0 gCOD.L-1.d-1), feed strategy (feeding
time of 10 min in batch mode and 240 min in fed-batch mode) and temperature (30°C and 45°C) on the yield of methane from the consumed organic load, methane productivity, kinetic parameters and the overall factors of the degradation process were assessed.
MATERIALS AND METHODS
AnSBBR with immobilised biomass and mechanical stirring
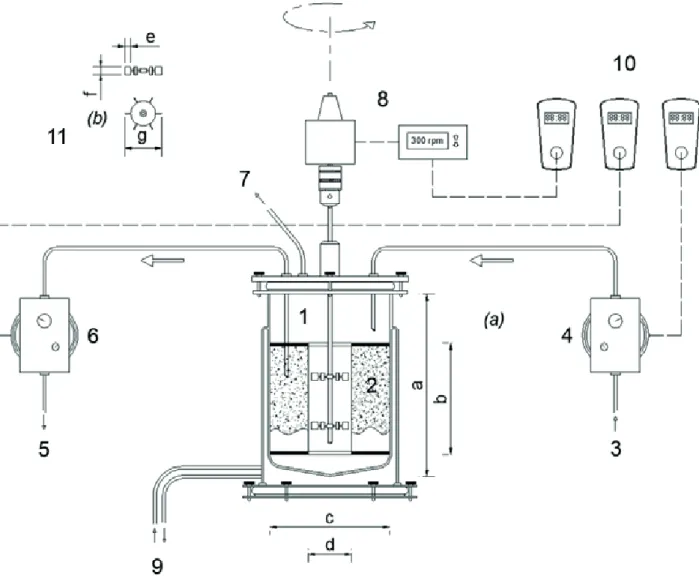
Figure 1 presents the scheme of the bioreactor with mechanical stirring (New Brunswick Scientific model Bioflo 110®), which was composed of a glass vessel of 20
cm in diameter and 30 cm in height, with a total volume of 7.5 L and a useful capacity of 6.0 L. The support material was confined in a pierced stainless steel-316 container of 18 cm in height and 7.0 cm and 17.5 cm of internal and external diameter, respectively. Fixed stirring at 300 rpm
was implemented via a motor connected to the turbine type impellers of 6 cm in diameter, composed of two sets of six plane blades (Rushton pattern) installed at 8 and 16 cm from the bottom of the vessel (Michelan et al., 2009).
Feeding and discharge were performed using diaphragm pumps (Prominent models b and Concept, respectively). An automation system composed of temporizers was responsible for starting/stopping the pumps and for stirring to implement the steps of sequencing batch operation: feeding, reaction and discharge. The temperature was controlled by water circulation into the double external wall of the reactor (Marconi model MA-184).
Inoculum and inert support
The inoculum was obtained from an UASB that treated wastewater of a slaughterhouse of poultry. The inoculum presented values of total solid concentration (TS) and total volatile solids (TVS) of 62 and 51 g.L-1, respectively. The
material used as support was polyurethane foam (cubes of 1.0 cm), with an apparent density of 23 kg.m-3 and a
porosity of approximately 95%. The anaerobic sludge was immobilized according to Zaiat et al. (1994). The support was confined inside the reactor (pierced stainless steel-316 container with 7 cm from the center) so that the impeller could freely rotate (Figure 1).
Wastewater
The wastewater/substrate was based on the vinasse that results from the industrial process of bioethanol production from a sugar/alcohol plant located in São Paulo, Brazil, which is produced during the purification of ethanol by distillation from the medium fermented in the previous stage. The composition of the industrial vinasse used is presented in Table 1.
According to the experimental condition, the industrial vinasse was diluted in tap water and supplemented with urea (CH4N2O – 5.8 mg.L-1 for each 1000 mgCOD.L-1) and
sodium bicarbonate (NaHCO3 – 500 mg.L-1 for each 1000
mgCOD.L-1)
Physical-chemical analyses and microbiological tests
The following parameters were monitored in both the influent and the effluent: organic matter concentration non-filtered (CST) and filtered (CSF) (as chemical oxygen demand), bicarbonate alkalinity (BA), total volatile acids (TVA), total solids (TS), total volatile solids (TVS), total suspended solids (TSS) and volatile suspended solids (VSS), as well as the pH (Standard Methods for the Examination of Water and Wastewater, 1995).
The analysis of biogas composition was performed by gas chromatography using an Agilent® model 7890
Figure 1. Scheme of the AnSBBR: (1) Bioreactor (a = 29,5 cm; b = 18 cm; c = 18 cm); (2) Stainless steel box (b = 18 cm; d = 7 cm); (3)
Influent; (4) Feed pump; (5) Effluent; (6) Discharge pump; (7) Biogas outlet; (8) Stirring; (9) Thermostatic bath; (10) Automation system; (11)
Turbine type propellers with six plane blades (e = 2 cm; f = 1.5 cm; g = 6 cm).
Table 1. Composition of the industrial vinasse.
Parameter Concentration (mg.L-1) *
COD 31258
pH 5.6
BA 27
TVA 7633
TVS 19573
TSS 1524
VSS 1182
FSS 341
VDS 18391
EtOH 248
HAc 1339
HPr 91
HBu 0 **
HVa 0 **
HCa 0 **
conductivity detector and GS-Carbonplot column with 30 m × 0.53 mm × 3.0 mm of film thickness. The carried gas was argon, with a flow of 3.67 mL.min-1, an injector
temperature of 185°C, a split ratio of 10 and an injection volume of 200 mL. The temperature of the oven was programmed as 40°C isothermal in 5 min. The temperature of the detector was 150°C, with a flow make up of argon of 8.33 mL.min-1. The total biogas production during a cycle
(VG) was measured using the Ritter gas measurer model MilligasCounter.
The analysis of anaerobic metabolism (acetone, methanol, ethanol, n-butanol, acids acetic, propionic, butyric, isobutyric, valeric, isovaleric and caproic) was performed via gas chromatography (method of head-space) with external standard (isobutanol and crotonic acid) using an Agilent ® model 7890 chromatograph equipped with
a flame ionization detector and a HP-Innowax column with dimensions of 30 m × 0.25 mm × 0.25 mm of film thickness. The carried gas was hydrogen, with a flow of 1.56 mL.min-1, an injector temperature of 250°C, a split
ratio of 10 (head-space) and an injection volume of 400
mL, using an automatic injector. The temperature of the oven was programmed as follows: from 35°C to 38°C at 2°C.min-1, from 38°C to 75°C at 10°C.min-1, from 75°C to
120°C at 35°C.min-1, at 120°C for 1 min, from 120°C to
170°C at 10°C.min-1 and at 170°C for 2 min (head-space).
The temperature of the detector was 280°C (head-space), with a hydrogen flux of 30 mL.min-1, a synthetic air flow
of 300 mL.min-1 and a flow make up of nitrogen of 30
mL.min-1.
Samples from the reactor were collected for microbiological examination. The samples were examined on glass slides using an Olympus model BX41® optical microscope with Optronics digital camera system and the Image-Pro Plus® Version 4.5.0 image acquisition software.
Experimental procedure
The experimental conditions were produced using different volumetric organic loads that were modified by the influent concentration, which ranged from 1000 mgCOD.L-1 to 10000 mgCOD.L-1. Experiments were
performed in batch mode at 30°C that used vinasse as the influent (Conditions C01 to C08 – from 1000 mgCOD.L-1 to
10000 mgCOD.L-1). In sequence, the feeding strategy was
changed from batch to fed-batch mode while maintaining the influent concentration of vinasse at 10000 mgCOD.L-1
and the temperature at 30°C (Condition C09). The last condition was performed in batch mode with an influent concentration of 10000 mgCOD.L-1, with the temperature
increased from 30°C (from the other conditions) to 45°C, while maintaining the operation in batch mode (Condition C10). In all experimental conditions, the cycle time length was 8 hours, and the stirring was 300 rpm (Bezerra et al., 2011; Lovato et al., 2012; Selma et al., 2010; Silva et al., 2013).
The reactor operation proceeded as follows: (a) feed of 1.0 L of wastewater in 10 min (batch mode) or 240 min (fed-batch mode); (b) agitation and reaction (for fed-batch mode, the feeding time is included); and (c) discharge of 1.0 L in 10 min. A cycle was completed while maintaining a residual volume of 2.0 L from the total volume of liquid medium in the reactor of 3.0 L. In sequence, a new cycle started.
Once stable experimental conditions were achieved, profiles along the cycle for some of the monitored parameters were made. The parameters of interest were filtered organic matter concentration, bicarbonate alkalinity, total volatile acids, intermediate metabolites, biogas (volume and composition) and pH. The total volume sampled had a maximum of 300 mL, which is 10% of the system volume. Thus, after the profiles were performed a new experimental condition was implemented.
Theoretical
The efficiencies of total organic matter removal (εST)
are calculated using Equation (1), and the efficiencies of filtered organic matter removal (εSF) are calculated using
Equation (2). The efficiencies of filtered organic matter removal (ε) for the profiles along the cycle are calculated using Equation (3). CSINF and CSINF0 is the filtered organic matter concentration in the influent and in the reactor at the beginning of the cycle (time zero – the organic matter concentration in the reactor after the initial dilution of the influent), respectively.
SINF ST
ST
SINF
C
- C
å (%) =
×100
C
SINF SF
SF
SINF
C
C
(%)
100
C
−
ε
=
⋅
SINFO SF
SINF0
C
C
(%)
100
C
−
ε
=
⋅
The applied volumetric organic load (AVOL) is defined as the amount of organic matter that is applied to the reactor per unit time and per volume of medium (gCOD.L -1.d-1). For reactors operated in batch mode, AVOL is
calculated using Equation (4). The specific applied organic load (ASOL) is defined as the amount of organic matter that is applied to the reactor per unit time and per mass of total volatile solids in the reactor (gCOD.gTVS-1.d-1). For
reactors operated in batch mode, ASOL is calculated using Equation (5).
The removed volumetric organic load (RVOLF) for filtered samples is defined as the amount of organic matter
(2)
(3) (1)
removed by the reactor per unit time and per volume of medium in the reactor (gCOD.L-1.d-1). For reactors operated
in batch mode, RVOLF is calculated using Equation (6). The specific removed organic load (RSOLF) for filtered
samples is defined as the amount of organic matter removed per unit time and per mass of total volatile solids in the reactor (gCOD.gTVS-1.d-1). For reactors operated in batch
mode, RSOLF is calculated using Equation (7).
(
⋅ ⋅
)
=
F SINFR
V N C
AVOL
V
(
F)
SINFTVS
V N C
ASOL
M
⋅ ⋅
=
(
F)(
SINF SF)
FR
V N
C
C
RVOL
V
⋅ ⋅
−
=
(
F)(
SINF SF)
FTVS
V N
C
C
RSOL
M
⋅ ⋅
−
=
Productivity (volumetric, VPr, or molar, MPr) is defined by the amount of methane produced per unit time and per usable reactor volume (mL-STP-CH4∙L-3∙d-1
or molCH4∙L-3∙d-1), as calculated using Equations (8) and
(9). The specific productivity (volumetric, SVPr, or molar, SMPr) is defined as the amount of methane produced per unit time and per mass of total volatile solids in the reactor (mL-STP-CH4∙kgTVS-1∙d-1 or molCH
4∙kgTVS
-1∙d-1) and is
calculated from Equations (10) and (11).
The volumetric yield of methane produced (mL-STP) per consumed load (gCOD) is defined as the amount of methane produced (in moles) by the amount of organic matter consumed (in mass). The molar volumetric yield of methane can be obtained by replacing the volume of produced methane (mL-STP) in Equation (12) with the amount of methane produced in moles, as found by using Equation (13). 4 CH STP R
N V
VPr
V
−⋅
=
4 CH RN N
MPr
V
⋅
=
4 CH STP TVSN V
SVPr
M
−⋅
=
4 CH TVSN N
SMPr
M
⋅
=
(
4)
4/
CH STP V CH COD
F SAFF SF
V
Y
V
C
C
−
−
=
⋅
−
(
4)
4/COD
CH M CH
F SAFF SF
N
Y
V
C
C
−
=
⋅
−
The first-order kinetic model applied was developed by Rodrigues et al. (2004), based on the model of Bagley and Brodkorb (1999). The latter is an adaptation of another model that was proposed by the International Water Association (IWA) and was applied to systems of treatment with activated sludge. In the applied model, which was developed to sequence anaerobic batch reactors, the organic matter degradation process is simplified and divided into two consecutive steps. The first step is when the substrate is converted into total volatile acids, and in the second step, these acids are converted into methane. The model admits the existence of a residual concentration of both substrate and total volatile acids, in which the respective reaction rate tends to zero.
The organic matter degradation pathway is shown as follows, in which a, b and c are stoichiometric coefficients and k1 and k2 are the apparent kinetic parameters (Equation 14).
1 2
k k
a S
⋅ → ⋅
b TVA
→ ⋅
c M
1
(
)
S S S SR
r
=
k
⋅⋅
C
−
C
1
(
)
2(
)
TVA TVA S SR TVA TVA TVAR
r
=
k
⋅⋅
C
−
C
−
k
⋅⋅
C
−
C
2
(
)
M M TVA TVAR
r
=
k
⋅⋅
C
−
C
The equations of the reaction rate of substrate consumption (rS), the formation of total volatile acids (rTVA) and the formation of methane (rM) are shown in Equations (15) to (17), with k1S, k1TVA, k2TVA and k2M being the same apparent kinetic parameters, but associated with substrate consumption, total volatile acids formation and methane formation, respectively. CS and CTVA are the substrate concentrations and the total volatile acids, and CSR and CTVAR are their respective residual values.
cycle length (i.e., F ≠ 0), and the second is in batch mode, in which the feeding time is negligible (i.e., F = 0). The values of CS0, CTVA0, CM0 and V0 correspond to the initial values of CS, CTVA, CM and V, respectively. The values of CSf and CTVAf correspond to the values of feeding of CS and CTVA.
dV
F
dt
=
t
= → =
0
V
V
0(
)
S
Sf S S
dC
F
C
C
r
dt
=
V
⋅
−
−
t
= →
0
C
S=
C
S0(
)
TVA
TVAf TVA TVA
dC
F
C
C
r
dt
=
V
⋅
−
+
M
M M
dC
F
C
r
dt
= − ⋅
V
+
t
= →
0
C
M=
C
M0Because these are differential equations, Euler’s numerical integration method and a constant integration step were applied and programmed in the software Excel®
(Excel) to determine these parameters via Newton’s algorithm using the Solver tool in Excel.
The non-specific kinetic parameters k1S, k1TVA, k2TVA e k2M are apparent because they encompass effects of mass transport and heat transfer. Specific kinetic parameters are the “non-specific” parameters divided by the biomass concentration (CX – expressed by the total volatile solids in the reactor, TVS, in the volume of reacting medium) and are represented by k’1S, k’1TVA, k’2TVA and k’2M. The parameters CSR and CTVAR correspond only to an estimate of the residual value of the substrate and the volatile acids in the reactor at the end of a cycle. In addition, the kinetic model applied is a simplification of the complex process of anaerobic degradation.
RESULTS AND DISCUSSION
Analysis of the parameters monitored in the
experimental conditions in batch mode (30 and 45°C) and fed-batch mode (30°C)
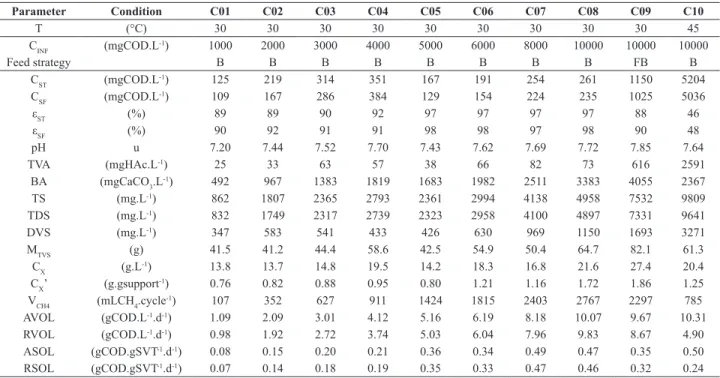
Table 2 presents the average values of the parameters monitored during all of the experimental conditions. Both the organic matter concentration (COD) and efficiency of removal during the increase in organic load in Conditions C01 to C08 (batch – 30°C) showed a significant
consumption of organic matter, with the efficiency of removal for filtered samples always greater than 90%.
For Conditions C09 (fed-batch – 30°C) and C10 (batch – 45°C), the organic matter concentration (COD) in the effluent increased, with efficiencies of removal for the filtered samples of 88% and 46%, respectively. The average pH values in all conditions (C01 to C10) were in the neutral range (7.2-7.7). The total volatile acids in the influent were consumed during the increase of the organic load (Conditions C01 to C08) and increased with the change in feed strategy and temperature (Conditions C09 and C10).
The increase in the organic load also led to a gradual increase in the volumes of biogas per cycle (Conditions C01 to C08). This result can be explained by the increase in the organic matter (COD) fed because under these conditions a greater amount of substrate that could be converted into biogas was fed to the reactor. In addition, favourable environmental conditions existed for the stability of the process. The maximum, the mean and minimum volumes of CH4 produced were 2767, 1169 and 107 mL-STP-CH4. Cycle-1, respectively. However, there were decreases in
the volumes of biogas that were produced per cycle with changes in the feed strategy and temperature (conditions C09 and C10), which resulted in volumes of 2297 and 785 mL-STP-CH4.Cycle -1, respectively.
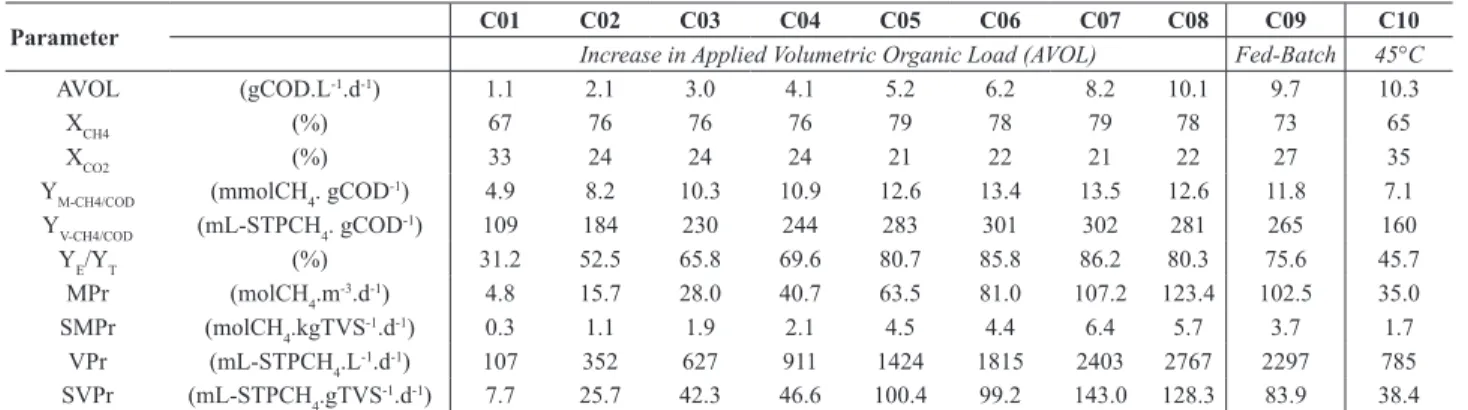
Table 3 presents the performance indicators for the increase in organic load (conditions C01 to C08), the change in feed strategy from batch mode to fed-batch mode and the increase in temperature from 30°C to 45°C (conditions C09 and C10). Shading indicates the proportion of the magnitudes of parameters in the same line. YE/YT is the ratio of the experimental yield, both molar (M) and volumetric (V), to the theoretical yield of 15.63 mmolCH4. gCOD-1 or 350 mLCH
4-STP.gCOD
-1. SMPr and SVPr are
the specific molar and volumetric productivity indicators, respectively, and XCH4 is the percentage of methane in biogas.
For the conditions in batch mode at 30°C (C01 to C08), Table 3 shows that there is a general tendency for the indicators to increase with an increase in organic load, and Condition C07 presented the best results. The yield indicator YM-CH4/COD shows that, overall, a greater number of CH4 molecules were produced from the same quantity of consumed organic matter, i.e., the system became more efficient by increasing the organic load. Figure 2 shows a tendency to reach a maximum; as a result, using the fitted equation shown, the maximum yield was 13.7 mmolCH4. gCOD-1, corresponding to an AVOL of 7.50 gCOD.L-1.d-1
(batch at 30°C). This yield corresponds to 88% of the theoretical yield. In addition, the methane productivity increased with the increase in organic load. The maximum molar (MPr) reached was 123.4 molCH4.m-3.d-1, and the
volumetric (VPr) of 2767 mL-STP-CH4.L-1.d-1. Figure 2
shows a tendency of increasing productivity towards this maximum in an AVOL of 10.1 gCOD.L-1.d-1.
(18)
(19)
(20)
(21)
0
0
TVA TVATable 2. Experimental protocol and parameters monitored in the effluent and the organic loads for all experimental conditions.
Parameter Condition C01 C02 C03 C04 C05 C06 C07 C08 C09 C10
T (°C) 30 30 30 30 30 30 30 30 30 45
CINF (mgCOD.L
-1) 1000 2000 3000 4000 5000 6000 8000 10000 10000 10000
Feed strategy B B B B B B B B FB B
CST (mgCOD.L
-1) 125 219 314 351 167 191 254 261 1150 5204
CSF (mgCOD.L
-1) 109 167 286 384 129 154 224 235 1025 5036
εST (%) 89 89 90 92 97 97 97 97 88 46
εSF (%) 90 92 91 91 98 98 97 98 90 48
pH u 7.20 7.44 7.52 7.70 7.43 7.62 7.69 7.72 7.85 7.64
TVA (mgHAc.L-1) 25 33 63 57 38 66 82 73 616 2591
BA (mgCaCO3.L
-1) 492 967 1383 1819 1683 1982 2511 3383 4055 2367
TS (mg.L-1) 862 1807 2365 2793 2361 2994 4138 4958 7532 9809
TDS (mg.L-1) 832 1749 2317 2739 2323 2958 4100 4897 7331 9641
DVS (mg.L-1) 347 583 541 433 426 630 969 1150 1693 3271
MTVS (g) 41.5 41.2 44.4 58.6 42.5 54.9 50.4 64.7 82.1 61.3
CX (g.L
-1) 13.8 13.7 14.8 19.5 14.2 18.3 16.8 21.6 27.4 20.4
CX’ (g.gsupport
-1) 0.76 0.82 0.88 0.95 0.80 1.21 1.16 1.72 1.86 1.25
VCH4 (mLCH4.cycle
-1) 107 352 627 911 1424 1815 2403 2767 2297 785
AVOL (gCOD.L-1.d-1) 1.09 2.09 3.01 4.12 5.16 6.19 8.18 10.07 9.67 10.31
RVOL (gCOD.L-1.d-1) 0.98 1.92 2.72 3.74 5.03 6.04 7.96 9.83 8.67 4.90
ASOL (gCOD.gSVT-1.d-1) 0.08 0.15 0.20 0.21 0.36 0.34 0.49 0.47 0.35 0.50
RSOL (gCOD.gSVT-1.d-1) 0.07 0.14 0.18 0.19 0.35 0.33 0.47 0.46 0.32 0.24
(1) The cycle length time (tC) was 8 h (3 cycle/d) for all experimental conditions.
(2) Feed strategy was in batch (B, feeding time of 10 min, tF/tC=2%) or fed-batch (FB, 240 min, tF/tC=50%).
(3) The average percentage experimental error and average number of samples were, respectively, CST 14.3% (8 samples); CSF 16.6% (8 samples); εST 2.1% (8 samples); εSF 2.1% (8 samples); pH 2.5% (9 samples); TVA 22.8% (8 samples);
BA 9.0% (8 samples); TS 8.7% (4 samples).
There are two factors that can cause the increase in productivity with the increase of organic load (or increase in concentration) under favourable environmental conditions: (i) the fact that the increase in organic load corresponds to the increase in the number of molecules that can be converted to methane; and (ii) an improvement in the reaction rate of substrate consumption by microorganisms. For organic loads higher than that experienced, if the yield maintains its decreasing pattern, then the methane production must decrease as well because the increase in substrate concentration is insufficient to maintain the rise in productivity.
With regard to the indicator YM-CH4/COD, in Condition C08 (batch at 30°C, AVOL of 10.0 gCOD.L-1.d-1), the
yield was 12.6 mmolCH4.gCOD-1; in Condition C09
(fed-batch at 30°C, AVOL of 10.0 gCOD.L-1.d-1), it was
11.8 mmolCH4.gCOD-1; and in Condition C10 (batch at
45°C, AVOL of 10.0 gCOD.L-1.d-1), it was 7.1 mmolCH 4.
gCOD-1. For the best experimental condition (Condition
C07 – batch at 30°C, AVOL of 8.0 gCOD.L-1.d-1), the
yield was 13.5 mmolCH4.gCOD-1. The ratios between the
experimental yields for Conditions C07, C08, C09 and C10 and the maximum theoretical yield were 86%, 80%, 76% and 46%, respectively. For methane productivity, with a change in feed strategy to fed-batch mode and the rise in temperature to 45°C, fewer molecules of methane were produced by the same volume of reacting medium.
The maximum molar productivity achieved was in batch operation (Table 3) compared with fed-batch operation, with 102.5 molCH4.m-3.d-1, which corresponded to a
volume of 2297 mL-STP-CH4.L-1.d-1 and, with 45°C with
35.0 molCH4.m-3.d-1, which corresponded to a volume of
785 mL-STP-CH4.L-1.d-1. This effect was probably due to
a high reaction rate in batch mode in comparison to the dilution which occurred in fed-batch mode.
From Figure 2, one can observe that in Condition C08 (AVOL of 10.0 gCOD.L-1.d-1, batch at 30°C), the process
of degradation likely reached a maximum threshold of methane productivity, but was already under the maximum yield. The transition to fed-batch in Condition C09 (AVOL of 10.0 gCOD.L-1.d-1, fed-batch at 30°C) was not sufficient
to improve the yield and production of methane because the environmental condition was possibly close to the maximum threshold.
In addition to the decrease in the volume of biogas when the feed strategy was changed to fed-batch mode (Condition C08 to C09), when the temperature increased from 30°C to 45°C (Condition C08 to C10 – AVOL of 10.0 gCOD.L-1.d-1 and batch mode), this volume reduced
drastically. This decrease could be due to the biomass loss observed during Condition C10, as indicated by an increase in total volatile solids in the effluent during the experiment (2254 to 3596 mgTVS.L-1). The biomass loss could also
Table 4. Maximum concentrations of the intermediate compounds (mg.L-1) in a cycle for all experimental conditions *.
Condition EtOH HAc HPr HBut HVa HCa
Increasing AVOL
C01 42 114 29 17 13 13
C02 0 116 65 3 14 16
C03 0 164 97 46 16 17
C04 0 186 103 44 32 21
C05 340 477 102 12 23 27
C06 466 711 123 15 19 16
C07 529 865 168 19 20 17
C08 491 1207 176 9 13 16
Fed-Batch C09 89 367 80 10 19 0
45°C C10 50 5189 1351 14 15 15
* < Limit of detection estimated as 3 mg.L-1.
y = -0.21x2+ 3.09x + 2.19 R² = 0.99
0 4 8 12 16
1 2 3 4 5 6 7 8 9 10
YM
-C
H4
/C
OD
(m
m
o
lC
H4
. gC
O
D
-1)
AVOL (gCOD.L-1.d-1)
y = -0.19x3+ 3.00x2+ 1.67x + 0.05 R² = 1.00
0 31 62 93 124
1 2 3 4 5 6 7 8 9 10
M
P
r (m
o
lCH
4
.m
-3.d -1)
AVOL (gCOD.L-1.d-1)
Figure 2. Evolution of the yield (YM-CH4/COD) and molar methane productivity indicators (MPr) with the applied volumetric organic load (AVOL).
Table 3. Performance indicators for all experimental conditions.
Parameter C01 C02 C03 C04 C05 C06 C07 C08 C09 C10
Increase in Applied Volumetric Organic Load (AVOL) Fed-Batch 45°C
AVOL (gCOD.L-1.d-1) 1.1 2.1 3.0 4.1 5.2 6.2 8.2 10.1 9.7 10.3
XCH4 (%) 67 76 76 76 79 78 79 78 73 65
XCO2 (%) 33 24 24 24 21 22 21 22 27 35
YM-CH4/COD (mmolCH4. gCOD
-1) 4.9 8.2 10.3 10.9 12.6 13.4 13.5 12.6 11.8 7.1
YV-CH4/COD (mL-STPCH4. gCOD
-1) 109 184 230 244 283 301 302 281 265 160
YE/YT (%) 31.2 52.5 65.8 69.6 80.7 85.8 86.2 80.3 75.6 45.7
MPr (molCH4.m
-3.d-1) 4.8 15.7 28.0 40.7 63.5 81.0 107.2 123.4 102.5 35.0
SMPr (molCH4.kgTVS
-1.d-1) 0.3 1.1 1.9 2.1 4.5 4.4 6.4 5.7 3.7 1.7
VPr (mL-STPCH4.L
-1.d-1) 107 352 627 911 1424 1815 2403 2767 2297 785
SVPr (mL-STPCH4.gTVS
-1.d-1) 7.7 25.7 42.3 46.6 100.4 99.2 143.0 128.3 83.9 38.4
(1) Theoretical yield of methane from consumed COD: 15.6 mmolCH4.gCOD-1 (molar) or 350 mLCH
4-STP.gCOD
-1 (volumetric). Table 4 present the peaks of concentration of
the intermediate compounds produced in a cycle for each experimental condition. Acetone and methanol concentration were below the limit of detection of the chromatographic method employed. The table indicates that, for an increasing organic load, in general, the following acids were prevalent: acetic, propionic and butyric. The maximum concentration of acetic and propionic acids in a cycle increased with increasing organic load, while the maximum concentration of butyric acid rose until Condition C03 and then decreased in the
subsequent conditions. Ethanol concentration was always low or lower than the limit of detection of until Condition C04 and then increased in Condition 05 due to the use of vinasse that had been previously frozen, which prevented ethanol degradation.
In Condition C10, at 45°C, propionic acid predominated in relation to acetic acid. Thus, it is possible that acetogenic microorganisms were inhibited by temperature, thereby causing a conversion of propionic to acetic acid, which indicates a deviation in the main acetic metabolic pathway.
Analysis of the profiles along a cycle in batch mode
(30°C)
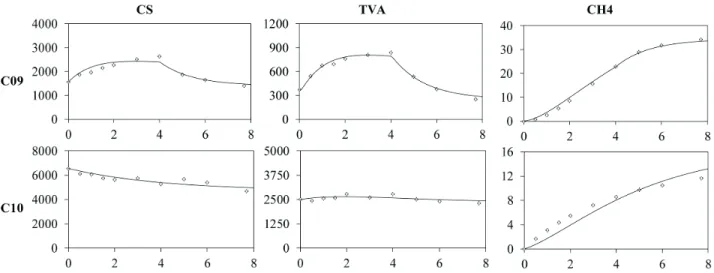
Figures 3 and 4 show the profiles of organic matter concentration, TVA and methane for C01 to C08 (increasing in organic load) and C09 and C10 (change in feed strategy and temperature), as well as the model fitted to the experimental data. The visual analysis leads to the conclusion that the model could represent the tendencies of production and consumption of the presented compounds.
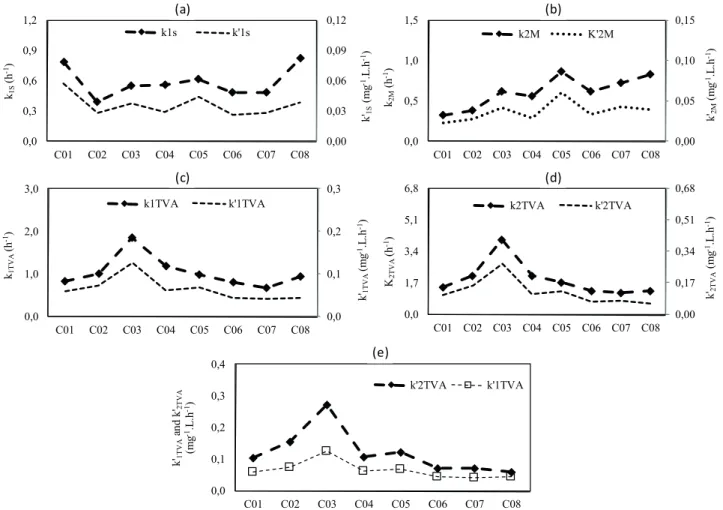
In Table 5, the first-order kinetic parameters for each experimental condition are presented, and in Figure 5, these parameters are presented for Conditions C01 to C08 as a function of organic load. In general, a similar tendency is found for both specific and non-specific kinetic parameters, which indicates that the changes in the environmental conditions are influenced in a similar manner by the individuals and the microbial population.
By analysing k1S and k’1S (Figure 5a), note that an increase in organic load led to a decrease in the organic matter consumption reaction rate in the transition of Condition C01 to C02. Next, considering k1S, a tendency to increase with the increase in organic load (Conditions C02 to C08) is observed, whereas for k’1S, a tendency
for the reaction rate to decrease is observed. The k2M and k’2M generally presented a tendency to increase with load
(Figure 5b). The same tendency can be observed for the molar productivity of methane (MPr) (Table 3), i.e., the increase in the number of molecules produced in relation to the liquid medium is a result of the increase of the average reaction rate of methane production (CMave’) observed in Conditions C01 to C08.
Considering the kinetic equation of the methane production rate, rM = k2M(CTVA-CTVAR), the increase in this reaction rate between the experimental conditions was due to both the increase of the average concentration of TVA, or the increase in substrate concentration, and the improvement in the production of molecules of methane by microorganisms, i.e., by the increase in the parameter k2m (or k’2m).
The parameters k1TVA (or k’1TVA) and k2TVA (or k’2TVA) define, respectively, the rate of production and consumption of TVA at each point of the profiles of TVA and of CS. Based
on the kinetic equation of rate of production or consumption of TVA [rTVA’ = k1TVA(CS - CSR) – k2TVA(CTVA – CATVA)], the production term is due to the constant k1TVA and concentration CS, whereas the consumption term is due to the constant k2TVA and the concentration CTVA.
Figure 5e shows that the parameter k’2TVA was higher
than k’1TVA, thus revealing that consumption of acids was
always higher than their production. The same can be said with regard to the non-specific parameters. Further, the increase in organic load led to a decrease in k’2TVA
relative to k’1TVA so that the parameter values became
similar in Condition 08 (k’1TVA = 0.0433 mg
-1.L.h-1 and
k’2TVA = 0.0585 mg
-1.L.h-1). Thus, if this tendency is
maintained in organic loads greater than that experienced when varying the influent concentration, the consumption term can eventually be overcome by the production term, ultimately leading the process to collapse due to the accumulation of acids.
These results are coherent with the indicators of productivity and yield of methane presented in Table 3. Further, they confirm that the process of degradation improved with the increase in organic load (only by increasing concentration) and validate the hypothesis that the process achieved a maximum level of degradation.
Analysis of the profiles along a cycle in fed-batch mode
(45°C)
For Conditions C08, C09 and C10, based on an analysis of k1S and k’1S, Table 4 indicates that the reaction rate of substrate consumption decreased in fed-batch mode and when the temperature rose (transition between Conditions C08 and C09 and between C08 and C10). Regarding the parameters k2M andk’2M, the change in feed strategy led to an increase in methane production rate, with the kinetic parameters for Condition C09 being similar to those of Condition C08 in batch mode. However, the change in temperature led to a decrease in the rate of methane production.
Using the kinetic equation to determine the variation in TVA for fed-batch mode, [CTVA’ = (F/V) (CTVAf – CTVA) + k1TVA(CS – CSR) – k2TVA(CTVA – CTVAR)], it can be observed that the accumulation term is due to the constant k1TVA, the concentration CS and the TVA that are in the feed, whereas the consumption term is due to the constant k2TVA and the concentration CTVA. For fed-batch mode, because k2TVA (or k’2TVA) was higher than k1TVA (or k’1TVA), the microorganisms consumed more TVA than
was produced. Thus, the accumulation of TVA observed in Figure 4 indicates that microorganisms were not able to consume TVA at a rate higher/equal to the rate at which TVA entered the reactor. The main TFA that enters the reactor is acetate, but Table 4 shows that propionate was the main intermediate that accumulated (~1350 mg/L) at 45°C; therefore, in this condition TVA were consumed at rates slower than they were produced.
Figure 4. Model fi tting (line) to experimental data (dots) for the profi les (cycle time of 8 h) of organic matter (CS), TVA and CH4 for Conditions C09 and C10
Table 5. Kinetic parameters for all experimental conditions.
C01 C02 C03 C04 C05 C06 C07 C08 C09 C10
Increase in Applied Volumetric Organic Load (AVOL) Fed-Batch 45°C
CSf - - - 10251
-CS0 438 797 1205 1633 1800 2473 2839 3496 1559 6559
CTVAf - - - 2026
-CTVA0 118 276 422 525 65 99 147 188 375 2500
CSR 109 167 270 370 121 155 216 197 1400 4700
CTVAR 23.0 32.0 50.0 55.0 42.0 63.0 72.0 63.0 250.0 2300.0
k1S 0.784 0.387 0.548 0.560 0.617 0.482 0.477 0.816 0.693 0.245
k1TVA 0.831 1.007 1.852 1.177 0.977 0.808 0.675 0.934 8.803 0.162
k2TVA 1.450 2.108 4.028 2.102 1.728 1.273 1.182 1.261 16.50 0.556
k2M 0.316 0.374 0.612 0.551 0.828 0.614 0.725 0.830 0.860 0.391
k’1S 0.057 0.028 0.037 0.029 0.044 0.026 0.028 0.038 0.025 0.012
k’1TVA 0.060 0.073 0.125 0.060 0.069 0.044 0.040 0.043 0.322 0.008
k’2TVA 0.105 0.154 0.272 0.108 0.122 0.070 0.070 0.058 0.603 0.027
k’2M 0.023 0.027 0.041 0.028 0.060 0.034 0.043 0.038 0.031 0.019
(1) Organic matter concentrations, biomass and solids in mg.L-1;
(2) Kinetic parameters in h-1 (non-specifi c) and mg-1.L.h-1 (specifi c).
that were better adapted. The temperature change to 45°C can be considered abrupt because there was insuffi cient time for biomass adaptation. Environmental conditions became severe because the reactor was subjected to a change in temperature at a high applied organic load.
At the end of Condition C09, microbial analysis was performed. The predominance of methanogenic bacilli can be observed, and their presence demonstrates that environmental conditions favourable to methanogens were achieved. Methanosaeta was also detected, which
is responsible for the assimilation of acetate (Garcia et al., 2000). The adherence of this microorganism could be favoured by the greater surface area created by the higher sponge porosity.
Comparison to other studies
Biofilm Reactors (ASBR and AnSBBR), with either liquid phase recirculation (LPR) or mechanical stirring (MS), applied to the treatment of other wastewaters (whey and glycerine). These studies and the present paper assessed experimental conditions with cycle times of 4h and 8h, volume of reactor of 3,0 L or 5,0 L and feed strategy of batch and fed-batch. In the present study the applied volumetric organic load covered a wide range of values, and this made possible the comparison with the other papers.
Mockaitis et al. (2006) treated 2 L of whey per cycle with an ASBR (MS). The AVOL was in the range of 1.15 gCOD.L-1.d-1 to 4.79 gCOD.L-1.d-1. The maximum
values of yield, volume and percentage of methane in biogas were, respectively, 5.3 mmolCH4.gCOD-1,
908 NmLCH4 and 61%. Selma et al. (2010) treated 2 L per cycle of an effluent of biodiesel (glycerine) produced in laboratory with an ASBR (MS). The AVOL was in the range of 0.60 gCOD.L-1.d-1 to 3.82 gCOD.L-1.d-1. The maximum
values of yield, concentration, volume and percentage of methane in biogas were, respectively, 11.8 mmolCH4. gCOD-1, 11.8 mmol.L-1
biogas, 232 NmLCH4 and 74%.
Lovato et al. (2012) treated 1.5 L per cycle of an effluent
of biodiesel (glycerine) produced in laboratory with an AnSBR (LPR). The AVOL was in the range of 4.5 gCOD.L -1.d-1 to 7.5 gCOD.L-1.d-1. The maximum values of yield,
concentration, and percentage of methane in biogas were, respectively, 5.3 mmolCH4.gCOD-1, 13.5 mmol.L-1
biogas and
75%. Finally, Silva et al. (2013) treated 1 L and 2 L per cycle of an effluent of biodiesel (glycerine) produced in industry with an ASBR (MS). The AVOL was in the range of 1.23 gCOD.L-1.d-1 to 3.89 gCOD.L-1.d-1. The maximum
values of yield, concentration, volume and percentage of methane in biogas were, respectively, 11.9 mmolCH4. gCOD-1, 13.9 mmol.L-1
biogas, 319 NmLCH4 and 74%.
In general, it can be noted that the ASBR reactor with mechanical stirring treating vinasse presented a better performance than the other reactors treating effluent of biodiesel production (industrial and laboratorial) and whey. In the other studies the yield of methane reached approximately 12 mmolCH4.gCOD-1, but this value is
related to a small AVOL. In the present study the maximum yield of methane (13.5 mmolCH4.gCOD-1) is related to an
AVOL of 6 to 13 times greater. Besides, the increase in AVOL produced an increase in the yield of methane up
0,00 0,03 0,06 0,09 0,12 0,0 0,3 0,6 0,9 1,2
C01 C02 C03 C04 C05 C06 C07 C08
k'1S (mg -1.L .h -1) k1S (h -1) k1s k'1s 0,0 0,1 0,2 0,3 0,0 1,0 2,0 3,0
C01 C02 C03 C04 C05 C06 C07 C08
k'1 T VA (mg -1.L .h -1) k1T V A (h -1) k1TVA k'1TVA 0,00 0,17 0,34 0,51 0,68 0,0 1,7 3,4 5,1 6,8
C01 C02 C03 C04 C05 C06 C07 C08
k'2T V A (mg -1.L .h -1) K2T V A (h -1) k2TVA k'2TVA 0,00 0,05 0,10 0,15 0,0 0,5 1,0 1,5
C01 C02 C03 C04 C05 C06 C07 C08
k'2M (mg -1.L .h -1) k2M (h -1) k2M K'2M 0,0 0,1 0,2 0,3 0,4
C01 C02 C03 C04 C05 C06 C07 C08
k'1T V A and k' 2T V A (mg -1.L .h -1) k'2TVA k'1TVA (a) (b) (c) (d) (e)
to the maximum, while in the other reactors a decrease is generally observed.
In addition to the comparison, it can be noted in the literature that there are some studies assessing vinasse treatment using other reactors, such as UASB and USBF (UASB + anaerobic filter). Molina et al. (2007) treated wine vinasse using a hybrid anaerobic reactor (USBF) on a pilot scale with AVOL of 12 gCOD.L-1.d-1 (in comparison
to 10 gCOD.L-1.d-1 of the present study) and they obtained
a COD removal of 96% and a percentage of methane in biogas of 74%, values that are smaller than that of the present study (98% e 78%, respectively). On the other hand, España-Gamboa et al. (2012) treated vinasse from hydrous ethanol using a modified UASB reactor with an AVOL of 17 gCOD.L-1.d-1 and obtained COD removal of
69%, a value that is smaller than that of the present study. These researchers, in turn, obtained a better percentage of methane in biogas, which was 84%.
CONCLUSIONS
With an increase in the applied volumetric organic load (AVOL) from 1.1 to 10.1 gCOD.L-1.d-1, the methane
productivity increased up to 123.4 molCH4.m-3.d-1 to reach a
maximum yield of 13.5 mmolCH4.gDQO-1 in 8.2 gCOD.L -1.d-1 before decreasing at an AVOL of 10.1 gCOD.L-1.d-1.
In fed-batch operation, these parameters were smaller (max.: 102.5 molCH4.m-3.d-1 and 11.80 mmolCH
4.gDQO -1), and at 45°C, all of the parameters were reduced (max.:
35.0 molCH4.m-3.d-1 and 7.10 mmolCH 4.gDQO
-1). In
general, the methane yield and productivity, the kinetic parameters and the overall factors of the degradation process presented here lead to the conclusion that AnSBBR
performed well in treating vinasse for applied organic loads up to 10.0 gCOD.L-1.d-1 and for concentration up to
10.0 gCOD.L-1.
Thus, it can be noted that the AnSBBR applied to the treatment of vinasse performed better than other batch reactors applied to the treatment of other wastewaters (whey and glycerine), such as ASBR and AnSBBR that employed liquid phase recirculation. On the other hand, it presented similar performance when compared to continuous reactors, such as UASB, achieving better values for some performance parameters.
The fitting of the proposed model to the data and accumulation of intermediate compounds indicate how the process was dependent of the environmental conditions (AVOL), that could become favourable for some microorganisms and unfavourable for others less adapted. Furthermore, a temperature change should be considered only after sufficient time for biomass adaptation.
Further research in the mesophilic range may focus on the assessment of the effects of changing in the organic load on the process by the variation of the ratio between the feed volume and the reactor volume (VF/VR) and by the number of daily cycles (N). Also, it can be suggested that, in the thermophilic range, the effects of changing the organic load on the process be studied by the variation of the influent concentration (CSINF), the ratio VF/VR and the number of daily cycles (N).
ACKNOWLEDGMENTS
The authors thank CNPq, CAPES and FAPESP (09/15.984-0 and 13/23366-0) for the financial support.
NOMENCLATURE
Abbreviation/ symbol Denomination Unit
AnSBBR Anaerobic Sequencing Batch Biofilm Reactor
-ASBR Anaerobic Sequencing Batch Reactor
-COD Chemical oxygen demand (mgCOD.L-1)
VR Volume of liquid into the reactor (L)
VF Volume of wastewater fed per cycle (L.cycle-1)
N Number of cycles per day (cycle.d-1)
tC Time cycle (h)
tF Feeding time (min)
CSINF Organic matter concentration in influent (mgCOD.L-1)
CSf Organic matter concentration in feed (mgCOD.L-1)
CS0 Filtered organic matter concentration at initial time of the cycle (mgCOD.L-1)
CST Non-filtered organic matter concentration (mgCOD.L-1)
CSF Filtered organic matter concentration (mgCOD.L-1)
εST Efficiency of removal of non-filtered organic matter (%)
εSF Efficiency of removal of filtered organic matter (%)
AVOL Applied volumetric organic load, expressed by COD (gCOD.L-1.d-1)
RVOL Removed volumetric organic load, expressed by COD (gCOD.L-1.d-1)
RSOL Removed specific organic load, expressed by COD (gCOD.gTVS-1.d-1)
BA Bicarbonate alkalinity (mgCaCO3.L-1)
TVA Total volatile acids (mgHAc.L-1)
Acetone Acetone concentration (mg.L-1)
MetOH Methanol concentration (mg.L-1)
EtOH Ethanol concentration (mg.L-1)
ButOH N-butanol concentration (mg.L-1)
HAc Acetic acid concentration (mg.L-1)
HPr Propionic acid concentration (mg.L-1)
HIsoBut Isobutyric acid concentration (mg.L-1)
HBut Butyric acid concentration (mg.L-1)
HIsoVal Isovaleric acid concentration (mg.L-1)
HVal Valeric acid concentration (mg.L-1)
HCa Caproic acid concentration (mg.L-1)
TS Total solids (mgTS.L-1)
TVS Total volatile solids (mgTVS.L-1)
TSS Total suspended solids (mgTSS.L-1)
VSS Volatile suspended solids (mgVSS.L-1)
FSS Fixed suspended solids (mgFSS.L-1)
TDS Total dissolved solids (mgTDS.L-1)
VDS Volatile dissolved solids (mgVDS.L-1)
MTVS Mass of total volatile solids in the reactor (g)
CX Mass of total volatile solids per volume of liquid medium (g.L-1)
CX´ Mass of total volatile solids per mass of inert support (g.g-1)
VG Volume of biogas at STP (mL-STP.cycle-1)
VCH4 Volume of methane at STP (mL-STP-CH4.cycle-1)
NCH4 Moles of methane produced (molCH4.cycle-1)
XCH4 Percentage of methane in biogas (%)
XCO2 Percentage of carbonic gas in biogas (%)
YM-CH4/DQO Molar yield of methane from consumed organic matter (mmolCH4. gCOD-1)
YV-CH4/COD Volumetric yield of methane from consumed organic matter (mL-STP-CH4. gCOD-1)
MPr Mol of methane per day and per reactor volume (molCH4.m-3.d-1)
SMPr Mol of methane per day and per reactor TVS (molCH4.kgTVS-1.d-1)
VPr Volume of methane per day and per reactor volume (mL-STP-CH4.L-1.d-1)
SVPr Volume of methane per day and per reactor TVS (mL-STP-CH4.gTVS-1.d-1)
REFERENCES
Arooj, M., Han, S., Kim, S., Kim, D., Shin, H., Effect of HRT
on ASBR converting starch into biological hydrogen. International Journal of Hydrogen Energy, 33, 6509-6514 (2008).
Bagley, D.M., Brodkorb, T.S., Modelling microbial kinetics in an anaerobic sequencing batch reactor – Model development and experimental validation. Water Environment Research, 71, 1320-1332 (1999).
Bezerra, R.A., Rodrigues, J.A.D., Ratusznei, S.M., Canto,
C.S.A., Zaiat, M., Effect of organic load on the performance and methane production of an AnSBBR treating effluent
from biodiesel production. Applied Biochemistry and Biotechnology, 165, 347-368 (2011).
Cassidy, D.P., Hirl, P.J., Belia, E., Methane production from ethanol co-products in anaerobic SBRs. Water Science and Technology, 58, 789-793 (2008).
Cassidy, D.P., Hirl, P.J., Belia, E., Methane production from
the soluble fraction of distillers’ dried grains with solubles
in anaerobic sequencing batch reactors. Water Environment Research, 80, 570-575 (2008).
Cesaro, A., Belgiorno, V., Combined biogas and bioethanol production: opportunities and challenges for industrial application. Energies, 2015, 8, 8121-8144 (2015).
Garcia, J.L.; Patel, B.K.C.; Ollivier, B., Taxonomic, phylogenetic and ecological diversity of methanogenic archaea. Anaerobe, 6, 205-226 (2000).
Kim, S., Han, S., Shin, H., Performance comparison of a
continuous-flow stirred-tank reactor and an anaerobic
sequencing batch reactor for fermentative hydrogen production depending on substrate concentration. Water Science and Technology, 52, 23-29 (2005).
Lovato, G., Bezerra, R.A., Rodrigues, J.A,D., Ratusznei, S.M.,
production. Applied Biochemistry and Biotechnology, 166, 2007-2029 (2012).
Lullio, T.G., Souza, L.P., Ratusznei, S.M., Rodrigues, J.A.D., Zaiat, M., Biomethane production in an AnSBBR treating wastewater from biohydrogen process. Applied Biochemistry and Biotechnology, 174, 1873-1896 (2014).
Massé, D.I., Croteau, F., Masse, L., Danesh, S., The effect of
scale-up on the digestion of swine manure slurry in psychrophilic anaerobic sequencing batch reactors. Transactions of the ASAE, 47, 1367-1374 (2004).
Michelan, R., Zimmer, T.R., Rodrigues, J.A.D., Ratusznei, S.M.,
de Moraes, D., Zaiat, M., Foresti, E., Effect of impeller type
and mechanical agitation on the mass transfer and power consumption aspects of ASBR operation treating synthetic wastewater. Journal of Environmental Management, 90, 1357-1364 (2009).
Mockaitis, G., Ratusznei, S. M., Rodrigues, J. A., Zaiat, M., Foresti, E., Anaerobic whey treatment by a stirred
sequencing batch reactor (ASBR): effects of organic loading
and supplemented alkalinity. Journal of environmental management, 79 (2), 198-206 (2006).
Ndegwa, P.M., Hamilton, D.W., Lalman, J.A., Cumba, H.J., Optimization of anaerobic sequencing batch reactors treating dilute swine slurries. Transactions of the ASAE, 48, 1575-1583 (2005).
Pant, D., Adholeya, A., Biological approaches for treatment of distillery wastewater: A review. Bioresource Technology, 98, 2321-2334 (2007).
Rodrigues, J.A.D., Pinto, A.G., Ratusznei, S.M., Zaiat, M., Gedraite, R., Enhancement of the performance of an anaerobic sequencing batch reactor treating low strength wastewater through implementation of a variable stirring rate program. Brazilian Journal of Chemical Engineering, 21, 423-434 (2004).
Ruíz, C., Torrijos, M., Sousbie, P., Lebrato Martínez, J., Moletta, R., Delgenès, J., Treatment of winery wastewater by an anaerobic sequencing batch reactor. Water Science and Technology, 45, 219-224 (2002).
Santos, J.D., Silva, A.L., Costa, J.L., Scheidt, G.N., Novak, A.C., Sydney, E.B., Soccol, C.R., Development of a vinasse nutritive solution for hydroponics. Journal of Environmental Management, 114, 8-12 (2013).
Selma, V.C., Cotrim, L.H.B., Rodrigues, J.A.D., Ratusznei, S.M., Zaiat, M., Foresti, E., ASBR applied to the treatment
of biodiesel production effluent: effect of organic load and fill time on performance and methane production. Applied
Biochemistry and Biotechnology, 162, 2365-2380 (2010).
Silva, R.C., Rodrigues, J.A.D., Ratusznei, S.M., Zaiat, M., Anaerobic treatment of industrial biodiesel wastewater by an ASBR for methane production. Applied Biochemistry and Biotechnology, 170, 105-118 (2013).
Vlissidis, A., Zouboulis, A., Thermophilic anaerobic digestion of alcohol distillery wastewaters. Bioresource Technology, 43, 131-140 (1993).
Wilkie, A.C., Riedesel, K.J., Owens, J.M., Stillage characterization and anaerobic treatment of ethanol stillage from conventional and cellulosic feedstocks. Biomass and Bioenergy, 19, 63-102 (2000).
Zaiat, M., Cabral, A.K.A., Foresti, E., Horizontal-flow anaerobic
immobilized sludge reactor for wastewater treatment: conception and performance evaluation. Brazilian Journal of Chemical Engineering, 11, 33-42 (1994).