Submitted8 June 2015 Accepted 6 January 2016 Published18 February 2016
Corresponding author Suzanna M. Evans, [email protected]
Academic editor Robert Toonen
Additional Information and Declarations can be found on page 17
DOI10.7717/peerj.1633
Copyright 2016 Evans et al.
Distributed under
Creative Commons CC-BY 4.0
OPEN ACCESS
Genotypic richness predicts phenotypic
variation in an endangered clonal plant
Suzanna M. Evans1,2, Elizabeth A. Sinclair3,4, Alistair G.B. Poore2, Keryn F. Bain2
and Adriana Vergés1,2
1Centre for Marine Bio-Innovation, University of New South Wales, Sydney, New South Wales, Australia 2Evolution & Ecology Research Centre, University of New South Wales, Sydney, New South Wales, Australia 3School of Plant Biology and Oceans Institute, University of Western Australia, Perth, Western Australia,
Australia
4Science Directorate, Botanic Gardens and Parks Authority, West Perth Western Australia, Australia
ABSTRACT
Declines in genetic diversity within a species can affect the stability and functioning of populations. The conservation of genetic diversity is thus a priority, especially for threatened or endangered species. The importance of genetic variation, however, is dependent on the degree to which it translates into phenotypic variation for traits that affect individual performance and ecological processes. This is especially important for predominantly clonal species, as no single clone is likely to maximise all aspects of performance. Here we show that intraspecific genotypic diversity as measured using microsatellites is a strong predictor of phenotypic variation in morphological traits and shoot productivity of the threatened, predominantly clonal seagrass Posidonia australis, on the east coast of Australia. Biomass and surface area variation was most strongly predicted by genotypic richness, while variation in leaf chemistry (phenolics and nitrogen) was unrelated to genotypic richness. Genotypic richness did not predict tissue loss to herbivores or epiphyte load, however we did find that increased herbivore damage was positively correlated with allelic richness. Although there was no clear relationship between higher primary productivity and genotypic richness, variation in shoot productivity within a meadow was significantly greater in more genotypically diverse meadows. The proportion of phenotypic variation explained by environmental conditions varied among different genotypes, and there was generally no variation in phenotypic traits among genotypes present in the same meadows. Our results show that genotypic richness as measured through the use of presumably neutral DNA markers does covary with phenotypic variation in functionally relevant traits such as leaf morphology and shoot productivity. The remarkably long lifespan of individual Posidoniaplants suggests that plasticity within genotypes has played an important role in the longevity of the species. However, the strong link between genotypic and phenotypic variation suggests that a range of genotypes is still the best case scenario for adaptation to and recovery from predicted environmental change.
SubjectsBiodiversity, Ecology, Genetics, Plant Science
INTRODUCTION
The link between biodiversity and ecosystem function is well-established at the species level, with communities that support a wide range of species often better able to stabilise multiple ecosystem processes in response to disturbance or change than species poor communities (Loreau et al., 2001;Hooper et al., 2005;Stachowicz, Bruno & Duffy, 2007;
Tilman, Reich & Isbell, 2012;Cardinale et al., 2013;Lefcheck et al., 2015). Similarly, genetic diversity within species, as measured by the number of genotypes, can enhance productivity (Aguirre & Marshall, 2012), increase resilience (Massa et al., 2013) and have cascading benefits to the surrounding ecosystem (Hughes et al., 2008;Ellers, 2009). The importance of genetic variation to ecosystem functioning, however, depends on the degree to which it translates into variation in traits that affect the functioning of individuals, and upon which natural selection can act (Foster Huenneke, 1991;Vasemägi & Primmer, 2005;Bolnick et al., 2011). Therefore, it is necessary to quantify the degree of phenotypic variation among genotypes within species to better predict how loss of genotypes can affect the performance of populations (Lande & Shannon, 1996;Ellers, 2009;Forsman & Wennersten, 2015), particularly during periods of changing climatic conditions and increased anthropogenic stressors (Best, Stone & Stachowicz, 2015).
The conservation of genetic diversity is a priority for the management of threatened or endangered species, with the aim of maintaining evolutionary viability by maximising the chances of persistence in the face of environmental change (Foster Huenneke, 1991;
Reed & Frankham, 2003;Hughes et al., 2008). For species that have naturally low levels of genetic variation due to predominantly clonal life history strategies, differences in functioning among the few genotypes present becomes especially important. It may be that only the most diverse assemblage will be able to maximise multiple ecosystem functions (Duffy, Richardson & Canuel, 2003), which suggests that a loss in diversity may significantly influence ecosystem properties. The theory that higher species diversity benefits ecosystem ‘multifunctionality’ stems from the observation that species that do not contribute to one ecosystem process often play an important role in a separate process and/or under different conditions (Bradford et al., 2014;Byrnes et al., 2014;Lefcheck et al., 2015). Similarly, it is highly unlikely that any single genotypic clone, no matter how well-adapted, would be able to capitalise on all aspects of performance. Rather, it is expected that multiple genotypes will contribute to multiple different processes and/or thrive under different conditions.
remain constant), differences in the success of particular genotypes, as well as genetic drift, can lead to an overall decrease in genet number over time and the dominance of one or a few clones (McLellan et al., 1997;Eckert, 2002;Balloux, Lehmann & De Meeûs, 2003). In changing environments, however, persistence should be enhanced by the maintenance of genetic variation via occasional seed production or the recruitment of new sexually produced individuals (Eckert, 2002;Honnay & Bossuyt, 2005). Otherwise, the population is assumed to be at much greater risk of extinction if environmental conditions change, compared to a genetically diverse population of conspecifics. In this study, we examine the relationship between genetic diversity, variation in phenotype, and ecosystem processes in predominantly clonal, threatened seagrass meadows that range from near-monoclonal to genotypically diverse.
Seagrasses are a major source of primary productivity supporting food webs globally (Mateo et al., 2006;Hughes, Stachowicz & Williams, 2009), with an estimated value of over $US28, 000 ha−1year−1(adjusted for inflation;Costanza et al., 1997). Seagrass meadows also act as significant ‘blue carbon’ stores (Fourqurean et al., 2012) and have cascading benefits to surrounding ecosystems (Duffy, 2006;Barbier et al., 2011). Unfortunately, sea-grasses are rapidly declining worldwide and are now rated amongst the most threatened ecosystems on the planet (Waycott et al., 2009). Over the past decade, manipulations of genotypic diversity and identity inZostera marinaseagrass meadows from the Northern Hemisphere have shown that increasing the number of genotypes within an experimental plot can enhance resistance to disturbance by grazers (Hughes & Stachowicz, 2004), influence grazer biomass (Hughes, Best & Stachowicz, 2010), and result in greater shoot densities and biomass compared to monocultures during disturbance events (Reusch et al., 2005;Hughes & Stachowicz, 2011). Experimental manipulations of clonal identity have shown wide variation in biomass production and herbivore susceptibility among individual genotypes that can be similar in magnitude to the variation caused by environ-mental factors (e.g., nitrogen loading;Tomas et al., 2011). The positive effects of higher genotypic richness can be attributed to a combination of (i) complementarity among individual genotypes, in which the environment is exploited more efficiently by including a wider variety of functionally important phenotypes, and (ii) the sampling effect, in which there is simply a statistically higher probability of selecting pre-adapted phenotypes from a more diverse group (Hughes et al., 2008;Hughes & Stachowicz, 2011;Forsman & Wennersten, 2015). However, despite the obvious link between genotypic diversity and the performance and functioning of seagrass meadows, there is a lack of information regarding the mechanisms by which this relationship occurs.
The majority of studies that have manipulated genotypic diversity in seagrass meadows have identified genotypes using allozymes or microsatellite DNA markers that are
hybrid complexes, e.g.,Whitham et al., 2006). However, in cases where the conservation of a species may be dependent on the ability to respond positively to stress and adapt to new and potentially challenging conditions, variation in both genotype and phenotype needs to be considered (Hughes, 2014).
On the east coast of Australia, meadows of the temperate seagrass speciesPosidonia australisHook.f. vary widely in genetic diversity; from predominantly clonal to moderate genetic diversity (with sexual reproduction;Evans et al., 2014). As such, it provides an ideal model ecosystem to explore whether genetic diversity can predict variation in phenotypic and ecosystem processes. The rapid decline inPosidonia australismeadows associated with human population growth and urbanisation (NSW Department of Primary Industries, 2012;West, 2012) has increased the need to identify mechanisms behind variation in meadow form and function, so that we can better tailor our efforts to identify meadows at risk of extinction, as well as more successful avenues for restoration.
In this study, we quantified the relationship between genotypic richness and traits of Posidonia australisthat are considered functionally important at the ecosystem level; plant productivity, leaf structure and chemistry, epiphyte load, and tissue loss to herbivory. Structural leaf traits (morphology, biomass and shoot density) provide a measure of habitat structure and complexity (Middleton et al., 1984). They also influence trophic interactions by providing shelter for both predators and prey (Farina et al., 2009) and are known to change in response to environmental stressors (Waycott, Longstaff & Mellors, 2005). Leaf chemical constituents such as nitrogen and phenols affect decomposition rates and photosynthetic capacity (Harrison, 1989;Alcoverro, Manzanera & Romero, 2001) and influence susceptibility to grazing (Goecker, Heck & Valentine, 2005;Vergés et al., 2007). Elevated epiphyte loads have been linked to human-induced eutrophication, can be potentially fatal to seagrasses by reducing light availability (Borowitzka, Lavery & Van Keulen, 2006), and are thus considered important indicators of ecosystem health (Wood & Lavery, 2000). Finally, tissue loss to herbivores is an important process that transfers energy to higher trophic levels and can influence the distribution and growth patterns of seagrasses (Valentine & Duffy, 2006). More specifically, our study addressed the following questions:
1. Does genotypic diversity inP. australismeadows predict phenotypic variation? 2. Are genotypically diverse meadows more productive?
3. Is genotypic diversity related to herbivory/epiphyte load?
4. What is the relative importance of genotypic identity and the environment in explaining phenotypic variation?
MATERIALS AND METHODS
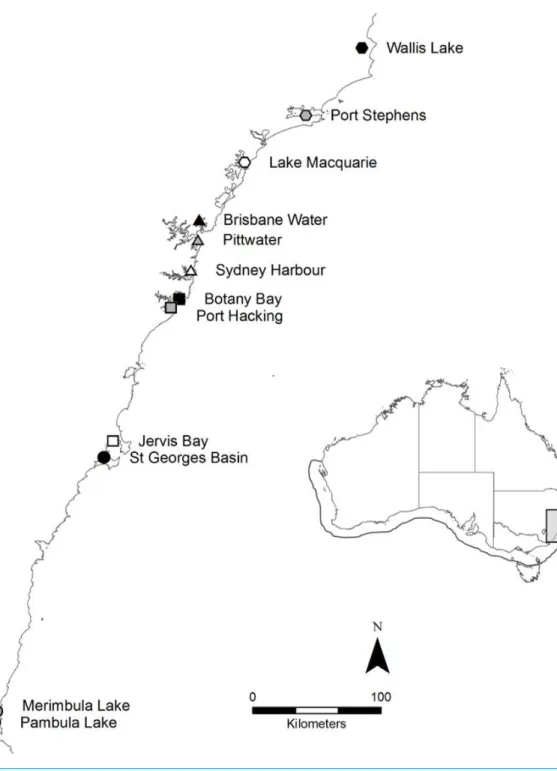
Study species and locationaustralisis in rapid decline, particularly on the eastern coastline of Australia, where it has been formally listed as endangered in six estuaries (NSW Department of Primary Industries, 2012). In 2011, 360 individual shoots were collected from 12 geographically distinct meadows (n=30 per meadow) across New South Wales (NSW) on the east coast of Australia, including the extreme northern range-edge of the species (Fig. 1). Shoots were collected once every 2–3 m along a linear transect, to reduce the chances of resampling the same genetic individual (Evans et al., 2014). Sample collections were supported by a NSW Department of Primary Industries Scientific Collection Permit (P11/0059-1.2).
Genetic diversity
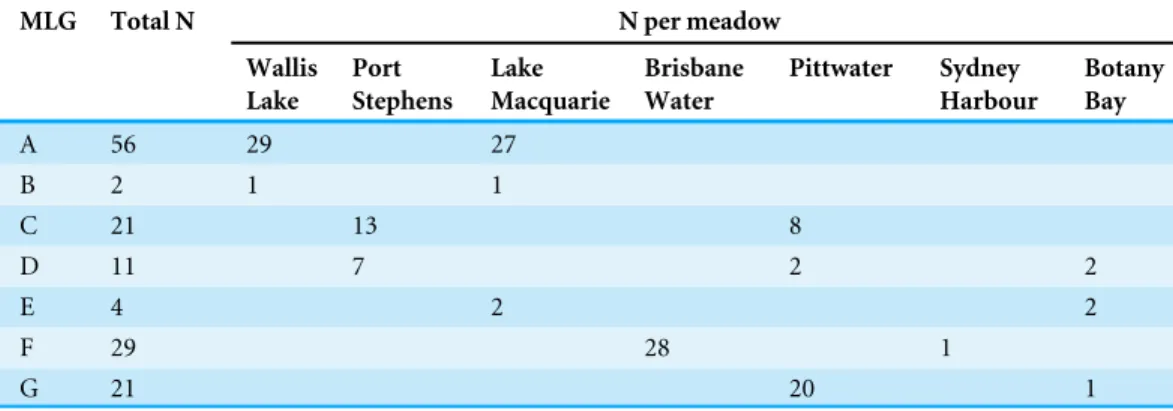
Immediately after collection, shoots were placed on ice and returned to the laboratory. A set of eight polymorphic microsatellite markers (developed bySinclair et al., 2009) were used to determine levels of genetic diversity within and among the 12P. australis meadows sampled. Following amplification (seeEvans et al., 2014for full protocol), multiple PCR products were combined where possible (pre-determined by size and label) and run on a CEQ 8800 Genetic Analysis System (Beckman Coulter). Size standard 400 was used to determine allele sizes, which were then scored using the Beckman Coulter software. The number of unique multilocus genotypes (MLGs) and alleles per meadow were estimated using GenClone 2.0 (Arnaud-Haond & Belkhir, 2007), as well as the likelihood of individual genotypes arising through sexual recombination given allelic frequencies in the regional population (Pgen). Allelic richness ranged from 10 to
20 alleles per meadow, while genotypic richness ranged from as few as two MLGs per meadow (near-monoclonal) through to 21 MLGs per meadow (high diversity). In total, 79 unique MLGs were identified from the 360 shoots sampled. Of these, seven MLGs were shared across two or more meadows (Table 1), while the remainder were unique to their sample locations. For all genotypesPgenwas <0.02, allowing us to conclude that
individual shoots sharing the same genotype are highly unlikely to have arisen through sexual recombination (Arnaud-Haond & Belkhir, 2007).
Phenotypic diversity
Shoots collected for genotyping were measured for traits relating directly to the shoot phenotype (leaf surface area, biomass, nitrogen content, and total phenolics), as well as traits considered important for ecosystem functioning (productivity, herbivory, and epiphyte biomass). In addition, shoot density and herbivorous fish counts were done within each meadow.
In the laboratory, epiphytes were carefully removed from the leaves with a razor blade. While some shoots retained small quantities of encrusting epiphytes on the oldest leaves, this did not impact morphometric measurements, and these leaves were not included in chemical analyses. Morphometric measurements were made on all leaves present (generally between 2–5 leaves per shoot), from the ligule to the leaf tip. Surface area of all leaves was calculated as mm2shoot−1, minus any damage due to herbivory. The leaf
Figure 1 Map of the twelve sample locations in New South Wales, Australia.The full distribution of
P. australisis represented by the outline on the inlaid map. The∼600 km of coastline sampled on along the east coast is highlighted by the light grey box.
freeze-drying and then weighing. Any attached rhizome was not included as the amount collected varied widely between shoots. Meristematic tissue below the ligule was also excluded as this was removed for DNA analysis.
Shoot density was determinedin situusing a 0.25 m2quadrat in which all individual
Table 1 Frequency of the seven shared multilocus genotypes in New South Wales meadows.Frequency of the seven shared multilocus genotypes (MLGs) originally identified inEvans et al. (2014). These seven MLGs are arbitrarily named using the letters A–G. The frequency with which they occur in each meadow is shown in the columns titled ‘N per meadow’. The meadows in which these shared genotypes are found are listed. All remaining MLGs not listed were unique to their sample location. Four meadows not listed here contained only unique MLGs.
MLG Total N N per meadow
Wallis Lake
Port Stephens
Lake Macquarie
Brisbane Water
Pittwater Sydney
Harbour
Botany Bay
A 56 29 27
B 2 1 1
C 21 13 8
D 11 7 2 2
E 4 2 2
F 29 28 1
G 21 20 1
meadow to obtain a mean shoot density per meadow. Quadrat data were recorded at the same time and within the same meadow area as the genetic sampling. Productivity per shoot was measured with lepidochronology, which uses patterns in the thickness of leaf sheaths retained on the rhizome from old leaves to estimate the rate of new leaf production over time, recorded as dry weight (mg shoot−1year−1). This method is
considered an accurate way of determining long-term annual productivity of seagrasses in thePosidoniagenus (Pergent, Pergent-Martini & Cambridge, 1997;Peirano, 2002). As our study is concerned with long-term productivity, this method was used in favour of leaf-marking, which provides a snapshot of leaf productivity at the time of sampling (Short & Duarte, 2001). We followed the methods ofPergent et al. (2004), by detaching and numbering the dead leaf sheaths from oldest to youngest and measuring cross sections under the microscope to record the distinct cyclical variations in width (one cycle=one chronological year). Due to the high number of leaf sheaths present on every shoot, a subset of ten shoots per meadow was used to conduct the lepidochronology measures. Primary productivity (PI) was estimated using the formula PI=N×L×D. WhereN is the number of leaves produced annually (number of sheaths per cycle),Lis the mean leaf length andDis the mean leaf density (leaf weight per unit length).
1998); in this case, nitrogen content and total phenols. Samples were processed and spectra were collected following the methods outlined inBain, Vergés & Poore (2013). Prediction models were developed by calibrating NIRS spectra from a subset of samples against laboratory reference values using WinISITM III software (Infrasoft International, State College, PA). Reference values for nitrogen content were determined by combustion using a CHN analyser (TruSpecR Micro Series, Michigan). The concentration of total phenols was obtained colorimetrically using the Folin-Ciocalteu’s method (Singleton, Orthofer & Lamuela-Raventós, 1999;Ainsworth & Gillespie, 2007) with a gallic acid standard. Prediction models fromBain, Vergés & Poore (2013)forP. australiswere then used to estimate nitrogen (% dry weight, modelR2=0.95) and total phenols (gallic acid equivalent (GAE) % dry
weight, modelR2=0.92) in the full set of samples.
Herbivory was measured indirectly on each shoot as the area of leaves missing due to herbivore damage (mm2shoot−1). Missing leaf tips were not included in these calculations as we were unable to distinguish between area lost due to damage sustained during harvesting or storm activity/erosion and true herbivory.
To assess whether differences in tissue loss to herbivory were explained by differences in herbivore abundance among sites (rather than seagrass traits), herbivore abundance was measured within each of the 12 meadows using a combination of three methods: visual transects (Greene & Alevizon, 1989), beach seine netting (Connolly, 1994), and benthic sleds (Colman & Segrove, 1955). Each method was replicated three times per meadow. Visual transects were conducted via snorkel, swimming in a straight line for 50 m (marked with weighted measuring tape). All fish within 2 m on either side of the measuring tape were recorded. A benthic sled was towed by hand along the seagrass canopy at a constant depth of 1 m. The trawls were 100 m in length and were towed for approximately 3.5 min (a speed of about 1 knot depending on prevailing conditions). The trawl frame consisted of a stainless steel sled with an opening frame measuring 80×40 cm. This was attached to a conical net measuring 2.4 m in length, with the cod end tapering to 105 mm in diameter (securely fastened during each trawl). Each trawl was hauled by one person at the end of a long tow rope in a line parallel to the shore (seeColman & Segrove, 1955). The beach seine net used was 20 m in length (3 m cod end) with a 2 m drop. The net was towed through 1 m of water directly over the seagrass canopy by two people standing parallel to the shore for a distance of 50 m. Nets for both the benthic sled and beach seine were made from 5 mm mesh. All fish caught in the nets were photographed for later identification and returned to the water. Herbivorous fish abundance per meadow was then standardised using catch per unit effort (CPUE).
Statistical analyses
Linear regression was used to determine whether genotypic richness could predict the variation in phenotypic traits (as measured by the CV for surface area, shoot biomass, productivity, phenolics, nitrogen, herbivory and epiphyte biomass). For each trait, the mean CV (±SE) across shoots within a meadow was used. Linear regression analyses were also used to determine potential relationships between genotypic richness and average values for the aforementioned phenotypic traits. To ensure that a linear relationship was the most appropriate fit for the data, we used Akaike’s information criterion to compare the best-fit of linear, polynomial and logarithmic regressions.
It is important to note that that an interdependency may exist between genotypic and allelic richness when attempting to estimate the importance of genetic diversity, particularly at low genotypic richness levels (Massa et al., 2013). As such, we ran additional linear regression analyses to explore potential relationships between allelic richness per meadow and phenotypic trait means and variation.
To investigate the proportion of phenotypic variation explained by genotypic identity and the environment, we compared (i) variation within and among replicate genotypes in individual meadows, and (ii) variation within and among meadows in MLGs occurring across more than one location. Although we found seven MLGs that were shared across two or more sites (Table 1), only two of these MLGs (‘Genotype A’ and ‘Genotype C’) had enough replicates both within and across meadows to compare this variation with sufficient statistical power. We used a series of one-way ANOVAs to compare variation within Genotypes ‘A’ and ‘C’ across the two meadows in which each occurred (Genotype A in Lake Macquarie/Wallis Lake, and Genotype C in Port Stephens/Pittwater) to determine the amount of phenotypic variation explained by environment (meadow). As genotypes ‘A’ and ‘C’ were not found in the same locations, a factorial ANOVA testing for the effect of genotype, environment and genotype by environment interactions was not possible. The meadows at Port Stephens and Pittwater each contained enough individual replicated genotypes to compare how phenotypic traits varied within and among different MLGs in the same meadow. In this way we could determine the amount of phenotypic variation explained by genotype not confounded by differences in the environment. Again, separate analyses had to be used for the two meadows as these genotypes were not shared across locations.
RESULTS
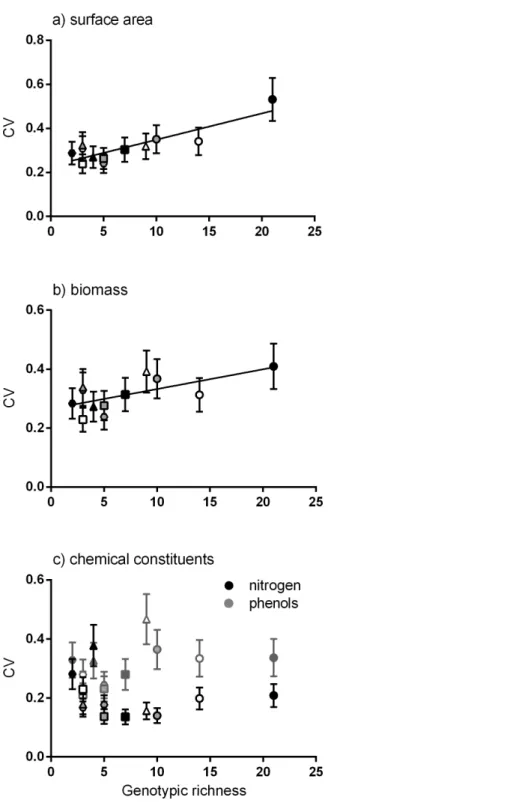
Positive linear relationships were found between the number of genotypes per meadow and the mean of the coefficient of variation for four traits (surface area, biomass, productivity and epiphyte load). Considering each trait alone, the strongest positive linear relationship was between genotypic richness and variation in surface area (Fig. 2A). Similarly, greater variation in biomass per shoot was significantly related to high genotypic richness (Fig. 2B). There were no significant relationships between genotypic richness and variation in nitrogen content or total phenols (Fig. 2C). The relationship between mean shoot density and genotypic richness was also not significant (Fig. S1).
Figure 2 Relationship between genotypic richness and variation in surface area, biomass and chem-ical constituents.The relationship between genotypic richness and phenotypic dissimilarity (measured as the coefficient of variation or CV) for (A) surface area (mm2shoot−1); (B) biomass (mg dw shoot−1); and (C) chemical constituents (GAE % dw shoot−1). Significant relationships from linear regression were found between genotypic richness and the coefficients of variation for surface area (A;R2=0.75,P < 0.001) and shoot biomass (B;R2=0.43,P=0.02). There were no significant relationships between geno-typic richness and the coefficients of variation for nitrogen or phenols (C;R2=0
.04,P=0.56;R2=0.20,
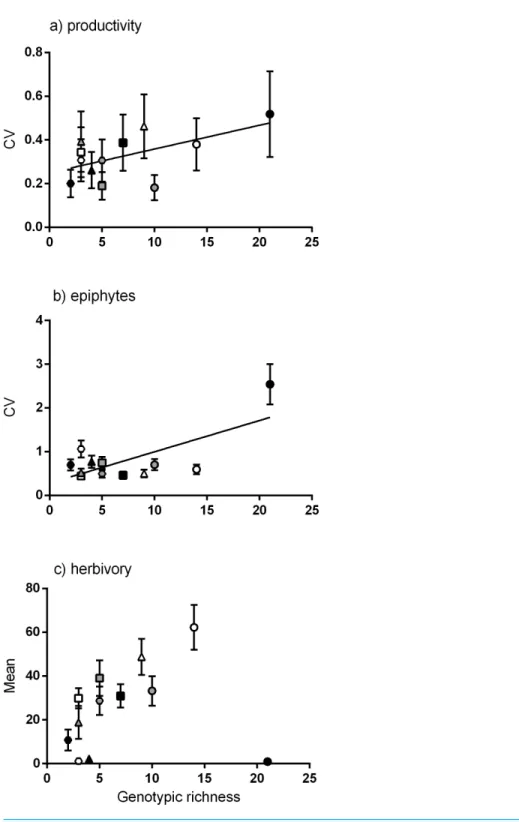
genotypic richness andvariationin shoot productivity (Fig. 3A), denoting a greater range of productivity values in the meadows with more genotypes. To test whether the meadows with greatest numbers of genotypes showed greater capacity for high shoot productivity, we performed a quantile regression on the raw productivity data (Fig. S2). We detected no significant increase in the highest levels of shoot productivity (values in the 90th percentile) with greater genotypic richness, but did detect a negative relationship between genotypic richness and the likelihood of having low productivity shoots (the 10th percentile;Fig. S2).
Of the community traits measured, a significant linear relationship was found between genotypic richness and variation in epiphyte biomass (Fig. 3B). Genotypic richness and mean herbivory levels showed no significant linear relationship (Fig. 3C). While there were no significant non-linear relationships found either, there is a clear increase in mean herbivory with genotypic richness up to 14 genotypes, after which there is a drop in mean herbivory to near zero at the highest level of diversity (21 genotypes,Fig. 3C). This is not a direct result of the number of herbivores per meadow (rather than genotypes) as the relationship between herbivore abundance (CPUE) and mean herbivory (Fig. S3) does not match that between herbivory and genotypic richness (Fig. 3C). This relationship was also tested using the diversity (Shannon diversity index) of herbivorous fish and mean herbivory, and the result was also non-significant (R2=0
.01,P=0.78). As epiphytic
biomass may be related to levels of herbivory (Heck & Valentine, 2006), the relationship between these variables was also explored. However, there was no relationship between tissue loss to herbivory and epiphyte load (R2=0.14,P=0.24), nor was there a relationship
between the abundance of herbivorous fish and epiphyte load (R2=0.05,P= 0.47).
There were no significant linear relationships between the mean values of each phenotypic trait measured and genotypic richness. That is, despite significant relationships between genotypic richness and variation in some plant traits, shoots were not significantly larger on average in meadows with more genotypes, nor did they grow more densely (Fig. S4).
Additional linear regression analyses were conducted to explore potential relationships between allelic richness per meadow and phenotypic trait means and variation. There were no significant relationships observed between allelic richness and variation in any of the traits measured. Similarly, there were no significant relationships observed between allelic richness and trait means, with the exception of mean tissue lost to herbivory, which significantly increased with increasing allelic richness (R2=0.39;P=0.03;Fig. S5).
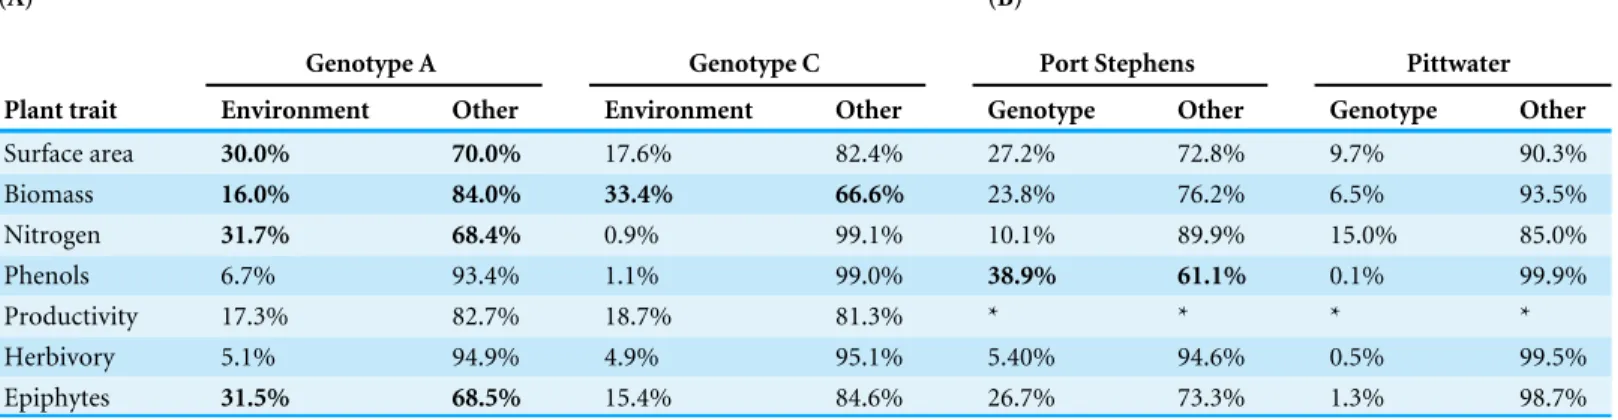
Environment (i.e., meadow) explained between 16–33% of phenotypic variation in the two MLGs that occurred across two geographically distinct meadows (Table 2; ‘Genotype A’ occurring in both Wallis Lake and Lake Macquarie, and ‘Genotype C’ occurring in both Port Stephens and Pittwater;Table 1). For Genotype A, there were significant differences between meadows in surface area, biomass, leaf nitrogen content and epiphyte load across the two locations. For Genotype C, the results revealed no significant differences in any of the phenotypic traits measured for this genotype (Table 2A), with the exception of biomass, which was significantly lower in Pittwater than in Port Stephens (F1,20=9.51,P=0.005).
Table 2 Percentage of variation attributable to environment and genotype.The percentage of variation attributable to environment (meadow) and genotype for (A) the genotypes (A and C) that were shared between locations, and (B) for the two locations in which several replicated genotypes occurred (four within Port Stephens and two within Pittwater). For each trait, the percentage of variation explained by the factor and the residual (other) was calculated from least squares variance components following one way ANOVA. Significant effect of the ANOVAs (P-values <0.05) are in bold. Asterisks represent missing data.
(A) (B)
Genotype A Genotype C Port Stephens Pittwater
Plant trait Environment Other Environment Other Genotype Other Genotype Other
Surface area 30.0% 70.0% 17.6% 82.4% 27.2% 72.8% 9.7% 90.3%
Biomass 16.0% 84.0% 33.4% 66.6% 23.8% 76.2% 6.5% 93.5%
Nitrogen 31.7% 68.4% 0.9% 99.1% 10.1% 89.9% 15.0% 85.0%
Phenols 6.7% 93.4% 1.1% 99.0% 38.9% 61.1% 0.1% 99.9%
Productivity 17.3% 82.7% 18.7% 81.3% * * * *
Herbivory 5.1% 94.9% 4.9% 95.1% 5.40% 94.6% 0.5% 99.5%
Epiphytes 31.5% 68.5% 15.4% 84.6% 26.7% 73.3% 1.3% 98.7%
except for total phenolics in Port Stephens (Table 2B;F3,22=4.67,P=0.011). In that case, approximately 39% of the variation observed was explained by genotype.
DISCUSSION
Our results clearly demonstrate that intraspecific genotypic diversity is a strong predictor of phenotypic variation in multiple functionally important traits of the endangered clonal seagrass, Posidonia australis. Genotypic richness most strongly predicted variation in morphological traits (surface area and biomass), as well as variation in shoot productivity of individual seagrass meadows.
Genetic variation should only be advantageous to a population if it translates into phenotypic variation; the raw material for evolution by natural selection (Foster Huenneke, 1991). Although the microsatellite loci used in this study are assumed to come from non-coding (neutral) regions of the genome, our results suggest that these genetic markers adequately reflect variation in genes coding for quantitative traits, such as leaf morphology and productivity. This variation should be especially important for predominantly clonal species like P. australisbecause it is highly unlikely that a single clone would be able to capitalise on all levels of performance. Rather, it is more likely that individual genotypes that do not contribute to one ecosystem process may play an important role in a separate process and/or under different conditions (as observed in studies of species diversity; (Duffy, Richardson & Canuel, 2003;Bradford et al., 2014;Byrnes et al., 2014;Lefcheck et al., 2015)). Correspondingly, our results suggest that a variety of genotypes and corresponding phenotypes is the best case scenario for adaptive capacity in terms of both responding to change and recovering from disturbance (Hughes & Stachowicz, 2004;Reusch et al., 2005;
Ehlers, Worm & Reusch, 2008;Hughes & Stachowicz, 2011;Hughes, 2014).
Crutsinger et al., 2006; Kotowska, Cahill & Keddie, 2010; Hughes & Stachowicz, 2011;
Drummond & Vellend, 2012). However, we did not find a clear relationship between mean shoot productivity and genotypic richness. Interestingly, we found that the variation of productivity values was significantly greater in more genotypically diverse meadows (Fig. 3A). While productivity was more variable, we did not find that the capacity for high shoot productivity was any greater in meadows with more genotypes (i.e., the highest values of productivity in these meadows were no higher than those in meadows with few genotypes). These results may be reflecting a sampling effect (Wardle, 1999), meaning that there is a higher probability of selecting a wider variety of phenotypes from a more diverse group (Hughes et al., 2008;Forsman & Wennersten, 2015). As such, we may expect that, on average, populations with a higher genetic diversity may be more likely to include genotypes with a wider range of productivity values (both higher and lower than the expected average).
The relationship between genotypic richness and tissue loss to herbivory appeared to be non-linear, with the greatest amount of herbivore damage occurring at intermediate levels of genotypic richness, after which there is a marked drop in herbivory at the meadow of highest diversity (St. Georges Basin; 21 MLGs). This drop in herbivory is consistent with studies that report a greater resistance to herbivory in more genotypically diverse plant communities (Hughes & Stachowicz, 2004;McArt & Thaler, 2013). While we did not find any significant relationships between genotypic richness and herbivory, we did find a positive linear relationship between allelic richness and herbivory. This discrepancy between diversity measures can be attributed to the meadow at St. Georges Basin, which had the highest genotypic richness of all meadows sampled, but had intermediate allelic richness (15 alleles per meadow), compared to other locations which had up to 20 alleles per meadow (Pambula Lake, Sydney Harbour and Port Hacking). The interdependent relationship between allelic richness and genotypic richness is considered important in the context of resilience and adaptive capacity of seagrasses (Massa et al., 2013;Jahnke, Olsen & Procaccini, 2015), and the effects of these two sources of genetic diversity are often hard to disentangle at low levels of genotypic richness (Massa et al., 2013). Overall, our results suggest that an increase in genetic diversity is related to increased tissue loss to herbivory. Similar findings of increased host plant genetic diversity influencing levels of herbivore damage have been reported for experimental manipulations of terrestrial plants (e.g.,Castagneyrol et al., 2012;Barton et al., 2015). In these examples, it was concluded that complementarity among genotypes, rather than the selection effect, was the mechanism behind increased insect herbivory in genetically diverse plots, with assemblages of different genotypes benefiting polyphagous herbivores (Castagneyrol et al., 2012), and different feeding guilds (Barton et al., 2015). In both cases, genetic diversity was a poor predictor of herbivore abundance.
Basin). This relationship should therefore be interpreted with caution, particularly given the high temporal variability in epiphytic growth at the locations sampled.
Seagrasses of the genus Posidoniaare considered phylogenetically conservative, with low resolution among the eight Australian species across multiple chloroplast and nuclear coding gene regions (Aires et al., 2011). Despite this, seagrasses within this group are thought to have existed for more than 60 million years (Aires et al., 2011) in highly variable physical conditions around the temperate Australian coastline. TheP. australismeadows on the east coast of Australia are presumably long-established (since sea levels stabilised ∼6,500 years ago following the last glacial maximum), but are highly fragmented and hence unlikely to experience any contemporary gene flow via pollen or seed dispersal (Evans et al., 2014). The clones existing within these locations are thus assumed to be highly plastic and capable of withstanding local environmental changes. Although our study shows that phenotypic variation is greatest in the most genotypically diverse meadows, we also detected some phenotypic variation in meadows that are nearly monoclonal (meadows dominated by a single MLG; Wallis Lake, Lake Macquarie, Brisbane Water and Jervis Bay), highlighting substantial plasticity within these genotypes.
Although phenotypic plasticity is considered a strong predictor of fitness and competitive ability (Callaway, Pennings & Richards, 2003;Miner et al., 2005;Stomp et al., 2008), the rate of environmental change experienced by seagrass meadows in the 21st Century is unprecedented (Unsworth, Van Keulen & Coles, 2014), and there are ecological limits to phenotypic plasticity that can impact its adaptive value (Valladares, Gianoli & Gómez, 2007). Moreover, a plastic response to environmental change (e.g., reduced leaf area under low light conditions) may not actually enhance plant fitness and thus may not necessarily be an adaptive response (Schlichting, 1986). Predicted rapid environmental change can therefore potentially put vulnerable clonal plants at risk of extinction (Honnay & Bossuyt, 2005;Jump, Marchant & Peñuelas, 2009), and populations with a greater variety of genotypes and corresponding phenotypes would be considered less at risk than populations with low diversity, regardless of plasticity (Forsman & Wennersten, 2015).
With few genotypes shared across sampling locations, we had a limited ability to quantify the relative importance of genotype and local environmental conditions on phenotypic traits. We could, however, contrast two abundant MLGs (‘Genotype A’ and ‘Genotype C’) that were each shared across two meadows (Wallis Lake/Lake Macquarie, and Port Stephens/Pittwater respectively, which in both cases are separated by more than 150 km). Given the seed dispersal ecology ofP. australis, it is considered extremely unlikely that these meadows would experience contemporary gene flow at this distance (Kendrick et al., 2012;
McMahon et al., 2014). As such, we can be confident that these genotypic clones are most likely to have arisen from common ancestral meadows. While only eight microsatellite loci were used to identify genotypic clones in this study, all loci were highly polymorphic with sufficient power to distinguish individual genotypes (Pgen<0.02). Thus, it is highly
and Lake Macquarie (‘Genotype A’) significantly varied in a number of phenotypic traits across the two geographically distinct locations (including leaf surface area, biomass and nitrogen content). Between 16 and 32% of this variation was explained by ‘environment’ (meadow), suggesting that this genotype is capable of remarkable plasticity.
In contrast, the dominant MLG occurring in both Port Stephens and Pittwater (‘Genotype C’) showed no significant differences across the two meadows for five of the six phenotypic traits measured, suggesting that either this genotype has a lower capacity for phenotypic plasticity, or that the environmental conditions are broadly similar in these two estuaries. This second option is unlikely, given that Pittwater is a highly urbanised meadow with an endangered status and the seagrass meadows are considered in rapid decline (Creese et al., 2009;NSW Department of Primary Industries, 2012). Biomass was significantly lower in Pittwater when compared to Port Stephens (despite no significant differences across all different genotypes sampled within each location). Surface area of the leaves for ‘Genotype C’ was no different in these two locations, so it could be hypothesised that lower leaf biomass in Pittwater results from thinner/structurally weaker leaves, perhaps as a consequence of stress caused by reduced light availability (Ralph et al., 2007).
When contrasting genotypes within the two meadows that had several replicate genotypes (Pittwater and Port Stephens), there was no detectable variation in phenotypic traits among genotypes (except phenols at Port Stephens). This suggests that these genotypes express largely similar phenotypes within a meadow. Without transplanting these individual genotypes to other environments, it is not possible to determine whether this consistency is due to these genotypes having a similar fixed expression of traits, or all having sufficient phenotypic plasticity to express the same trait values in that environment.
Conclusion
Our results indicate that phenotypic diversity in populations ofPosidonia australisincreases significantly with increased genotypic diversity (MLG). This suggests that the use of presumably neutral DNA markers to measure genetic diversity also adequately reflects variation in several selectively relevant genes coding for quantitative traits, such as leaf morphology and productivity. Despite evidence of remarkable plasticity within genotypes ofP. australis, an increase in the variation of functionally relevant traits is expected to be advantageous in the face of environmental change.
ACKNOWLEDGEMENTS
ADDITIONAL INFORMATION AND DECLARATIONS
Funding
Funding was provided by an Australian Postgraduate Award and an Australian Research Council linkage grant (LP100200429 and LP130100918) with industry partners Cockburn Cement, Department of Parks and Wildlife Western Australia, Botanic Gardens and Parks Authority Western Australia. The funders had no role in study design, data collection and analysis, decision to publish, or preparation of the manuscript.
Grant Disclosures
The following grant information was disclosed by the authors: Australian Postgraduate Award.
Australian Research Council linkage grant: LP100200429, LP130100918.
Competing Interests
The authors declare there are no competing interests.
Author Contributions
• Suzanna M. Evans conceived and designed the experiments, performed the experiments, analyzed the data, wrote the paper, prepared figures and/or tables, reviewed drafts of the paper.
• Elizabeth A. Sinclair performed the experiments, contributed reagents/materials/analysis tools, reviewed drafts of the paper.
• Alistair G B. Poore and Adriana Vergés conceived and designed the experiments, reviewed drafts of the paper.
• Keryn F. Bain performed the experiments, analyzed the data, contributed reagents/materials/analysis tools, reviewed drafts of the paper.
Field Study Permissions
The following information was supplied relating to field study approvals (i.e., approving body and any reference numbers):
NSW Government Department of Primary Industries Scientific Collection Permit P11/0059-1.2.
Data Availability
The following information was supplied regarding data availability: The raw data was supplied asData S1.
Supplemental Information
Supplemental information for this article can be found online athttp://dx.doi.org/10.7717/ peerj.1633#supplemental-information.
REFERENCES
Aguirre JD, Marshall DJ. 2012.Genetic diversity increases population productivity in a
Ainsworth EA, Gillespie KM. 2007.Estimation of total phenolic content and other oxidation substrates in plant tissues using Folin-Ciocalteu reagent.Nature Protocols 2:875–877DOI 10.1038/nprot.2007.102.
Aires T, Marbà N, Cunha RL, Kendrick GA, Walker DI, Serrão EA, Duarte CM,
Arnaud-Haond S. 2011.Evolutionary history of the seagrass genusPosidonia.
Marine Ecology Progress Series421:117–130DOI 10.3354/meps08879.
Alcoverro T, Manzanera M, Romero J. 2001.Annual metabolic carbon balance of the
seagrassPosidonia oceanica: the importance of carbohydrate reserves.Marine Ecology Progress Series211:105–116DOI 10.3354/meps211105.
Alpert P, Stuefer JF. 1997. Division of labour in clonal plants. In: De Kroon H, Van
Groenendael J, eds.The ecology and evolution of clonal plants. The Netherlands: Backhuys Publishers, 137–154.
Arnaud-Haond S, Belkhir K. 2007.GENCLONE: a computer program to analyse
genotypic data, test for clonality and describe spatial clonal organization.Molecular Ecology Notes7:15–17DOI 10.1111/j.1471-8286.2006.01522.x.
Bain KF, Vergés A, Poore AGB. 2013.Using near infra red reflectance spectroscopy
(NIRS) to quantify tissue composition in the seagrassPosidonia australis.Aquatic Botany111:66–70DOI 10.1016/j.aquabot.2013.05.012.
Balloux F, Lehmann L, De Meeûs T. 2003.The population genetics of clonal and
partially clonal diploids.Genetics164:1635–1644.
Barbier ED, Hacker SD, Kennedy C, Koch EW, Stier AC, Silliman BR. 2011.The value
of estuarine and coastal ecosystem services.Ecological Monographs81:169–193 DOI 10.1890/10-1510.1.
Barton KE, Valkama E, Vehviläinen H, Ruohomäki K, Knight TM, Koricheva J. 2015. Additive and non-additive effects of birch genotypic diversity on arthropod her-bivory in a long-term field experiment.Oikos124:697–706DOI 10.1111/oik.01663.
Best RJ, Stone MN, Stachowicz JJ. 2015.Predicting consequences of climate change
for ecosystem functioning: variation across trophic levels, species and individuals. Diversity and Distributions21:1364–1374DOI 10.1111/ddi.12367.
Bolnick DI, Amarasekare P, Araújo MS, Bürger R, Levine JM, Novak M, Rudolf
VHW, Schreiber SJ, Urban MC, Vasseur D. 2011.Why intraspecific trait variation
matters in community ecology.Trends in Ecology and Evolution26:183–192 DOI 10.1016/j.tree.2011.01.009.
Borowitzka MA, Lavery PS, Van Keulen M. 2006. Epiphytes of seagrasses. In: Larkum
AWD, Orth RJ, Duarte CM, eds.Seagrasses: biology, ecology and conservation. The Netherlands: Springer, 441–461.
Bradford MA, Wood SA, Bardgett RD, Black HIJ, Bonkowski M, Eggers T, Grayston SJ,
Kandeler E, Manning P, Setälä H, Jones TH. 2014.Discontinuity in the responses of
ecosystem processes and multifunctionality to altered soil community composition. Proceedings of the National Academy of Sciences of the United States of America 111:14478–14483DOI 10.1073/pnas.1413707111.
Byrnes JEK, Gamfeldt L, Isbell F, Lefcheck JS, Griffin JN, Hector A, Cardinale BJ,
biodiversity and ecosystem multifunctionality: challenges and solutions.Methods in Ecology and Evolution5:111–124DOI 10.1111/2041-210X.12143.
Callaghan TV, Carlsson BÅ, Jónsdóttir IS, Svensson BM, Jonasson S. 1992.Clonal
plants and environmental change: introduction to the proceedings and summary. Oikos63:341–347DOI 10.2307/3544959.
Callaway RM, Pennings SC, Richards CL. 2003.Phenotypic plasticity and interactions
among plants.Ecology84:1115–1128
DOI 10.1890/0012-9658(2003)084[1115:PPAIAP]2.0.CO;2.
Cardinale BJ, Gross K, Fritschie K, Flobaum P, Fox JW, Rixen C, Van Ruijven J, Reich
PB, Scherer-Lorenzen M, Wilsey BJ. 2013.Biodiversity simultaneously enhances
the production and stability of community biomass, but the effects are independent. Ecology 94:1697–1707DOI 10.1890/12-1334.1.
Castagneyrol B, Lagache L, Giffard B, Kremer A, Jactel H. 2012.Genetic diversity
increases insect herbivory on oak saplings.PLoS ONE7:e44247 DOI 10.1371/journal.pone.0044247.
Colman JS, Segrove F. 1955.The tidal plankton over Stoupe Beck Sands, Robin
Hood’s Bay (Yorkshire, North Riding).Journal of Animal Ecology24:445–462 DOI 10.2307/1724.
Connolly RM. 1994.Comparison of fish catches from a buoyant pop net and a beach
seine net in a shallow seagrass habitat.Marine Ecology Progress Series109:305–309 DOI 10.3354/meps109305.
Costanza R, d’Arge R, De Groot R, Farber S, Grasso M, Hannon B, Limburg K,
Naeem S, O’Neil RV, Paruelo J, Raskin RG, Sutton P, Van der Belt M. 1997.The
value of the world’s ecosystem services and natural capital.Nature387:253–260 DOI 10.1038/387253a0.
Creese RG, Glasby TM, West G, Gallen C. 2009. Mapping the habitats of NSW estuaries.
Industry & investment NSW fisheries final report series, 113. Port Stephens.
Crutsinger GM, Collins MD, Fordyce JA, Gompert Z, Nice CC, Sanders NJ. 2006.Plant
genotypic diversity predicts community structure and governs an ecosystem process. Science313:966–968DOI 10.1126/science.1128326.
Drummond EBM, Vellend M. 2012.Genotypic diversity effects on the performance of
Taraxacam officinalepopulations increase with time and environmental favorability. PLoS ONE7:e30314DOI 10.1371/journal.pone.0030314.
Duffy JE. 2006.Biodiversity and the functioning of seagrass ecosystems.Marine Ecology
Progress Series311:233–250DOI 10.3354/meps311233.
Duffy JE, Richardson JP, Canuel EA. 2003.Grazer diversity effects on ecosystem
functioning in seagrass beds.Ecology Letters6:637–645 DOI 10.1046/j.1461-0248.2003.00474.x.
Eckert CG. 2002.The loss of sex in clonal plants.Evolutionary Ecology15:501–520.
Ehlers A, Worm B, Reusch TBH. 2008.Importance of genetic diversity in eelgrassZostera
Ellers J. 2009. Evolutionary processes in community ecology. In: Verhoef HA, Morin PJ, eds.Community ecology: processes, models and applications. Oxford: Oxford University Press, 151–162.
Evans SM, Sinclair EA, Poore AGB, Steinberg PD, Kendrick GA, Vergés A. 2014. Genetic diversity in threatenedPosidonia australisseagrass meadows.Conservation Genetics15:717–728DOI 10.1007/s10592-014-0573-4.
Farina S, Tomas S, Prado P, Romero J, Alcoverro T. 2009.Seagrass meadow structure
alters interactions between the sea urchinParacentrotus lividusand its predators. Marine Ecology Progress Series377:131–137DOI 10.3354/meps07692.
Foley WJ, McIlwee A, Lawler I, Aragones L, Woolnough AP, Berding N. 1998.
Eco-logical applications of near infrared reflectance spectroscopy: a tool for rapid, cost-effective prediction of the composition of plant and animal tissues and aspects of animal performance.Oecologia116:293–305DOI 10.1007/s004420050591.
Forsman A, Wennersten L. 2015.Inter-individual variation promotes ecological success
of populations and species: evidence from experimental and comparative studies. Ecography38:001–019DOI 10.1111/ecog.00911.
Foster Huenneke L. 1991. Ecological implications of genetic variation in plant
pop-ulations. In: Falk DAI, Holsinger KE, eds.Genetics and conservation of rare plants. Oxford: Oxford University Press, 31–44.
Fourqurean JW, Duarte CM, Kennedy H, Marbà N, Holmer M, Mateo MA, Apostolaki
ET, Kendrick GA, Krause-Jensen D, McGlathery KJ, Serrano O. 2012.Seagrass
ecosystems as a globally significant carbon stock.Nature Geoscience5:505–509 DOI 10.1038/ngeo1477.
Gobert S, Cambridge ML, Velimirov B, Pergent G, Lepoint G, Bouquegneau J, Dauby
P, Pergent-Martini C, Walker DI. 2006. Biology ofPosidonia. In: Larkum AWD,
Orth RJ, Duarte CM, eds.Seagrasses: biology, ecology and conservation. The Nether-lands: Springer, 387–408.
Goecker ME, Heck KL, Valentine JF. 2005.Effects of nitrogen concentrations in
turtle-grassThalassia testudinumon consumption by the bucktooth parrotfishSparisoma radians.Marine Ecology Progress Series286:239–248 DOI 10.3354/meps286239.
Greene LE, Alevizon WS. 1989.Comparative accuracies of visual assessment methods for
coral reef fishes.Bulletin of Marine Science44:899–912.
Harrison PG. 1989.Detrital processing in seagrass systems: a review of factors
affect-ing decay rates, remineralization and detritivory.Aquatic Botany 35:263–288 DOI 10.1016/0304-3770(89)90002-8.
Hay KB, Millers K, Poore AGB, Lovelock CE. 2010.The use of near infrared reflectance
spectrometry for characterisation of brown algal tissue traits.Journal of Phycology 46:937–946DOI 10.1111/j.1529-8817.2010.00890.x.
Heck KL, Valentine JF. 2006.Plant-herbivore interactions in seagrass meadows.Journal
of Experimental Marine Biology and Ecology330:420–436 DOI 10.1016/j.jembe.2005.12.044.
Honnay O, Bossuyt B. 2005.Prolonged clonal growth: escape route or route to
Hooper DU, Chapin FS, Ewel JJ, Hector A, Inchausti P, Lavorel S, Lawton JH, Lodge DM, Loreau M, Naeem S, Schmid B, Setälä H, Symstand AJ, Vandermeer J, Wardle
DA. 2005.Effects of biodiversity on ecosystem functioning: a consensus of current
knowledge.Ecological Monographs75:3–35DOI 10.1890/04-0922.
Hughes AR. 2014.Genotypic diversity and trait variance interact to affect marsh plant
performance.Journal of Ecology102:651–658DOI 10.1111/1365-2745.12244.
Hughes AR, Best RJ, Stachowicz JJ. 2010.Genotypic diversity and grazer identity
interactively influence seagrass and grazer biomass.Marine Ecology Progress Series 403:43–51DOI 10.3354/meps08506.
Hughes AR, Inouye BD, Johnson MTJ, Underwood N, Vellend M. 2008.Ecological
consequences of genetic diversity.Ecology Letters11:609–623 DOI 10.1111/j.1461-0248.2008.01179.x.
Hughes AR, Stachowicz JJ. 2004.Genetic diversity enhances the resistance of a seagrass
ecosystem to disturbance.Proceedings of the National Academy of Sciences of the United States of America101:8998–9002DOI 10.1073/pnas.0402642101.
Hughes AR, Stachowicz JJ. 2011.Seagrass genotypic diversity increases disturbance
response via complementarity and dominance.Journal of Ecology99:445–453.
Hughes AR, Stachowicz JJ, Williams SL. 2009.Morphological and physiological
variation among seagrass (Zostera marina) genotypes.Oecologia159:725–733 DOI 10.1007/s00442-008-1251-3.
Jahnke M, Olsen JL, Procaccini G. 2015.A meta-analysis reveals a positive correlation
between genetic diversity metrics and environmental status in the long-lived seagrass Posidonia oceanica.Molecular Ecology 24:2336–2348DOI 10.1111/mec.13174.
Jump AS, Marchant R, Peñuelas J. 2009.Environmental change and the option value of
genetic diversity.Trends in Plant Science14:1360–1385.
Kendrick GA, Waycott M, Carruthers TB, Cambridge ML, Hovey R, Krauss SL, Lavery PS, Les DH, Lowe RJ, Mascaró O, Ooi Lean Sim J, Orth RJ, Rivers D, Ruiz-Montoya
L, Sinclair EA, Statton J, Van Dijk K, Verduin J. 2012.The central role of dispersal
in the maintenance and persistence of seagrass populations.BioScience 62:56–65 DOI 10.1525/bio.2012.62.1.10.
Kotowska AM, Cahill JF, Keddie BA. 2010.Plant genetic diversity yields increased
plant productivity and herbivore performance.Journal of Ecology98:237–245 DOI 10.1111/j.1365-2745.2009.01606.x.
Lande R, Shannon S. 1996.The role of genetic variation in adaptation and population
persistence in a changing environment.Evolution50:434–437DOI 10.2307/2410812. Lefcheck JS, Byrnes JEK, Isbell F, Gamfeldt L, Griffin JN, Eisenhauer N, Hensel
MJ, S, Hector A, Cardinale BJ, Duffy JE. 2015.Biodiversity enhances ecosystem
multifunctionality across trophic levels and habitats.Nature Communications6:6936 DOI 10.1038/ncomms7936.
Loreau M, Naeem S, Inchausti P, Bengtsson J, Grime JP, Hector A, Hooper DU, Huston
MA, Raffaelli D, Schmid B, Tilman D, Wardle DA. 2001.Biodiversity and ecosystem
Massa SI, Paulino CM, Serrão EA, Duarte CM, Arnaud-Haond S. 2013.Entangled effects of allelic and clonal (genotypic) richness in the resistance and resilience of experimental populations of the seagrassZostera noltiito diatom invasion.BMC Ecology 13:39–50DOI 10.1186/1472-6785-13-39.
Mateo MA, Cebrian J, Dunton KH, Mutchler T. 2006. Carbon flux in seagrass
ecosys-tems. In: Larkum AWD, Orth RJ, Duarte CM, eds.Seagrasses: biology, ecology and conservation. The Netherlands: Springer, 227–254.
McArt SH, Thaler JS. 2013.Plant genotypic diversity reduces the rate of consumer
resource utilization.Proceedings of the Royal Society B280:20130639.
McLellan AJ, Prati D, Kaltz O, Schmid B. 1997. Structure and analysis of phenotypic
and genetic variation in clonal plants. In: De Kroon H, Van Groenendael J, eds. The ecology and evolution of clonal plants. The Netherlands: Backhuys Publishers, 185–210.
McMahon K, Van Dijk K, Ruiz-Montoya L, Kendrick GA, Krauss SL, Waycott M,
Verduin J, Lowe R, Statton J, Brown E, Duarte C. 2014.The movement ecology of
seagrasses.Proceedings of the Royal Society B281:20140878.
Middleton MJ, Bell JD, Burchmore JJ, Pollard DA, Pease BC. 1984.Structural
differences in fish communities ofZostera capricorniandPosidonia australis seagrass meadows in Botany Bay, New South Wales.Aquatic Botany18:89–109 DOI 10.1016/0304-3770(84)90082-2.
Miner BG, Sultan SE, Morgan SG, Padilla DK, Relyea RA. 2005.Ecological
conse-quences of phenotypic plasticity.Trends in Ecology and Evolution20:685–692 DOI 10.1016/j.tree.2005.08.002.
NSW Department of Primary Industries. 2012. Endangered populations in NSW:
Posidonia australisin Port Hacking, Botany Bay, Sydney Harbour, Pittwater,
Brisbane Water and Lake Macquarie. NSW: Fisheries Ecosystem Unit, Port Stephens Fisheries Institute.
Peirano A. 2002.Lepidochronology and intermodal length methods for studying
Posidonia oceanicagrowth: are they compatible? Aquatic Botany 74:175–180 DOI 10.1016/S0304-3770(02)00078-5.
Pergent G, Pergent-Martini C, Cambridge M. 1997.Morphochronological variations
in the genusPosidonia.Marine and Freshwater Research48:421–424 DOI 10.1071/MF96100.
Pergent G, Pergent-Martini C, Fernandez C, Pasqualini V, Walker DI. 2004.
Morpho-chronological variations and primary production inPosidoniasea grass from
Western Australia.Journal of the Marine Biological Association of the United Kingdom 84:895–899DOI 10.1017/S0025315404010161h.
Ralph PJ, Durako MJ, Enriquez S, Collier CJ, Doblin MA. 2007.Impact of light
limita-tion on seagrasses.Journal of Experimental Marine Biology and Ecology 350:176–193 DOI 10.1016/j.jembe.2007.06.017.
Reed DH, Frankham R. 2003.Correlation between fitness and genetic diversity.
Reusch TBH. 2001.New markers—old questions: population genetics of seagrasses. Marine Ecology Progress Series211:261–274DOI 10.3354/meps211261.
Reusch TBH, Ehlers A, Hämmerli A, Worm B. 2005.Ecosystem recovery after
climatic extremes enhanced by genotypic diversity.Proceedings of the Na-tional Academy of Sciences of the United States of America102:2826–2831 DOI 10.1073/pnas.0500008102.
Schlichting CD. 1986.The evolution of phenotypic plasticity in plants.Annual Review of
Ecology and Systematics17:667–693DOI 10.1146/annurev.es.17.110186.003315.
Short FT, Duarte CM. 2001. Methods for the measurement of seagrass growth and
production. In: Short FT, Coles RG, eds.Global Seagrass Research Methods. The Netherlands: Elsevier Science B.V., 155–182.
Sinclair EA, Anthony J, Coupland GT, Waycott M, Barrett MD, Barrett RL, Cambridge
ML, Wallace MJ, Dixon KW, Krauss SL, Kendrick GA. 2009.Characterisation of
polymorphic microsatellite markers in the widespread Australian seagrass,Posidonia australisHook. f. (Posidoniaceae), with cross-amplification in the sympatricP. sinuosa.Conservation Genetics Resources1:273–276DOI 10.1007/s12686-009-9067-y.
Singleton VL, Orthofer R, Lamuela-Raventós RM. 1999.Analysis of total phenols and
other oxidation substrates and antioxidants by means of Folin-Ciocalteu reagent. Methods in Enzymology 299:152–178DOI 10.1016/S0076-6879(99)99017-1.
Stachowicz JJ, Bruno JF, Duffy JE. 2007.Understanding the effects of marine
biodi-versity on communities and ecosystems.Annual Review of Ecology Evolution and Systematics38:739–766DOI 10.1146/annurev.ecolsys.38.091206.095659.
Stomp M, Van Dijk MA, Van Overzee HMJ, Wortel MT, Sigon CAM, Egas M, Hoogveld
H, Gons HJ, Huisman J. 2008.The timescale of phenotypic plasticity and its impact
on competition in fluctuating environments.American Naturalist172:E169–E185 DOI 10.1086/591680.
Tilman D, Reich PB, Isbell F. 2012.Biodiversity impacts ecosystem productivity
as much as resources, disturbance, or herbivory.Proceedings of the National Academy of Sciences of the United States of America109:10394–10397 DOI 10.1073/pnas.1208240109.
Tomas F, Abbott JM, Steinberg C, Balk M, Williams SL, Stachowicz JJ. 2011.Plant
genotype and nitrogen loading influence seagrass productivity, biochemistry, and plant-herbivore interactions.Ecology 92:1807–1817DOI 10.1890/10-2095.1.
Unsworth RKF, Van Keulen M, Coles RG. 2014.Seagrass meadows in a globally
changing environment.Marine Pollution Bulletin83:383–386 DOI 10.1016/j.marpolbul.2014.02.026.
Valentine JF, Duffy JE. 2006. The central role of grazing in seagrass ecology. In: Larkum
AWD, Orth RJ, Duarte CM, eds.Seagrasses: biology, ecology and conservation. The Netherlands: Springer, 463–501.
Valladares F, Gianoli E, Gómez JM. 2007.Ecological limits to phenotypic plasticity.New
Vasemägi A, Primmer CR. 2005.Challenges for identifying functionally important genetic variation: the promise of combining complementary research strategies. Molecular Ecology 14:3623–3642DOI 10.1111/j.1365-294X.2005.02690.x.
Vergés A, Becerro MA, Alcoverro T, Romero J. 2007.Experimental evidence of chemical
deterrence against multiple herbivores in the seagrassPosidonia oceanica.Marine Ecology Progress Series343:107–114DOI 10.3354/meps06885.
Wardle DA. 1999.Is sampling effect a problem for experiments investigating
biodiversity-ecosystem function relationships?Oikos87:403–407 DOI 10.2307/3546757.
Waycott M, Duarte CM, Carruthers TJB, Orth RJ, Dennison WC, Olyarnik S, Calladine A, Fourqurean JW, Heck KL, Hughes AR, Kendrick GA, Kenworthy WJ, Short FT,
Williams SL. 2009.Accelerating loss of seagrasses across the globe threatens coastal
ecosystems.Proceedings of the National Academy of Sciences of the United States of America106:12377–12381DOI 10.1073/pnas.0905620106.
Waycott M, Longstaff BJ, Mellors J. 2005.Seagrass population dynamics and water
quality in the Great Barrier Reef region: a review and future research directions. Marine Pollution Bulletin51:343–350DOI 10.1016/j.marpolbul.2005.01.017.
West RJ. 2012.Impacts of recreational boating activities on the seagrassPosidoniain SE
Australia.Wetlands Australia Journal26:3–13.
Whitham TG, Bailey JK, Schweitzer JA, Shuster SM, Bangert RK, LeRoy CJ, Lonsdorf EV, Allan GJ, DiFazio SP, Potts BM, Fischer DG, Gehring CA, Lindroth RL, Marks
JC, Hart SC, Wimp GM, Wooley SC. 2006.A framework for community and
ecosystem genetics: from genes to ecosystems.Nature Reviews Genetics7:510–523 DOI 10.1038/nrg1877.
Wood N, Lavery P. 2000.Monitoring seagrass ecosystem health—the role of