Genetic structure of natural
Eugenia dysenterica DC
(Myrtaceae) populations
in northeastern Goiás, Brazil, accessed by morphological traits and RAPD
markers
Maria da Glória Trindade
1and Lázaro José Chaves
2 1Embrapa Trigo, Goiânia, Go, Brazil.
2
Universidade Federal de Goiás, Escola de Agronomia e Engenharia de Alimentos, Goiânia, Go, Brazil.
Abstract
The Brazilian Cerrado (Savannah) is a biome with great biodiversity. Many of the species found in this biome have unlimited economic potential and are used by the local population for various purposes. With the opening of the agricultural frontiers in this region, much of the native flora has been replaced by extensive areas of monocultures. Thirteen populations of theEugenia dysenterica DCspecies were sampled in the northeast of the state of Goiás, Brazil, to analyze their genetic structure. Morphological traits were measured for all the progeny obtained and some of them were analyzed by using RAPD markers. The natural populations of the species showed high levels of variability for the morphological traits. The phenotypic, genotypic and genetic variabilities as structured in these populations were highly significant among populations, although most of the variability was detected within populations. The phenotypic and genetic variabilities were structured spatially as shown by the positive and highly significant correlation coefficients between the phenotypic and genetic distance matrixes and the geographic distance matrix. The ideal conservation strategy for the species in the region requires sampling of a high number of individuals of each population and also a significant number of populations to ensure suitable effective population sizes.
Key words:Cerrado, cagaiteira, population genetics, genetic structure and conservation. Received: July 22, 2004; Accepted: February 22, 2005.
Introduction
The cagaiteira (Eugenia dysentericaDC) is a species
that occurs naturally instricto sensuCerrado areas. This
species shows flowering strategy of the big-bang type, in which bloom synchronization occurs in a very short time period. Bees are the main pollinators including species of the Bombus genus type, among others. The cagaiteira as
well as other species of the Myrtaceae family are dispersed by zoocory. However, the Cerrado has recently undergone a process of human disturbance and extensive areas of monoculture have replaced much of the native flora. Many of the natural species in this biome have economic potential and are used by the local population for various purposes. The domestication and incorporation of these species in the regional production systems and the design of conservation strategies depend fundamentally on knowledge of the ge-netic structure of their natural populations.
Different classes of markers have been used in the ge-netic analysis of natural populations. Among these classes the morphological traits have been used extensively in ge-netic analysis because they are easy to handle. Many stud-ies have been carried out in specstud-ies from the Cerrado using this type of trait (Silvaet al.,2001). More recently, the
ap-plication of technologies based on DNA polymorphism has provided a wealth of information on the variability of wild and cultivated populations. The molecular markers used mostly for determining the genetic variability at the DNA level for natural population analysis are RAPD markers and in some specific cases microsatellites and RFLP. These techniques have been applied to wild species to answer spe-cific questions, mainly regarding the crossing system (Hay-ward and Hamilton, 1997). Some studies based on microsatellites have been employed in the study of natural populations (Collevattiet al., 2001; Zucchiet al., 2003) but
most of the studies are performed with RAPD markers in plants (Chalmerset al.,1992; Wolf and Rijn, 1993, Bucci and Menozzi, 1995; Yehet al.,1995; Maguire and Sedgley
1997; Gillieset al.,1997, Palácios and González-Candelas,
1997; Galloiset al., 1998, Cattan-Toupanceet al., 1998,
www.sbg.org.br
Send correspondence to Maria da Glória Trindade. Embrapa Trigo, Rodovia Goiânia/Nova Veneza km 12, Zona Rural, 75375-000 Santo Antônio de Goiás, Go, Brazil. E-mail: mgloria@cnpaf. embrapa.br.
Skabo et al.,1998), and in other organisms (Peever and
Milgroom, 1994, Louet al.,1998).
Eugenia dysenterica DCpopulations from the
south-east region of Goiás were studied using morphological traits (Silvaet al.,2001), isoenzymatic (Telleset al.,2001 a
and b) and RAPD and SSR markers (Zucchiet al., 2003).
The authors detected stochastic processes of genetic diver-gence among populations, such as the stepping stone model. In addition to the aspects related to the biology of the species, an important factor in explaining the spatial pattern obtained was the advanced fragmentation process mainly caused by the expansion of the agricultural frontier in the Cerrado region. This process reduces the size of the cagaiteira populations and of their pollinators and dispersers, and is most certainly a contributing factor in the reduction of the genetic flow among the populations. As the fragmentation process in these areas is relatively recent, the divergence among these populations may become even more intense in the future.
The objective of the present study was to characterize the genetic structure of naturalEugenia dysenterica DC
populations in the northeastern region of Goiás state, Brazil, using morphological traits and RAPD markers to di-rect future conservation, domestication and breeding pro-grams.
Materials and Methods
The material for the present study was obtained by field collection in the northeastern region of Goiás, includ-ing 13 areas ofstricto sensuCerrado. Twelve mother plants were sampled in each area by collecting a sufficient number of fruits for characterization and to obtain progenies. In Ta-ble 1, we show the location of the counties where the sam-ples were obtained with their respective geographic coordinates.
Morphological trait assessment
The fruits collected from each plant were character-ized by measuring the fruit weight (FW), seed weight (SW) and number of seeds (NS). Later the seeds extracted from the fruits were sown in a greenhouse with 80% shading to study the variables related to the initial development of the progenies. A completely randomized block design was adopted with three replications and each plot consisted of five plants. Data were collected on percentage emergence (EP), number of days to emergence (NDE), plant height (PH90, PH178) and plant diameter (PD90, PD178) at 90 and 178 days after sowing, respectively.
RAPD analysis
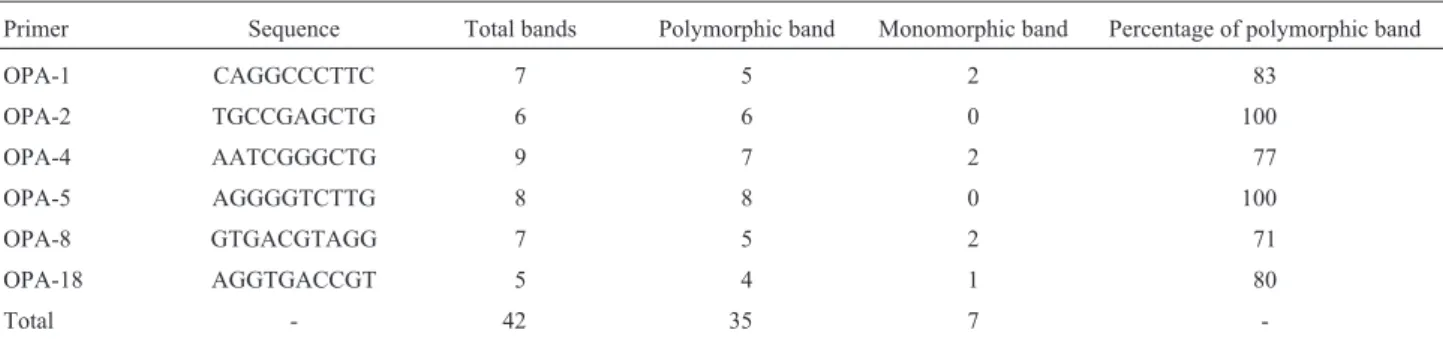
Three field populations collected (1, 2 and 4) were used for the genetic characterization based on RAPD mark-ers. The protocol for DNA extraction was adapted from Ferreira and Grattapaglia (1996). Two preliminary experi-ments were carried out for the qualitative and quantitative selection of the primers used. Eighty decamer primers from Operon technologies were analyzed and among them six primers of the OPA series, which showed a more polymor-phic pattern, were selected for this analysis (Table 2). Am-plification reactions were processed with the selected primers from the DNA samples. To compose each amplifi-cation reaction, a total volume of 25mL of the mixture,
con-taining distilled and deionized H2O (11.5 mL), 10 mM
Tris-HCl, pH 8.3 (2.5 mL), 1.25 mM of each dNTP (2.5mL), 0.25mM of a decamer primer (Operon
Technol-ogies, Alameda, CA, USA), 10 ng/mL (3.0 mL), 5 mM
MgCl2(1.5mL), 1 udTaqDNA polymerase (1.0mL) and
10 ng/mL of genomic DNA (3.0mL) was used. The enzy-matic amplification was performed in a thermocycler pro-grammed initially for 5 min at 94 °C followed by 48 cycles of: 30 s at 92 °C for DNA denaturation, 1.5 min at 37 °C for
Table 1- Number of populations and mother plants and respective geographic location of theEugenia dysentericaDC collection areas in Goiás State.
Population Geographic location Number of matrixes Latitude Longitude Altitude (m)
1 Formosa 12 15°032’44” 470°22’52” 1,000
2 S. Gabriel 12 15°011’17” 470°38’18” 1,050
3 Água Fria 12 140°57’21” 470°45’40” 870
4 Mimoso 12 150°00’34” 480°07’17” 850
5 Pe. Bernardo 12 150°05’57” 480°51’05” 600
6 Dois Irmãos 12 150°12’43” 480°33’42” 650
7 S. J. Aliança 12 140°36’40” 470°29’49” 1,010
8 Teresina de Goiás 12 130°50’10” 470°15’21” 1,000
9 Campos Belos 12 130°14’46” 460°37’13” 470
10 S. Domingos 12 130°26’56” 460°19’27” 700
11 Jaciara 12 140°14’48” 460°38’10” 510
12 Flores de Goiás 12 140°58’22” 470°00’47” 530
annealing of the primer to the DNA template and 6 min at 72 °C for primer extension. The fragments generated by amplification were separated by electrophoresis in horizon-tal 1.4% agarose gel at a concentration of 1% in TBE buffer (90 mM Tris-borate and 2 mM EDTA). After separation the results were visualized by treatment with 10mL ethidium
bromide (10 mg/mL) and exposure to ultraviolet light. Af-ter photographing, the gel was inAf-terpreted for presence (1) or absence (0) of each band, for all the primers used. For the statistical analysis only the strong and reproductive bands were selected.
Analysis of the data obtained from morphological traits
Data collected from the fruits and young plants were utilized in structuring of the analysis of variance and the partitioning of variance in components. A hierarchical model which considered the effects of population, progeny within population and fruit or seedling within progeny was used. The data also allowed the construction of a phenotypic (fruit data) and genotypic (seedling data) dis-tance matrix using the Mahalanobis generalized disdis-tance (Mahalanobis, 1936) obtained by a multivariate analysis for quantitative variables implemented by the GENES pro-gram (Cruz, 1997).
Analysis of the data obtained from RAPD markers
The coefficient of similarity by simple matching was calculated from the binary data among all the individuals to construct a dissimilarity matrix (genetic distance). The de-composition of the total variation in its components among and within populations was performed by the analysis of molecular variance (Excoffieret al.,1992) from the genetic
distance matrix, using the Arlequin software (Schneideret al., 2000). The significance of the fixation indexes was
tested using 1,000 permutations.
Analysis of the spatial pattern of divergence among populations
The spatial variation patterns were analyzed by the Pearson coefficient of correlation (r) between the phenotypic or genotypic average distance matrixes among populations, and the geographic distance matrix among
them, using the NTSYS 1.7 software. The pattern of this variation was studied by the construction of dendrograms from the phenotypic and genotypic distance matrixes, using the UPGMA clustering method. The significances of the dendrograms were tested by cophenetic correlation with 5,000 permutations.
Results and Discussion
The results of the analysis of variance and their com-ponents for fruit and progeny data are presented in Tables 3 and 4. Fruit weight contributed most to phenotypic diver-gence among populations. On average, the fruit weight value was 15.34 g, indicating a relatively small fruit size and the seeds were also small with a mean of 2.19 g. The mean number of seeds per fruit was 1.46. The mean NDE values (38.12 days) and EP (81.71%) indicate a high per-centage of emergence in a relatively short time period com-pared with other fruit tree species native to the Cerrado.
The phenotypic and genotypic structuring of the pop-ulations showed that most of the variability is found within populations for most of the variables. The occurrence of significant genetic variability among progeny within popu-lations is expected and corresponds to 1/4 of the additive variance of the population, with the assumption of random crossing and many individuals per progeny. Deviations from random crossing due to a restricted number of individ-uals lead generally to an increase among progeny variation. Table 2- Polymorphism pattern of each primer selected for the genetic analysis of natural populations ofE. dysenterica.
Primer Sequence Total bands Polymorphic band Monomorphic band Percentage of polymorphic band
OPA-1 CAGGCCCTTC 7 5 2 83
OPA-2 TGCCGAGCTG 6 6 0 100
OPA-4 AATCGGGCTG 9 7 2 77
OPA-5 AGGGGTCTTG 8 8 0 100
OPA-8 GTGACGTAGG 7 5 2 71
OPA-18 AGGTGACCGT 5 4 1 80
Total - 42 35 7
-Table 3- Analysis of variance and estimates of genetic parameters for the traits fruit weight (FW), seed weight (SW) and number of seeds (NS).
Source of variation
Degrees of freedom
Mean square
F.W. S.W. N.S.
Population 12 1077.38** 23.57** 3.45**
Prog./Pop. 143 132.89** 2.50** 0.81**
Error 775 15.67 0.74 0.38
Media - 15.34 2.19 1.46
CVe (%) - 25.78 39.32 42.4
$
ss
2 - 13.12 0.293 0.037
$ /
sp s
2 - 19.54 0.293 0.071
$ / ($ $ /)
ss ss sp s
The variation among populations occurs when there is some restriction in gene flow and also arises through the ef-fect of genetic drift and specific adaptations to particular environments via selection. In the present case, the propor-tion of the genetic variance among populapropor-tions, compared to the total variance was very high when compared with what is normally detected with selectively neutral markers in cross-pollinating species. This fact probably indicates an effect of selection in the differentiation among populations. However, the influence of maternal effects, which include non-genetic effects via seed vigor, cannot be disregarded.
In Table 5, we show the results of the structuring of the genetic variability with RAPD markers. The analysis of molecular variance indicated a total variance of 0.43456. This value is similar to that obtained by Gillieset al.(1997) who analyzedCedrela odoratapopulations in Costa Rica, with the same type of marker. High levels of total variance are also reported for temperate climate species (Yehet al.,
1995; Liao and Hsiao, 1998). Although most of the genetic variance is found within populations there is a highly sig-nificant quantity among populations (about 8% of total variability), indicating gene flow restriction among popula-tions. Liao and Hsiao (1998) used RAPD markers to study theAcorus gramineusSoland (Aracae) species that occurs in Southeast Asia and detected levels of differentiation (16.88%) among populations. According to these authors,
the presence of specific bands at each sampling site may be the result of the separate evolution of the populations by re-striction to the gene flow. Lower levels of differentiation among populations were obtained by Yehet al.(1995) in natural populations of thePopulus tremuloidesMichx spe-cies. The differentiation among populations, although small (2.6%), was highly significant. This level of differen-tiation among populations was also observed in other stud-ies with the same specstud-ies using isoenzymes markers. These results suggest that neutral forces are a better explanation of the structure observed for selection. When the differentia-tion values among populadifferentia-tions for the morphological traits are compared, either at phenotypic or genotypic level, the lower value observed for RAPD markers represents the role of genetic drift in the differentiation of the population, be-cause these markers are selectively neutral they are not spe-cific targets of the natural selection process. The differentiation values observed with progeny data quantify the role of drift and the selection that may explain the greater proportions of variability observed for most of the phenotypic variables. The analysis of data obtained from fruit variables showed that besides these two sources (drift and selection) the environment exercises a strong influ-ence.
Zucchi et al. (2003) analyzed Eugenia dysenterica
DC populations from southeastern Goiás with the same
Table 5- Analysis of molecular variance (AMOVA) and fixation indexes* for 152 individuals in threeEugenia dysentericaDC populations from northeastern Goiás, Brazil.
Source of variation Degrees of freedom Sum of squares Variance components Variation (%) p - value
Population 2 5.118 0.03751 8.63 0.000391
Prog./Pop. 33 21.133 0.07608 17.51 0.000000
Ind./Prog. 116 37.233 0.32098 73.86 0.000000
Total 151 63.487 0.43456 -
-*Fixation indexes:$f
PS= 0.19160**,$fPT= 0.26138**,f$ST= 0.08632**.
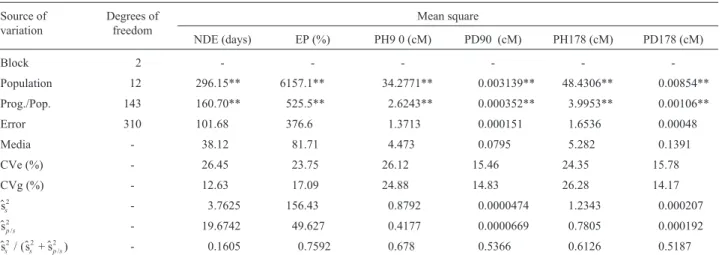
Table 4- Analysis of variance and estimates of genetic parameters for the traits number of days to emergence (NDE), emergence percentage (EP), plantlet height and plant diameter at 90 (PH90, PD90) and at 178 days (PH178, PD178) after sowing.
Source of variation
Degrees of freedom
Mean square
NDE (days) EP (%) PH9 0 (cM) PD90 (cM) PH178 (cM) PD178 (cM)
Block 2 - - -
-Population 12 296.15** 6157.1** 34.2771** 0.003139** 48.4306** 0.00854**
Prog./Pop. 143 160.70** 525.5** 2.6243** 0.000352** 3.9953** 0.00106**
Error 310 101.68 376.6 1.3713 0.000151 1.6536 0.00048
Media - 38.12 81.71 4.473 0.0795 5.282 0.1391
CVe (%) - 26.45 23.75 26.12 15.46 24.35 15.78
CVg (%) - 12.63 17.09 24.88 14.83 26.28 14.17
$ss
2 - 3.7625 156.43 0.8792 0.0000474 1.2343 0.000207
$sp s/
2 - 19.6742 49.627 0.4177 0.0000669 0.7805 0.000192
$ss / ($ss $sp s/)
type of marker and obtained a value offST= 0.2703 and a
genetic structure that concentrated 27.03% of the genetic variability among populations. The lower values detected in the present study might have occurred because of the greater proximity among the populations studied and also because of the smaller degree of fragmentation existing in the northeastern region that so far has not been exploited for agricultural purposes. In this context, these populations may have been in a much slower population differentiation process than those found in the southeastern region of the state. Analyzing the same populations with microsatellite markers (SSR), Zucchiet al. (2003) ascertained that the
species came close to alogamy and the allelic frequencies of the populations were detected in the proportions of Hardy-Weinberg equilibrium for the generation sampled, in contrast with the results obtained with isoenzymes by Telleset al.(2001 a and b) suggesting panmixy deviations.
However, according to Zucchiet al.(2003) there is
congru-ence among the population parameters obtained with dif-ferent types of markers (isoenzymes, RAPD and SSR markers) despite some discrepancies. The results obtained by these studies in the southeastern region of the state show that in spite of the species having a tendency to alogamy, the gene flow between populations is small and considered restrictive, probably because of the human disturbance of the Cerrado. The restricted flow allowed the drift to in-crease the differentiation among populations.
The comparison of population parameters obtained with different markers should be interpreted with caution. One restriction that should be considered in this type of comparison is the sampling of the genome itself. RAPD and SSR markers affect coding as well as non-coding regions of the genome and the isoenzymes are restricted to the coding region. Due to their dominant nature, RAPD markers can lead to an underestimation of the recessive allele frequency in a population causing a bias in the estimates of the genetic parameters.
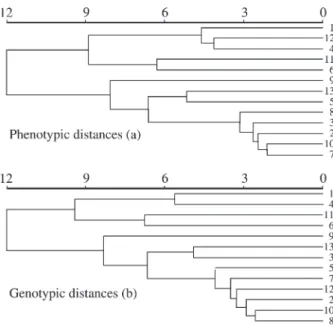
The dendrogram patterns (Figure 1) indicate an al-most continuous variation of the phenotypic and genotypic distances since no characteristic clusters were formed. This performance, reflected in the dendrograms, is expected un-der the null hypothesis. Those populations that are closer geographically are more similar phenotypically and genotypically and there is a clinal variation pattern. This pattern, which reflects the evolutionary model of isolation by distance, was observed by Telleset al.(2001 a and b) and can also be visualized in Figure 2. In Figure 2, we show that there was a clinal variation pattern because small geo-graphic distances result in small phenotypic and genotypic distances. However, for greater geographic distances there are both small and large phenotypic and genotypic varia-tions (envelope effect), indicating that the differentiation process becomes random. Therefore there should be a point (distance in km) at which the phenotypic and genotypic variation becomes independent from the geographic
dis-tances (indicating isolation by distance). In the present case, no evidence was observed of stabilization in the vari-ability among populations, indicating that greater phenotypic and genotypic variations could be obtained if collections were made in wider regions. Telles et al.
(2001a) confirmed this clinal variation pattern by analysis of spatial autocorrelation in populations of the species in the southeastern part of the state.
Figure 1- Pattern of phenotypic (a) and genotypic (b) variation among the
Eugenia dysentericaDC populations defined by the UPGMA clustering. The significance was detected by cophenetic correlations (5000 permuta-tions) with r = 0.6874** for the phenotypic distances and r = 0.6100** for the genotypic distances.
Figure 2- Relationship between the Mahalanobis phenotypic (a) and
genotypic (b) variation (Y axis) and the geographic distances (X axis)
The genetic variability pattern showed a space struc-turing by the positive and highly significant coefficient of correlation between the phenotypic or genotypic variation matrixes with the geographic distance matrix (Figure 3). This fact reinforces the supposition that the genetic vari-ability in these populations is structured in geographic space, confirming that this variability is best explained by a neutral evolution model (Telleset al.,2001b).
To establishin situconservation or sampling areas for ex situ conservation the concepts of representativeness
(Vencovsky and Crossa, 1999) and the minimum viable population (Menges, 2000a and b) should be considered. These approaches are important for the sustainability of the populations being preserved. The levels of variability among populations observed in this study indicate the need for a large number of areas forin situconservation and an
adequate number of individuals from each population to ensure appropriate effective sizes.
Acknowledgements
The authors wish to thank the Graduate Program of the Agronomy School of the Federal University of Goiás, FINEP and CAPES for financial support.
References
Bucci G and Menozzi P (1995) Genetic variation of RAPD mark-ers in aPicea abiesKarst. Population. Heredity 75:188-197. Cattan-Toupance I, Michalakis Y and Neema C (1998) Genetic
structure of wild bean population in their South-Andean centre of origin. Theor Appl Genet 96:844-851.
Chalmers KJ, Waugh R, Sprent JL, Simons AJ and Powell W (1992) Detection of genetic variation between and within populations of Gliricidia sepium and G. maculatausing RAPD markers. Heredity 69:465-472.
Collevatti RG, Gratapaglia D and Hay JD (2001) Population ge-netic structure of the endangered tropical tree species
Caryocar brasiliense, based on variability at microsatellite loci. Molecular Ecology 10:349-356.
Cruz CD (1997) Programa GENES. Aplicativo Computacional em Genética e Estatística. Editora UFV, Viçosa, 590 pp. Excoffier L, Smouses PE and Quattro JM (1992) Analysis of
mo-lecular variance inferred from metric distances among DNA Haplotypes: Application to human mitocondrial DNA re-striction data. Genetics 131:479-491.
Ferreira ME and Grattapaglia D (1996) Introdução ao uso de marcadores moleculares em análise genética. 2nd edition. Embrapa, Brasília, 220 pp.
Gallois A, Audran JC and Burrus M (1998) Assessment of genetic relationship and population discrimination among fagus sylvaticaL. by RAPD. Theor Appl Genet 97:211-219. Gillies ACM, Cornelius JP, Newton AC, Navarro C and
Hernández M (1997) Genetic variation in Costa Rican popu-lations of the tropical timber speciesCedrela odorataL. as-sessed using RAPDs. Mol Ecol 6:1133-1145.
Hayward MD and Hamilton NRS (1997) Genetic diversity, popu-lation structure and conservation. In: Callow JA, Ford-Loyd BV and Newbury HJ (eds) Biotechnology and Plant Genetic Resources - Conservation and Use. Biotechnology in agri-culture series n. 19, CAB International, Wallingford, Oxon, UK, pp 49-76.
Lou KF, Weiss MJ, Bruckner PL, Morril WL, Tabert LE and Mar-tin JM (1998) RAPD variation within and among geo-graphic populations of wheat stem sawfly (Cephus cinctus
Norton). The American Genetic Association 89:329-335. Liao LC and Hsiao JY (1998) Relationship between population
genetic structure and riparian habitat as revealed by RAPD analysis of the rheophyte Acorus gramineus Soland. (Araceae) in Taiwan. Mol Ecol 7:1275-1281.
Maguire TL and Sedgley M (1997) Genetic diversity inBanksia
and Dryandra (Protaceae) with emphasis on Banksia cuneata, a rare and endangered species. Heredity
79:394-401.
Mahalanobis PC (1936) On the generalized distance in statistics. Proc Natl Inst Sci 2:49-55.
Menges ES (2000a) Population viability analyses in plants. Chal-lenges and opportunities. Tree 15:51-56.
Menges ES (2000b) Applications of population viability analyses in plant. Ecological Bulletins 48:73-84.
Palácios C and González-Candelas F (1997) Analysis of popula-tion genetic structure and variability using RAPD markers in the endemic and endangered Limonium dufourii
(Plumbaginaceae). Mol Ecol 6:1107-1121.
Peever TL and Milgroom MG (1994) Genetic structure of
Pyrenophora terespopulation determined with random
am-plified polymorphic DNA markers. Can J Bot 72:915-923. Scheneider S, Roessli D and Excoffier L (2000) Alerquin ver.
2000. A Software for Population Data Analysis. Genetic and Biometry Laboratory, University of Geneva, Switzer-land.
Silva RSM, Chaves LJ and Naves RV (2001) Caracterização de frutos e árvores de cagaita (Eugenia dysentericaDC) no
sudeste de Goiás, Brasil. Revista Brasileira de Fruticultura 23:320-334.
Skabo S, Vaillancourt RE and Potts, BM (1998) Fine-scale ge-netic structure ofEucalyptus globulusSpp.Globulusforest revealed by RAPDs. Aust J Bot 46:583-594.
Telles MPC, Diniz-Filho JAF, Coelho ASG and Chaves LJ (2001a) Autocorrelação espacial das freqüências alélicas em subpopulações de cagaiteira (Eugenia dysenterica DC,
Myrtaceae) no sudeste de Goiás. Revista Brasileira de Botâ-nica 24:145-154.
Telles MPC, Silva RSM, Chaves LJ, Coelho ASG and Diniz-Filho JAF (2001b) Divergência entre subpopulações de cagaiteira (Eugenia dysenterica)em resposta a padrões
ficos e distribuição espacial. Pesquisa Agropecuária Brasi-leira 36:1387-1394.
Vencovsky R and Crossa J (1999) Measures of representative-ness. In: Borém A, Giúdice MP and Sakiyama NS (eds) Plant Breeding in the Turn of the Millennium. Editora da UFV, Viçosa, pp 335-354.
Zucchi MI, Brondani RPV, Pinheiro JB, Chaves LJ, Coelho ASG and Vencovsky R (2003) Genetic structure and gene flow in
Eugenia dysentericaDC in the Brazilian Cerrado utilizing
SSR makers. Genetics and Molecular Biology 26:449-457.
Wolf FC and Rijn JPV (1993) Rapid detection of genetic variabil-ity in Chrysanthemum (Dendrantema grandifloraTzvelev)
using random primers. Heredity 71:335-341.
Yeh FC, Chong KX and Yang RC (1995) RAPD variation within and among natural populations of Trembling Aspen (Populus tremuloidesMichx) from Alberta. Journal of He-redity 86:454-460.