Pesq. agropec. bras., Brasília, v.51, n.4, p.372-377, abr. 2016 DOI: 10.1590/S0100-204X2016000400010
Correlation network analysis between phenotypic
and genotypic traits of chili pepper
Anderson Rodrigo da Silva(1), Elizanilda Ramalho do Rêgo(2),
Angela Maria dos Santos Pessoa(2) and Maílson Monteiro do Rêgo(2)
(1)Instituto Federal Goiano, Departamento de Agronomia, Rodovia Geraldo Silva Nascimento, Km 2,5, CEP 75790‑000 Urutaí, GO, Brazil. E‑mail: [email protected] (2)Universidade Federal da Paraíba, Laboratório de Biotecnologia Vegetal, Rodovia PB‑079, CEP 58397‑000 Areia, PB, Brazil. E‑mail: [email protected]
Abstract – The objective of this work was to build weighted correlation networks, in order to discover correlation structures and link patterns among 28 morphoagronomic traits of chili pepper related to seedling,
plant, inflorescence, and fruit. Phenotypic and genotypic information of 16 Capsicum genotypes were analyzed. Correlation structures and link patterns can be easily identified in the matrices using the Fruchterman‑Reingold algorithm with correlation network information. Both types of correlations showed the same general link pattern among fruit traits, with high broad‑sense heritability values and high aptitude of the genotypes for agronomic and ornamental breeding. Leaf dimensions are correlated with a cluster of fruit traits. Correlation networks of chili pepper traits may increase the effectiveness of genotype selection, since both correlated traits and groups can be identified.
Index terms: Capsicum, correlation structure, genetic covariance, link pattern, plant breeding.
Análise de rede de correlação entre caracteres fenotípicos
e genotípicos de pimenteiras
Resumo – O objetivo deste trabalho foi construir redes ponderadas de correlação, para descobrir estruturas de correlação e padrões de ligação entre 28 caracteres morfoagronômicos de pimenteiras, relacionados à plântula, planta, inflorescência e fruto. Informações fenotípicas e genotípicas de 16 genótipos de Capsicum foram analisadas. Estruturas de correlação e padrões de ligação podem ser facilmente identificados nas matrizes por meio do algoritmo Fruchterman‑Reingold, com as informações da rede de correlações. Ambos os tipos de correlação mostraram o mesmo padrão geral de ligação entre caracteres de frutos, com altos valores de herdabilidade no sentido amplo e grande aptidão desses genótipos para o melhoramento agronômico e ornamental. As dimensões das folhas estão correlacionadas ao grupo de caracteres de fruto. Redes de correlação de caracteres de pimenteiras podem aumentar a eficácia da seleção de genótipos, uma vez que tanto caracteres correlacionados quanto grupos podem ser identificados.
Termos para indexação: Capsicum, estrutura de correlação, covariância genética, padrão de ligação, melhoramento de plantas.
Introduction
Despite the fact that chili pepper (Capsicum spp.) is
predominantly autogamous, a wide range of variability is available due to this plant ability to cross pollination (Krishnamurthy et al., 2013), with variable rates of allogamy.
For plant breeding purposes, correlation studies
help to determine the traits on which selection should
be based (Olawuyi et al., 2014). Usually, several characters should be considered for characterizing chili. For instance, the Bioversity International (Descriptors
for capsicum (Capsicum spp.), 1995) defines more
than 60 descriptors for characterizing germplasm
bank accessions belonging to the genus Capsicum:
6 for seedling characterization, 19 for plants, 16 for inflorescences, 22 for fruit, and 6 for seed. From these, at least 20 are considered to be highly discriminating descriptors. Therefore, large correlation matrices are often computed for their phenotypic/genotypic studies, making it difficult to analyze all the information.
According to Epskamp et al. (2012), the human visual system is capable of naturally processing highly dimensional information. For instance, we can immediately spot suggestive patterns in a scatter plot,
numerically represented in a matrix. In correlation network analysis, variables are represented by nodes, which are connected by edges. Each edge contains a weight indicating the strength of the correlation. The
stronger the correlation between two variables, the
thicker the line connecting them in the network plot.
A bidimensional network representation of a
p‑dimensional correlation matrix allows the detection
of important structures and complex statistical patterns
that are hard to extract by other means. For instance,
when considering the use of a canonical correlation
analysis to study the relationship among three pre‑determined groups of variables, each one containing five variables, it is necessary to analyze, at least, six canonical functions and 30 canonical coefficients (loadings). Moreover, pre‑determined groups are not always known. By the correlation network plots, not only is it possible to identify clusters of variables, but
it is also possible to see how clusters are connected
(Ursem et al., 2008). Langfelder & Horvath (2008) state that, although there are other statistical techniques for analyzing correlation matrices, network language is particularly intuitive to biologists and allows of simple social network analogies.
Correlation network analysis has been used to characterize complex systems in many areas, such as biology (Ursem et al., 2008; DiLeo et al., 2011; Pearce et al., 2015), finance (Kumar & Deo, 2012), public health (Saba et al., 2014), food science (Monforte et al., 2015). However, we could not find any published work using correlation network in plant breeding.
The objective of this work was to build weighted correlation networks, in order to discover correlation structures and link patterns among 28 morphoagronomic traits of chili pepper related to
seedling, plant, inflorescence, and fruit.
Materials and Methods
Data were extracted from experiments carried out
in two independent environments in Areia, PB, Brazil (06°57ʹS and 35°41ʹW). Sixteen Capsicum annuum
genotypes were evaluated in completely randomized designs, with four replications each. All genotypes are kept at the Horticultural Germplasm Bank of the Universidade Federal da Paraíba (BGH‑UFPB).
Some of them are commercial varieties and some are
landraces from Paraíba state, Brazil.
The genotypes morphoagronomic characterization was done according to Bioversity International
(Descriptors for capsicum (Capsicum spp.), 1995),
for: three seedling descriptors – seedling height (SH), cotyledonous leaf length (CLL), and cotyledonous leaf width (CLW); eight plant descriptors – plant height (PH), stem diameter (SD), stem length (SL), canopy width (CW), leaf length (LL), leaf width (LW), chlorophyll A content (CLA), and chlorophyll B content (CLB); six inflorescence descriptors – flower size (FS), petal length (PL), number of petals (NP), number of anthers (NA), anther length (AL), and filament length (FiL); and 11 fruit descriptors – number of fruit per plant (NFP), fruit weight (FW), fruit length (FL), greatest fruit diameter (GFD), smallest fruit diameter (SFD), pedicel length (PdL), pericarp thickness (PT), placenta length (PcL), number of seed per fruit (NSF), fresh matter (FM), and dry matter content (DMC).
Data were subjected to joint multivariate
analysis of variance, following the random model Y = 1µT + Xα + Zβ +Wγ + ε, in which: Y corresponds
to a (n×p)‑dimensional response matrix, 1 is an n‑dimensional vector containing only the value 1; µ is a p‑dimensional vector of population means; α is a (1×p)‑dimensional matrix of experiment (environmental) effects; β is a (15×p)‑dimensional matrix of genotype effects; γ is a (15×p)‑dimensional matrix of interactions between genotypes and experiments; X, Z, and W are incidence (model) matrices; and ε is an (n×p)‑dimensional matrix of errors. The total number of observations is given by
n = nEnGnr, in which: nE, nG, and nr are the number
of experiments (2), number of genotypes (16), and number of replicates (4), respectively; and p is the number of traits (28).
The phenotypic correlation matrix, RP, was
computed from the matrix of mean squares and cross‑products of genotypes, ΜG =[(n n / nE r G− )( )],
T 1 β β
as the estimate of phenotypic covariance matrix. Then, considering mij as the element
(covariance) at the i‑th (i = 1, 2, ..., 28) row and j‑th (j = 1, 2, ..., 28) column, the corresponding correlation is given by: rij = mij/(miimjj)0.5. This procedure is
equivalent to computing the correlation matrix from the genotype means. The genotypic correlation matrix, RG,
Pesq. agropec. bras., Brasília, v.51, n.4, p.372‑377, abr. 2016 DOI: 10.1590/S0100‑204X2016000400010
Broad‑sense heritabilities, h2, were estimated
according to the following equation:
h2 G2 G2 1 n GE
2 1 n n
2
E E r
=σ σ + σ + σ ,
in which: σG2, σGE2 , and σ2 respectively represent
the variance among genotypes, the variance for the genotypes × experiments interaction, and the residual variance.
The correlation matrices were analyzed by creating
weighted correlation networks, in which connections
among variables are determined by the “adjacency matrix” A = h(R), with the following function:
h(rij) = ½{sgn(│rij│‑ρ)+1},
in which: ρ is the “hard threshold” parameter, which
was set to be null, so that all connections among
variables can be seen. However, the thickness of edges was controlled by applying a cut‑off value equal to 0.6, meaning that only │rij│≥0.6 have their edges
highlighted. The Fruchterman‑Reingold algorithm (Fruchterman & Reingold, 1991) was used to create a force‑directed layout for the network, in which the proximity between nodes (traits) is proportional to the absolute value of correlation between those nodes. Finally, positive correlations were colored in dark green, whereas the negative ones were depicted in red.
The analyses were performed using the software R version 3.1.2 (R Core Team, 2015). The correlation
network procedure was done using the package
“qgraph” (Epskamp et al., 2012).
Results and Discussion
Boxplots were constructed for every trait across the genotypic means, with different colors indicating the descriptor type (Figure 1). Box width (vertical) is proportional to the estimated broad‑sense heritability,
and gives an idea about the genetic basis and breeding
potential. The smallest fruit heritability (0.67) was found for PdL; all other traits had values above 0.92. These results agree with those by Marame et al. (2009), Rêgo et al. (2011), and Silva et al. (2013), who respectively investigated heritability, phenotypic diversity, and genotypic correlations in
Capsicum genotypes. Evaluating F1Capsicum annuum
genotypes, Butcher et al. (2013) found similar values of broad‑sense heritability for FW (0.982), FL (0.983), GFD (0.988), and PT (0.911).
Fruit traits related to agronomic production, such as DMC, FM, FW, and NFP, also showed low variability. For inflorescence traits, the heritability ranged from 0.69 (FiL) to 0.90 (AL). For plant descriptors, the shortest range was found; from 0.93 (LL) to 0.99 (CW). Using information of C. annuum segregating
populations, Santos et al. (2014) also obtained high (>0.8) values of broad‑sense heritability for plant traits, such as CW, PH, and SL.
The seedling heritabilities were: 0.82, for CLW; 0.93, for CLL; and 0.94, for SH. Thus, considering
the high values of h2 for plant and fruit traits, and
that they did not had high variability, a deeper study should be carried out to evaluate these genotypes in
breeding programs, for developing varieties with both
ornamental and agronomic potential.
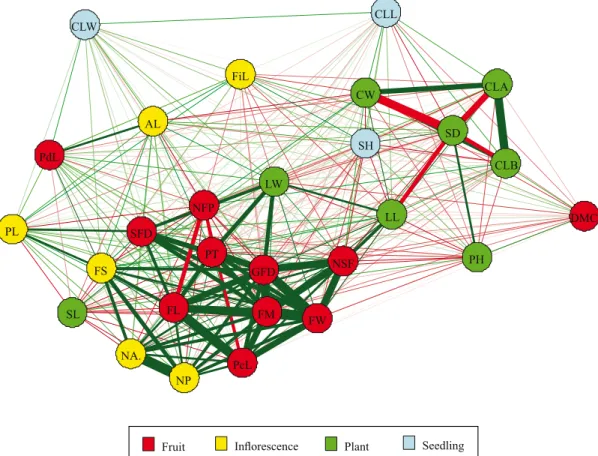
The constructed network with pairwise phenotypic
correlations between traits of seedling, plant,
inflorescence, and fruit is shown in Figure 2. Again, colors indicate the type of genotype descriptor.
Figure 1. Boxplots of morphoagronomic chili pepper
(Capsicum spp.) traits of fruit, inflorescence, plant, and
Initially, the central clustering of fruit traits is what is caught by the eyes. Indeed, except for DMC and PdL, all fruit traits had strong phenotypic correlations. NFP was negatively correlated with FL and PcL, which is an expected result. Butcher et al. (2013) found high (>0.8) significant (p<0.05) values of correlation among FW, FL, and FD. Krishnamurthy et al. (2013) also obtained negative phenotypic correlations (p<0.01) between NFP and FW, and FL. This cluster was connected with the following flower traits: NP, NA, FS, and PL; and also with the plant traits LW and LL. LL is correlated with NSF, and this seems a probable association, since larger values of LL normally indicates higher photosynthetic rate. Likewise, the correlations between LW and GFD, PT, and NFP are plausible. Note that leaf dimensions (LL and LW) are supposed to be correlated,
as it was observed by Stommel & Griesbach (2008). Any other relevant correlation between plant and fruit traits was not found. This complies with the findings of Krishnamurthy et al. (2013), for they obtained weak phenotypic correlations (<0.01) between PH and FL, and FW and NFP.
Another correlation structure involves the following
plant traits: CLA, CLB, SD, and CW. First, we can observe positive associations between chlorophyll content and canopy width, which is quite reasonable. Furthermore, PH showed a positive correlation with SD, as expected, whereas LL showed negative correlation with SD.
In the genotypic correlation network (Figure 3), it is noteworthy the similarity between the phenotypic (Figure 2) and the genotypic correlation patterns
Pesq. agropec. bras., Brasília, v.51, n.4, p.372‑377, abr. 2016 DOI: 10.1590/S0100‑204X2016000400010
related to fruit traits. Genotypic correlations were as strong as the phenotypic ones. Once again, DMC and PdL stood aside in this cluster. Moreover, the same plant (LW and LL) and flower (NP, NA, FS and PL) traits were connected with this cluster, and the second correlation structure, identified in Figure 2 (CLA, CLB, SD and CW), was found again. In fact, all these similar results confirm the high heritabilities observed, that is, the phenotypic variability in these genotypes is mostly determined by genotypic variability.
It is remarkable that fruit traits formed a correlated
group, which means that these genotypes have aptitude for both agronomic and ornamental breeding purposes. However, in case of the improvement for ornamental
purposes, LL and LW should also be considered, and
breeders should also consider the indirect selection
of genotypes with small fruit by selecting plants with small leaves.
Conclusions
1. Correlation networks of chili pepper
(Capsicum spp.) traits may increase the effectiveness
of genotype selection, as both correlated traits and clusters of traits can be identified.
2. Leaf dimensions are correlated with a cluster of
fruit traits, which has implications for indirect selection
in breeding programs.
3. The same general structure of correlations
both phenotypic and genotypic information, which indicates high values of broad‑sense heritability and high aptitude of the genotypes for agronomic and ornamental breeding programs.
Acknowledgements
To Coordenação de Aperfeiçoamento de Pessoal de Nível Superior (Capes) and to Conselho Nacional de Desenvolvimento Científico e Tecnológico (CNPq), for scholarship grants; and to Instituto Federal Goiano, for the financial support; and to Rhys Thomas, for the first manuscript review.
References
BUTCHER, J.D.; CROSBY, K.M.; YOO, K.S.; PATIL, B.; JIFON,
J.L.; ROONEY, W.L. Heterosis in different F1 Capsicum annuum
genotypes for fruit traits, ascorbic acid, capsaicin, and flavonoids. Scientia Horticulturae, v.159 p.72‑79, 2013. DOI: 10.1016/j. scienta.2013.03.022.
DESCRIPTORS for capsicum (Capsicum spp.). Rome: IPGRI,
1995.
DILEO, M.V.; STRAHAN, G.D., BAKKER, M. den; HOEKENGA, O.A. Weighted correlation network analysis (WGCNA) applied to the tomato fruit metabolome. PLoS ONE, v.6, e26683, 2011. DOI: 10.1371/journal.pone.0026683.
EPSKAMP, S.; CRAMER, A.O.J.; WALDORP, L.J.; SCHMITTMANN, V.D.; BORSBOOM, D. qgraph: network visualizations of relationships in psychometric data. Journal of Statistical Software, v.48, p.1‑18, 2012. DOI: 10.18637/jss.v048. i04.
FRUCHTERMAN, T.M.J.; REINGOLD, E.M. Graph drawing by force‑directed placement. Software: Practice and Experience,
v.21, p.1129‑1164, 1991. DOI: 10.1002/spe.4380211102.
KRISHNAMURTHY, S.L.; REDDY, K.M.; RAO, A.M. Genetic variation, path and correlation analysis in crosses among Indian and Taiwan parents in Chilli. Vegetable Science, v.40, p.210‑213, 2013.
KUMAR, S.; DEO, N. Correlation and network analysis of global financial indices. Physical Review E, v.86, p.026101, 2012. DOI: 10.1103/physreve.86.026101.
LANGFELDER, P.; HORVATH, S. WGCNA: an R package for weighted correlation network analysis. BMC Bioinformatics, v.9, p.559, 2008. DOI: 10.1186/1471‑2105‑9‑559.
MARAME, F.; DESSALEGNE, L.; FININSA, C.; SIGVALD, R. Heterosis and heritability in crosses among Asian and Ethiopian parents of hot pepper genotypes. Euphytica, v.168, p.235‑247, 2009. DOI: 10.1007/s10681‑009‑9912‑9.
MONFORTE, A.R.; JACOBSON, D.; FERREIRA, A.C.S. Chemiomics: network reconstruction and kinetics of Port wine
aging. Journal of Agricultural and Food Chemistry, v.63,
p.2576‑2581, 2015. DOI: 10.1021/jf5055084.
OLAWUYI, O.J.; JONATHAN, S.G.; BABATUNDE, F.E.; BABALOLA, B.J.; YAYA, O.O.S.; AGBOLADE, J.O.; AINA, D.A.; EGUN, C.J. Accession × treatment interaction, variability
and correlation studies of pepper (Capsicum spp.) under the
influence of arbuscular mycorrhiza fungus (Glomus clarum) and
cow dung. American Journal of Plant Sciences, v.5, p.683‑690, 2014. DOI: 10.4236/ajps.2014.55083.
PEARCE, S.; FERGUSON, A.; KING, J.; WILSON, Z.A.FlowerNet: a gene expression correlation network for anther and pollen development. Plant Physiology, v.167, p.1717‑1730, 2015. DOI: 10.1104/pp.114.253807.
R CORE TEAM. R: a language and environment for statistical computing. Available at: <http://www.R‑project.org/>. Accessed on: June 18 2015.
RÊGO, E.R. do; RÊGO, M.M. do; CRUZ, C.D.; FINGER, F.L.; CASALI, V.W.D. Phenotypic diversity, correlation and importance of variables for fruit quality and yield traits in Brazilian peppers
(Capsicum baccatum). Genetic Resources and Crop Evolution,
v.58, p.909‑918, 2011. DOI: 10.1007/s10722‑010‑9628‑7. SABA, H.; VALE, V.C.; MORET, M.A.; MIRANDA, J.G.V. Spatio‑temporal correlation networks of dengue in the state
of Bahia. BMC Public Health, v.14, p.1085, 2014. DOI:
10.1186/1471‑2458‑14‑1085.
SANTOS, R.M.C.; RÊGO, E.R. do; BORÉM, A.; NASCIMENTO, M.F.; NASCIMENTO, N.F.F.; FINGER, F.L.; RÊGO, M.M. Epistasis and inheritance of plant habit and fruit quality
traits in ornamental pepper (Capsicum annuum L.). Genetics and Molecular Research, v.13, p.8876‑8887, 2014. DOI: 10.4238/2014.October.31.3.
SILVA, A.R. da; NASCIMENTO, M.; CECON, P.R.; SAPUCAY, M.J.L.C.; RÊGO, E.R. do; BARBOSA, L.A. Path analysis in multicollinearity for fruit traits of pepper. Idesia, v.31, p.55‑60, 2013. DOI: 10.4067/S0718‑34292013000200008.
STOMMEL, J.R.; GRIESBACH, R.J. Inheritance of fruit, foliar,
and plant habit attributes in Capsicum.Journal of the American Society for Horticultural Science, v.133, p.396‑407, 2008. URSEM, R.; TIKUNOV, Y.; BOVY, A.; BERLOO, R. van; EEUWIJK, F. van. A correlation network approach to metabolic data analysis for tomato fruits. Euphytica, v.161, p.181‑193, 2008. DOI: 10.1007/s10681‑008‑9672‑y.