© School of Engineering, Taylor’s University College
CURING OF POLYMERIC COMPOSITES USING MICROWAVE
RESIN TRANSFER MOULDING (RTM)
R. YUSOFF*, M. K. AROUA, A. NESBITT, R. J. DAY
Chemical Engineering Department, University of Malaya 50603 Kuala Lumpur, MALAYSIA
*Corresponding Author: [email protected]
Abstract
The main objective of this work is to compare the difference between microwave heating and conventional thermal heating in fabricating carbon/epoxy composites. Two types of epoxy resin systems were used as matrices, LY5052-HY5052 and DGEBA-HY917-DY073. All composite samples were fabricated using resin transfer moulding (RTM) technique. The curing of the LY5052-HY5052-carbon and the DGEBA-HY917-DY073-carbon composite systems, were carried out at 100 °C and 120 °C, respectively. Microwave heating showed better temperature control than conventional heating, however, the heating rate of the microwave cured samples were slower than the conventionally cured samples. This was attributed to the lower power (250 W) used when heating with microwaves compared to 2000 W used in conventional heating. Study of thermal characteristics as curing progressed showed that the polymerisation reaction occurred at a faster rate during microwave curing than in conventional curing for both the DGEBA and the LY/HY5052 carbon composite systems. The actual cure cycle was reduced from 60 minutes to 40 minutes when using microwaves for curing DGEBA-carbon composites. As for LY/HY5052-DGEBA-carbon composites, the actual cure cycle was reduced from 3 hours to 40 minutes. Both conventional and microwave heating yielded similar glass transition temperatures (120 °C for DGEBA systems and 130 °C for LY/HY5052 systems). Microwave cured composites had higher void contents than conventionally cured composites (2.2-2.8% and 1.8-2.4% for DGEBA and LY/HY5052 microwave cured composites, respectively, compared to 0.2-0.4% for both DGEBA and LY/HY5052 thermally cured composites). C-scan traces showed that all composites, regardless of methods of curing, had minimal defects.
1.
Introduction
The application of microwave heating to polymers and polymeric composites has been pursued worldwide over the past three decades. Microwave processing offers many advantages over conventional thermal processing. Rapid volumetric heating in microwave processing would significantly reduce cycle times and additionally, since power is applied directly to the material, the need to heat processing equipment is avoided and energy requirement are further reduced. In conventional thermal processing, energy is transferred to the material through convection, conduction and radiation of heat from the mould surfaces resulting in long cycle times and high-energy requirements. Thermal gradient during the processing can result in uneven cure, residual stresses and defects in the resultant composites.
The resin transfer moulding (RTM) technique is being increasingly employed in the manufacture of large components of fibre-reinforced composite materials, basically due to its design flexibility and low capital cost. This technique offers a potential manufacturing source of high-volume components for aerospace and automotive industry.
In this study, microwave assisted RTM processing system for polymer matrix composite was designed and developed. Comparison of the structure and properties of composites produced using conventional thermal and microwave assisted RTM processing were made.
2. Theory
Microwave energy is delivered directly to materials through molecular interaction with the electromagnetic field. Most polymer composite materials are
Nomenclatures
Cv Specific Heat of The Material (J/kg K) E Electric Field Strength (V/m)
E’ Storage Modulus f Applied Frequency (Hz) K Constant (55.61×10⁻¹² F/m)
P Microwave Power Dissipation (W/m3) T Temperature (oC)
t Time (sec)
Vf Volume Fraction (%) Subscripts
f Fraction Greek Symbols
α Degree of Cure tan δ Dielectric Loss Tangent
ε* Complex Dielectric Constant
ε’ Real Dielectric Constant
ε’’ Dielectric Loss Factor
nonmagnetic and consist of dielectrics and sometimes conductors. For a conductor, the interaction between microwaves and the materials is determined by the electrical conductivity. For a dielectric, the interaction between the microwaves and the dielectric is dictated by the complex permittivity of the material, ε* (Eq.1), which is also known as the complex dielectric constant.
ε* = ε’ – i ε” (1)
The contribution to permittivity in material comes from a variety of physical phenomena such as ionic conduction, dipole rotation, atomic resonance and electronic resonance. The magnitude of the real permittivity or dielectric constant of material (ε’) reflects the material ability to store electrical energy. The dielectric loss factor of the material (ε”) quantifies the ability of material to dissipate electrical energy into thermal energy.
When an alternating electric field is applied to the material with dipole moments, they try to cancel the field by following the changing direction of the field [1]. The reorientation and the distortion of the dipoles produce frictional heat, hence dissipation of supplied electromagnetic energy. This type of loss of energy is called dielectric loss. Microwave heating of materials is governed by the principle that the dielectric power absorption of the material being processed is proportional to its dielectric loss factor, which determines the rate of conversion of electrical energy into thermal energy in the material. This can be described by the Eq. 2 [2]:
P = K f ε’ E2 tan δ (2)
The heating rate of a material placed in an electromagnetic field depends on several key parameters, more specifically the dielectric loss factor of the material. This can be described by Eq (3) [2].
dT/dt = (K f E2ε’(T) tan δ (T) ) / (ρ Cv) (3) The specific heat terms shows that thermodynamic transitions such as the glass transition temperature and melting of the material will greatly affect the heating susceptibility of the material [3]. The derivation of Eq. 3 also assumes that the convection and conduction losses and also the heat flux due to chemical reactions are ignored.
3.
Methodology
3.1
Raw materials
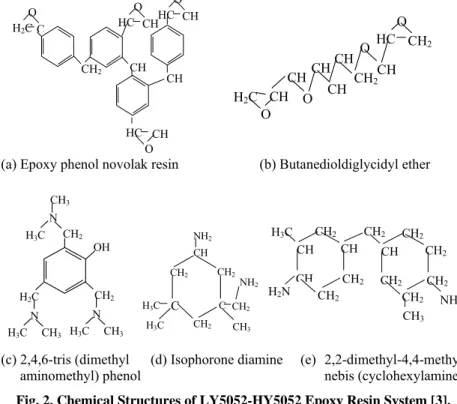
Two epoxy-amine resin systems were used in this study, a two-component resin Araldite LY5052-HY5052 and a three-component resin, Diglycidyl ether of bis-phenol A (DGEBA) with methyl-tetrahydrophthalic anhyride (HY917) as a hardener and amine/phenol complex (DY073) as initiator. The DGEBA resin (Hexcel Composites Ltd) had an average molecular weight of 384. Figure 1 shows the chemical structures of DGEBA and the hardener (HY917). The chemical structures of the LY5052/HY5052 epoxy resin system are shown in Fig. 2. Araldite LY5052/HY5052 epoxy phenol novalak resin system was manufactured by Ciba Speciality Chemicals Inc. The resin component, LY5052 consisted of 60-70% epoxy phenol novolak resin and 34-42% butanedioldiglycidyl ether. The hardener components comprised of three amine cross-linking agents; two difunctional primary amines (50-60% 2,2-dimethyl-4,4-methylenebis (cyclohexylamine) and 35-34% isophorone diamine) and an aromatic tertiary amine (1-5% 2,4,6-tris (dimethyl-aminomethyl) phenol). The reinforcing material used was carbon fibre fabric G0933 (50/50 weft and warp with a five harness satin weave). All the raw materials were supplied by Hexcel Composites Ltd.
(a) DGEBA (b) HY917
Fig. 1. Chemical Structures of DGEBA-HY917 Epoxy Resin System [1].
3.2
Sample preparation
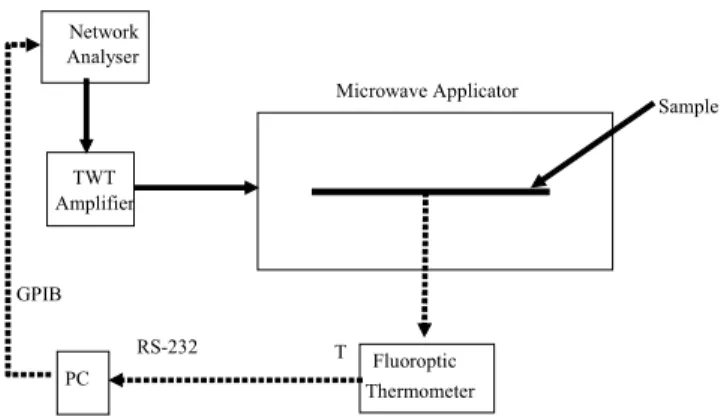
The resin samples were prepared by mixing the resin and the hardener at specific ratio as recommended by the manufacturer. The mixture was then degassed in a vacuum oven to remove any air bubbles that were formed during mixing. Moulding was carried out using a Hypaject Mark II RTM injection system (Plastech Thermoset Tectonics). RTM involved impregnation of carbon fabric in a mould cavity, with a resin, which was then cured (either inside a conventional laboratory oven for thermal heating or inside a microwave applicator for microwave heating). The RTM system is composed of heated resin homogeniser, control unit, pneumatic resin injection valve and heated resin transfer line. A schematic of the RTM processing equipment is shown in Fig. 3.
Microwave system comprises of a variable frequency microwave power source and a microwave applicator as shown in Fig. 4. Initially, electric field distributions within model applicators were simulated to determine a suitable applicator geometry and excitation frequency range. The modelling was carried out using High Frequency Simulator software (Agilent Technology HFSS version
O
C C
CH3
O O
H2C
CH3
C
CH3 CH2
O HC
CH2
CH
O O O
5.6). PTFE moulding tools, which can be fitted inside the microwave applicator, were used to fabricate composites.
(a)Epoxy phenol novolak resin (b) Butanedioldiglycidyl ether
(c) 2,4,6-tris (dimethyl (d) Isophorone diamine (e) 2,2-dimethyl-4,4-methyl aminomethyl) phenol nebis (cyclohexylamine)
Fig. 2. Chemical Structures of LY5052-HY5052 Epoxy Resin System [3].
Fig. 3. Schematic Diagram of Resin Transfer Moulding Equipment.
2 3
4
4 Heated resin transfer line with pneumatic resin injection
5 1 7 6 3 5
Waste acetone drum PTFE or metal mould
Heated reservoir 1
3 2
Inlet valve
Hypaject Mark II RTM
control unit 6
7
Acetone drum
HC CH O
CH2 C
O H2C
CH CH HC CH
O
HC CH O
CH H2C
O CH O CH CH CH CH2 O CH
HC CH2
O
CH CH H3C CH2
CH2
CH2
CH H2N
CH2
CH CH2
CH2
CH2 NH2
CH2
CH3
CH2
CH
C
CH2 CH3
C CH2 CH2 NH2 CH2 NH2
H3C
H3C
OH
CH2 CH2 N CH3
H3C
H2C
CH3 H3C
N
CH3 H3C
Fig. 4. Control Schematic for Microwave RTM Processing.
4. Results and Discussion
4.1
Curing profile comparison between the conventional and
microwave processing of composite systems
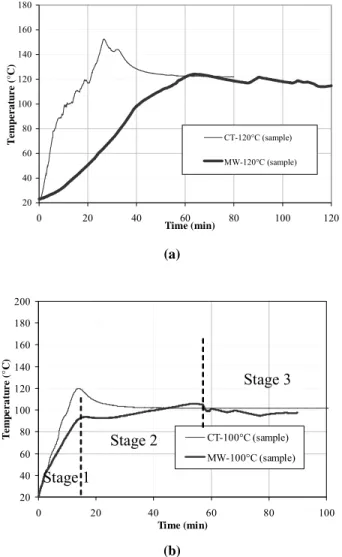
Temperature profiles during curing were monitored at four different locations for microwave curing (two inside the sample and two inside the PTFE mould), and two different locations for the conventional thermal curing (two inside the sample).
Figure 5 (a) shows the temperature profile of the samples during the curing. From this figure, the temperature profile for the thermal curing shows much higher heating rate and the curing temperature was reached in less than 20 minutes. As for the microwave curing, the average time required to attain the cure temperature was 80 minutes. The vast difference in heating rate between the two curing methods was due to the difference in the heating power used. The cartridge heaters used for heating the thermal mould had much higher total power, 2000 W as compared to the maximum microwave power, which was 250 W. Another reason might be due to the nature of DGEBA resin system, which is not reactive below 120 °C [1].
Figure 5 (a) also shows that there were gradual increases in temperature as a function of time for the microwave curing, and the temperature only slightly overshot by ∼5 °C from the cure temperature for both the mould and the sample temperature. During the microwave curing, the temperature was also maintained at 120 ± 4 °C after the cure temperature was reached. All this indicated that the process control developed for the microwave power system was able to achieve temperature stability and uniform heating in the composite sample. At the end of curing cycle, as the sample became cured, the temperature profile gradually decreased. This decrease was most likely due to the decrease in the dielectric loss (ε”) as the polymer structure became a rigid network and also insufficient microwave power being available to maintain the temperature. The rigid network structure hindered the dipolar group motion resulting in less interaction between
Sample Network
Analyser
TWT Amplifier
Fluoroptic Thermometer PC
GPIB
RS-232
Microwave Applicator
the electric field and the dipolar molecules. As for the conventional thermal heating, temperature profile for the cure temperature, 120 °C overshot by 32 °C. This was due to the exothermic chemical reaction that generated internal heat, which dissipated slowly because of poor thermal conductivity of the resin [4]. Figure 5 (b) shows the temperature profile during the curing of the LY/HY5052-carbon composite system. In microwave curing, the trend of temperature profile was divided into three stages. In stage 1 (the initial 15 minutes of curing as indicated in Fig. 4), there was a sharp increase in the heating rate. This most possibly due to heat released from the high chemical reactivity of the functional groups and more heat generated from dielectric heating. The dielectric heating effect is likely to be greater in the early stages of reaction as the concentration and mobility of the dipoles in the resin is higher. The heating rate decreased considerably in stage 2, which indicated that, as the crosslinking progressed (the system gelled and then vitrified), the mobility of the dipoles became more restricted, resulting in reduction of dielectric heating. The cure temperature only overshot by ∼5 °C compared to the programme temperature, which again showed good process control of the microwave power system. In stage 3, the temperature was maintained at 100 ± 3 °C after the cure temperature was attained. At the end of stage 3, as the sample cured, the temperature profile decreased gradually. This decreased suggested that the sample became less lossy (less interaction between the electric field and the dipolar molecules).
For the conventional heating, temperature profile (Tcure = 100 °C) overshot by 20 ± 3°C (refer to Fig. 5 (b)). This indicated poor temperature control in thermal curing. The sample temperature was usually higher than the oven temperature, which was used to control the heating rate.
4.2
Curing characteristics
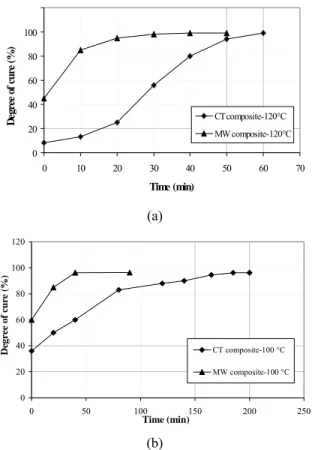
Conventional DSC was used to obtain degree of cure for both microwave and conventionally cured samples. DSC dynamic scans were carried out at regular time intervals through out the curing process. DSC scans were performed from 50 °C to 300 °C at 10 °C/min heating rate. The scans were used to obtain degree of cure (α) as a function of cure time. Fig. 6 shows plots of α as a function of curing time for the DGEBA/HY917-carbon and LY/HY5052 carbon composites. From this figure, the cure cycles for both microwave and thermal methods were obtained and tabulated in Table 1. The cure cycles were determined from the curing time when the sample reached ultimate degree of cure (α).
similar ultimate degree of cures was obtained for all samples regardless of methods of curing (99% for DGEBA systems and 96.1% for LY/HY5052 systems).
(a)
(b)
Fig. 5. Temperature profile during curing of (a) DGEBA-carbon composite systems, (b) LY/HY5052-carbon composite system at different cure temperatures and methods of curing (CT = conventional thermal, MW =
microwave).
20 40 60 80 100 120 140 160 180
0 20 40 60 80 100 120
Time (min)
T
e
mp
er
at
u
re (°
C)
CT-120°C (sample)
MW-120°C (sample)
20 40 60 80 100 120 140 160 180 200
0 20 40 60 80 100
Time (min)
T
e
m
p
er
at
u
re (
°C
)
CT-100°C (sample)
MW-100°C (sample)
Stage 2
Stage 1
Table 1. Cure Cycles for Different Processing Methods for DGEBA/HY917-Carbon and LY/HY5052-DGEBA/HY917-Carbon Composite Systems.
Processing Method Tcure
(°C)
Actual Cure Cycle (min)
Conventional (DGEBA/HY917-carbon) 120 60 Microwave (DGEBA/HY917-carbon) 120 40 Conventional (LY/HY5052-carbon) 100 180 Microwave (LY/HY5052-carbon) 100 40
(a)
(b)
Fig. 6. Degree of Cure as a Function of Curing time for (a) DGEBA/HY917-Carbon Composites, (b) LY/HY5052-DGEBA/HY917-Carbon Composites (CT = conventional
thermal, MW = microwave).
4.3
Thermal properties
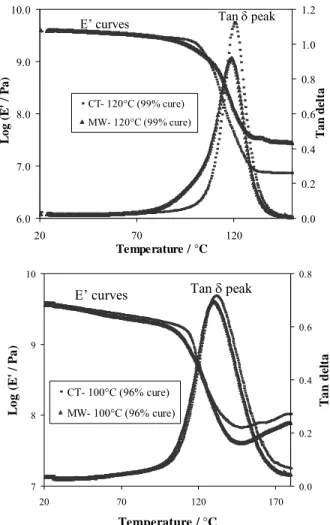
DMTA was used to determine the dynamic mechanical properties such as storage modulus (E’) and loss tangent (tan δ). Comparison between cured samples produced by conventional and microwave method is shown in Fig. 7 for DGEBA/HY917-carbon and LY/HY5052-carbon composite systems. Figure 7 (a) shows that all DGEBA/HY917-carbon samples (microwave or
0 20 40 60 80 100 120
0 10 20 30 40 50 60 70
Time (min)
D
eg
ree
o
f
cu
re
(
%
)
CT composite-120°C
MW composite-120°C
0 20 40 60 80 100 120
0 50 100 150 200 250
Time (min)
D
eg
ree
of
cure
(
%
)
CT composite-100 °C
conventionally cured) had similar glass transition temperatures (122 ° C), which implied the same extent of cure for all samples regardless of methods of curing. This figure also shows that the height and width of the tan δ peaks were different; when comparing the two cure methods, microwave cured samples had broader and much lower peaks than conventionally cured samples. This might suggest a broader molecular weight distribution and/or morphological heterogeneity [8].
Figure 7 (b) shows that both microwave and conventionally cured samples of LY/HY5052-carbon had a similar glass transition temperature (Tg = 130
o C). This figure also shows that E’ and tan δ curves for both microwave and conventionally cured samples did not vary significantly.
(a)
(b)
Fig 7. Storage modulus (E’) and loss tangent (tan δ) curves obtained from DMTA for (a) DGEBA/HY917-carbon composites, (b) LY/HY5052-carbon
composites (CT = conventional thermal, MW = microwaves) 6.0
7.0 8.0 9.0 10.0
20 70 120
Temperature / °C
L
o
g
(
E
' / P
a ) 0.0 0.2 0.4 0.6 0.8 1.0 1.2 T a n de lt a
CT- 120°C (99% cure)
MW- 120°C (99% cure)
E’ curves Tan δpeak
7 8 9 10
20 70 120 170
Temperature / °C
Lo g ( E ' / P a ) 0.0 0.2 0.4 0.6 0.8 T a n de lt a
CT- 100°C (96% cure)
MW- 100°C (96% cure)
4.4
Defects
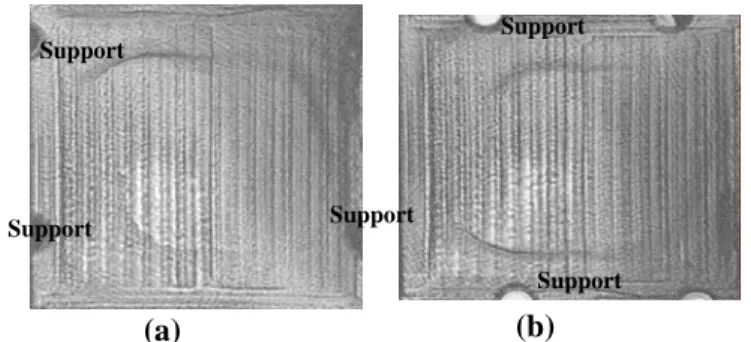
Defects in the fabricated composites are mainly in the form of voids, misalignment of fibres and lack of wetting during resin injection. In this study C-scan and image analysis were used to study the defects in the composite panels. C-scan was used to gauge the extent of defects in each cured laminate prior to testing. C-scan did not give an absolute value of void content but it could detect which panel contained more defects than others. For absolute values of void contents in the panels, image analysis was used.
In general, C-scan results for both conventionally and microwave cured composite panels showed minimal defects. Fig. 8 and Fig. 9 show examples of amplitude scan traces obtained from composite panels with few defects. The multiple lines observed in all amplitude scan traces were the milling marks obtained from fabrication of the moulds. This showed that the C-scan was quite sensitive and could detect the milling lines, which were on the bottom surface of the panels. No significant difference can be seen between the conventionally and microwave cured composite panels as shown in Fig. 8 (LY/HY5052-carbon fibre composite panels) and Fig. 9 (DGEBA-carbon fibre composite panels).
Fig. 8. Amplitude scan traces of fully cured LY/HY5052-carbon fibre composite panels cured at 100 °C using PTFE moulds: (a) conventional thermal method (actual cure cycle = 3 hours), (b) microwave method (actual
cure cycle = 40 minutes).
Fig. 9. Amplitude Scan Traces of Fully Cured DGEBA-carbon Fibre Composite Panels Cured at 120 °C using PTFE Moulds: (a) Conventional Method (Actual Cure Cycle = 1 hour), (b) Microwave Method (Actual Cure
Cycle = 40 minutes).
(b)
Support Support
Support Support
Support
(a)
(a)
Support Supports
Supports
Supports
Supports
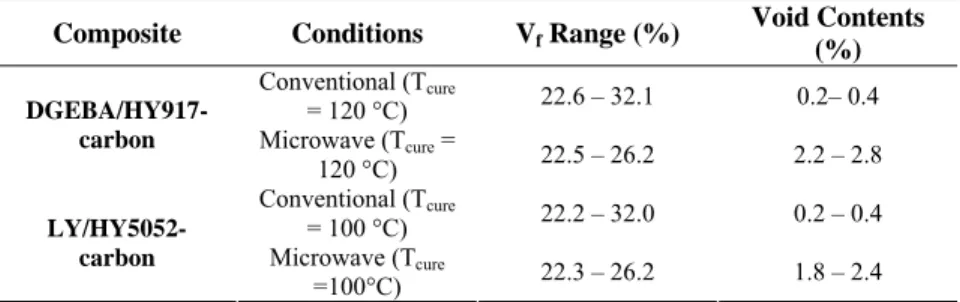
Overall results showed that all composites had low void contents (< 3%). The results for void contents are summarised in Table 2. Microwave cured samples had slightly higher void contents than conventionally cured samples. Higher void contents in the microwave cured composites were partly due to much shorter curing time in the microwave resulting in voids being susceptible to being trapped in the materials [9].
Table 2. Overall Void Contents of Cured Composite Samples.
Composite Conditions Vf Range (%) Void Contents
(%) Conventional (Tcure
= 120 °C) 22.6 – 32.1 0.2– 0.4
DGEBA/HY917-carbon Microwave (Tcure =
120 °C) 22.5 – 26.2 2.2 – 2.8
Conventional (Tcure
= 100 °C) 22.2 – 32.0 0.2 – 0.4
LY/HY5052-carbon Microwave (Tcure
=100°C) 22.3 – 26.2 1.8 – 2.4
5. Conclusions
1. Better control of temperature was observed during the microwave curing of both composite systems as compared to the thermal curing.
2. The actual cure cycle was reduced from 60 minutes to 40 minutes (for curing DGEBA-carbon composites) and from 3 hours to 40 minutes (for LY/HY5052-carbon composites when using microwave heating.
3. Similar glass transition temperature (Tg) and ultimate degree of cure (α) were obtained from composites cured using both microwave and thermal methods. 4. C-scan results for both conventionally and microwave cured composite
panels showed minimal defects. Minimal void contents (< 3%) were obtained for all composite samples.
References
1. Katakura,Y. (2001). Microwave Curing of Diglycidyl Ether of Bisphenol A/4-cyclohexane-1, 2-dicarboxylic Anhydride Resin System. M. Sc. Dissertation. UMIST.
2. Chen, M., Siochi. E. J., Ward, T. C. & McGrath, J. E. (1993). Basic ideas of microwave processing of polymers. Polymer Engineering and Science. 33, 1092-1109.
3. Suckley, D.R. (2000). Microwave Processing of the Araldite LY5052:HY5052 Epoxy Resin System. M. Sc. Dissertation. UMIST.
5. Zhou, J., Shi, C., Mei, B., Yuan, R. & Fu, Z. (2003). Research on the technology and mechanical properties of the microwave processing of polymer. Journal of Materials Processing Technology. 137, 156-158.
6. Boey, F.Y.C., Yap, B.H. & Chia, L. (1999). Microwave curing of epoxy-amine system – Effect of curing agent on the rate of enhancement. Polymer Testing. 18, 93-109.
7. Wei, J., Hawley, M.C. & Demeuse, M.T. (1995). Kinetics modelling and time-temperature-transformation diagram of microwave and thermal cure of epoxy resins. Polymer Engineering and Science. 35(6), 461-470.
8. Mijovic, J. & Wijaya, J. (1990). Comparative calorimetric study of epoxy cure by microwave vs thermal energy. Macromolecules. 23, 3671-3674. 9. Bai, S.L. & Djafari, V. (1995). Interfacial properties of microwave cured