Electromagnetic characterization of microwave sintered
Sr
1-xCa
xMnO
3 (0.0 ≤ x ≤ 0.4) thick ilmsRani P. Pawar, Ninad B. Velhal, Vijaya R. Puri*
Thick and Thin Film Device Lab, Department of Physics, Shivaji University, Kolhapur 416004, India
Received 14 December 2012; received in revised form 21 January 2013; accepted 4 February 2013
Abstract
Electromagnetic characteristics of microwave sintered strontium calcium manganites thick ilm with variation in calcium content have been investigated. The X-ray diffraction analysis reveals tetragonal perovskite struc-ture for all the compositions. The grain size increases with the increase in calcium content. The microwave absorption, complex permittivity, permeability and conductivity are reported in the frequency range of 8.2–18 GHz. The absorption loss is larger in Ku band while insertion loss is larger in X band. The permittivity, perme-ability and microwave conductivity decreases from X-band to Ku-band. The almost identical values of real part of permittivity and permeability indicate possible application as materials for impedance matching.
Keywords: manganites thick ilms, microwave absorption, dielectric and magnetic properties
I. Introduction
The methods for material property characterizations at microwave frequencies are based on transmission lines and the resonant structures developed from transmission lines [1]. With the development of radar, microwave communication technology and especially the need for antielectromagnetic interference coatings, self-conceal-ing technology and microwave darkrooms the study of electromagnetic wave absorbing materials has increased in recent years [2–4]. The permittivity and permeability are very important properties of any medium, which de-scribe how the electromagnetic waves propagate through that medium. Broadband electromagnetic device appli-cations make it essential to measure the complex permit-tivity and permeability of materials over a wide range of frequencies. There are many ways to measure the com-plex permittivity of the sample, such as time and frequen-cy domain relection and transmission method, guided wave method, impedance method etc. [5].
Emerging trends in material synthesis indicate that rapid synthetic routes are becoming increasingly im-portant to realize new compositions and metastable phases and materials with distinct particulate proper-ties [6]. Conventional co-precipitation method is a
dif-fusion controlled process involving counter difdif-fusion of the cations through the product layer. This diffusion process is controlled by an energy barrier and can be represented as D =D0∙e–ΔG/RT. To overcome this ener-gy barrier a relatively high thermal enerener-gy (>1000 °C) is normally required, which however leads to long pro-cessing time. This kinetic and thermodynamic barrier encountered can thus be overcome by initiating in-situ exothermic reactions often achieved through wet-chem-ical means [7] along with microwave sintering. The mi-crowave heating has advantages due to the enhanced diffusion processes, reduced energy consumption, very rapid heating rates and considerably reduced process-ing times, decreased sinterprocess-ing temperatures, improved physical and mechanical properties, simplicity, unique properties and lower environmental hazards.
Thick ilm technology has proved to be a cost-ef -fective method highly conducive to planarization and useful for miniaturized high-frequency components. Although the concept of thick ilm structures is quite at -tractive, they are not very widely used.
In this paper, the high-frequency (8.2–18 GHz) in -sertion loss, absorption loss, permittivity and permea-bility of Sr1-xCaxMnO3 thick ilm is reported. The per -mittivity and permeability have been measured by using voltage standing wave ratio (VSWR) method [8]. To the author’s knowledge, the permittivity and permeability
* Corresponding author: tel: +91 0231 2609230
of Sr1-xCaxMnO3 thick ilm using VSWR technique in the frequency range 8.2–18 GHz are reported for the irst time. All the studies have been undertaken in the absence of external magnetic ield.
II. Experimental
Sr1-xCaxMnO3 powders were prepared by chemical co-precipitation method using strontium nitrate, calcium nitrate, manganese nitrate and oxalic acid as starting ma-terials. A solution of strontium, manganese and calcium nitrates, with concentration of 0.5 M, was prepared and added drop wise to 2 M hot (750 °C) oxalic acid solution with constant stirring. The chemicals were weighed ac-cording to required stoichiometric proportion by varying calcium content, x = 0.0, 0.2, 0.4. After cooling to room temperature the precipitate was iltered, washed with dis -tilled water and dried. The prepared powder was sintered at 900 W for 5 h in microwave oven (model CE104VD, output power adjustable, 2450 MHz). Thick ilm paste of Sr1-xCaxMnO3 was prepared by mixing the manga-nite powder (84 wt.%) with organic vehicle and Bi2O3 (8 wt.%) and an inorganic binder (8 wt.%). The manganite pastes were then screen printed on the alumina substrate, dried and then ired in a microwave oven for 10 min at 300 W. The thickness of the prepared thick ilms was ~30 μm, measured by gravimetric method. The Sr1-xCaxMnO3 thick ilms were characterized by X-ray diffraction, XRD, us -ing Cr-Kα radiation, (λ = 2.2890 Ǻ) (Philips Diffractom -eter PW3710) and scanning electron microscopy, SEM (JSM-6360 JEOL, Japan).
The transmission and relection of Sr1-xCaxMnO3 (0.0 ≤ x ≤ 0.4) thick ilms were measured by the rectan
-gular waveguide relectometer set up shown in Fig. 1. Transmission of microwaves due to thick ilm was mea -sured point by point using transmission/relection meth -od with rectangular waveguide, consisting of the X- and Ku-band generator, isolator, attenuator, directional cou-pler and RF detector. The system was calibrated by measuring the output with and without the device un-der test (DUT). The microwave insertion loss (INL) of Sr1-xCaxMnO3 thick ilms was calculated from transmis -sion coeficient of the sample using the formula:
(1)
where, VT is transmitted output power by thick ilm, and VI is the incident power on thick ilm.
III. Results and discussion
The X-ray diffraction technique was used to conirm the presence of crystalline phases and to study the in-luence of atmosphere on the calcinations process. The thick ilms have tetragonal perovskite structure with the preferred texture along (310). A typical XRD pattern of composition Sr1-xCaxMnO3 with space group of I4/mcm
is shown in Fig. 2. From the igure it is observed that as calcium concentration increases the intensity of all the peaks increases except 101 peak which decreases. This suggests that increasing the content of Ca at the Sr site progressively removes the crystal distortion. The lattice
Figure 1. Schematic of microwave relectometer setup for transmission and relection of Sr1-xCaxMnO3 thick ilm
Figure 2. X-ray diffraction pattern of Sr1-xCaxMnO3
(0.0 ≤ x ≤ 0.4) thick ilm
Table 1. Lattice parameter, cell volume and actual density of Sr1-xCaxMnO3 (0.0 ≤ x≤ 0.4) thick ilm ceramic
Composition, x Lattice Parameter Cell Volume Actual Density
a [Ǻ] b [Ǻ] c [Ǻ] [Ǻ3] [g/cm3]
0.0 8.6127 8.6127 3.8102 282.64 3.45
0.2 8.5924 8.5924 3.8075 281.10 3.82
0.4 8.5748 8.5748 3.7941 278.96 4.55
I T
parameter and unit cell volume of the compounds de-crease with calcium content (Table 1). The reason might be that the radius of Ca2+ is smaller than Sr2+, indicat-ing that the lattice shrinks and unit cell becomes smaller with increasing calcium concentration. This can be cor-related with increase in Mn4+ content with doping, which has smaller size (0.53 Å) than the Mn3+ ion (0.645 Å).
The actual density (ρ) was calculated using the for-mula:
(2)
where m is the mass of the ilm, πr2 is the surface of
the ilm and h is the thickness of the ilm. The change
of the calculated density with calcium concentration is shown in Table 1. The density increased linearly with increase in Ca concentration from 3.45 g/cm3 to 4.55 g/cm3. This increase may be attributed to: i) increase of rate of cation inter dispersion due to Ca2+ ions and ii) the increase in the reactivity of the ine manganite grains which combine to form bigger grains leading to pore re-duction and volume contraction.
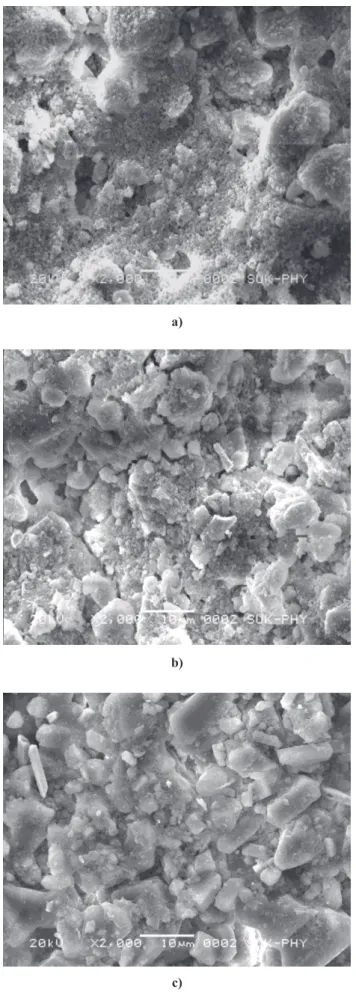
Figure 3 shows the scanning electron micrographs of the Sr1-xCaxMnO3 (0.0 ≤ x ≤ 0.4) thick ilm, and it can be
observed that as calcium concentration increases grain size increases. Initially for x = 0.0 spherical shaped ine
grains of size 40 nm along with stacked lakes are ob -served, but due to increase in the calcium concentration these lakes start to coalesce and arranging themselves in lower like morphology. For x = 0.4 all these grains become compact and forming tabular structure of width 400 nm. This may be due to higher atomic mobility of Ca2+ ions induced by liquid phase sintering.
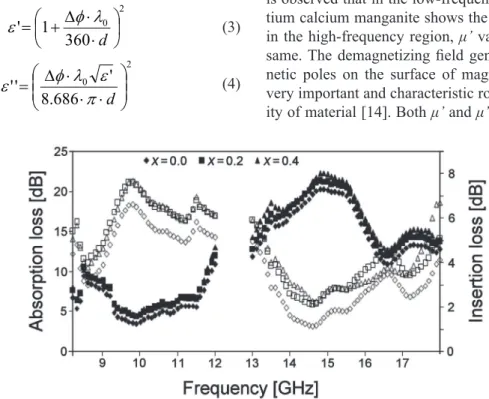
Figure 4 shows the insertion loss as well as absorp-tion loss of the Sr1-xCaxMnO3 thick ilms in the frequen -cy range 8.2 GHz to 18 GHz. From the igure it can be seen that in the frequency range 8.2 GHz to 18 GHz composition dependent variations are more pronounced in insertion loss than in the absorption loss. The com-position with x = 0.0 shows the minimal absorption loss. Insertion loss measures the energy absorbed by the transmission line in the direction of the signal path. Insertion loss is a combination of multiple sources of loss, which include: dielectric loss (related to loss tan-gent), connector losses and impedance mismatches (re-lections), conductor losses and radiation losses. Min -imum in absorption loss means that material is more microwave absorbing. At 9.7 GHz the insertion loss has maximum of ~22 dB indicating that the Sr1-xCaxMnO3 (0.0 ≤ x ≤ 0.4) thick ilm is less transmitting and more
absorbing (absorption loss is minimal). Between 13.5 to 16.2 GHz the absorption loss becomes high again. At ~17.2 GHz the absorption loss becomes maximal whereas the insertion loss has minimal value. It means that strontium calcium manganite shows high transmit-tance. Absorption is the heat loss under the action
be-Figure 3. Scanning electron microscope images of Sr1-xCaxMnO3 thick ilms: a) x = 0.0,
b) x = 0.2 and c) x = 0.4 c)
b) a)
h r m
tween electric dipole or magnetic dipole in material and the electromagnetic ield.
Usually, the microwave absorbing properties of the manganites are dominated by the magnetic and di-electric losses [9]. In order to know the parameter that dominates the absorption of these oxides, the complex dielectric permittivity ε (ε’ - iε”) and magnetic permea-bility μ (μ’ - iμ”) were examined. The frequency depen-dence of the dielectric and magnetic absorption losses, tan δε = (ε”/ε’) and tan δμ = (μ”/μ’), were also calculat-ed. From the position of the voltage standing wave min-imum and using the Smith chart [10] the real and imag-inary permittivity were obtained. The Smith chart was used to ind the phase change due to the manganite ma -terial in the path of microwaves.
Permittivity and permeability of strontium calcium manganite can be determined using the VSWR mea-surement set up. The VSWR meamea-surement setup was almost the same as the waveguide relectometer setup; instead of two 3 dB directional couplers VSWR slot-ted section was used. Initially the slotslot-ted section was calibrated with air and alumina. The alumina and man-ganite thick ilms acts as a load to the transmission of the microwaves and microwaves relected back from that load. The positions of the minimum of the standing wave were compared with that of air. As impedance is mismatched, the position of the minimum is shifted by placing the thick ilms as load. The relection coeficient was also measured. The Smith chart was used to ind the phase change due to the Sr1-xCaxMnO3 (0.0 ≤ x ≤ 0.4)
thick ilm in the path of microwaves and permittivity measured by using the formula [11]:
(3)
(4)
where Δϕ is phase difference between incident and re-lected waves, λ0 is guided wavelength and d is
thick-ness of the sample.
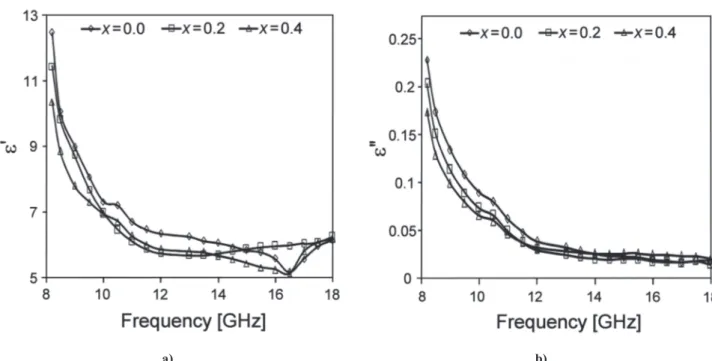
From Fig. 5 it is observed that ε’ values are almost constant between 11 to 18 GHz but they increase slight -ly for frequencies below 11 GHz which suggest that the most probable mechanism in this frequency range is orientational polarization [12]. Composition depen-dent variations are also observed it means that as calci-um content increases in stronticalci-um manganite real part of permittivity decreases. For x = 0.0 the value of ε’ is 12.6 but for x = 0.4 it decreases to ~10.2 this may be at -tributed to decrease in mobility of charge carrier with increase in calcium concentration. In case of the dielec-tric loss (ε”) as frequency increases in the 8.2–18 GHz range loss decreases from 0.23 and becomes minimal of about 0.01 at 18 GHz. Below 12 GHz the thick ilms of all compositions show larger loss. The absorption data also show similar frequency dependent effects.
The real and imaginary permeability of the calcium strontium manganite thick ilm is shown in Fig. 6. The permeability of the Sr1-xCaxMnO3 thick ilms were cal -culated from the relectance using formula [13]:
(5)
(6)
where G is relectance in dB and C is standardizing co-eficient obtained from standard sample. From Fig. 6 it is observed that in the low-frequency region the stron-tium calcium manganite shows the larger μ’ value, but in the high-frequency region, μ’ values are almost the same. The demagnetizing ield generated by the mag -netic poles on the surface of mag-netic illers plays a very important and characteristic role in the permeabil-ity of material [14]. Both μ’ and μ” show a decreasing
Figure 4. Effect of calcium on microwave absorption loss and insertion loss. Dark symbols represent the absorption loss while unilled symbols represent the insertion loss.
trend with increasing frequency, due to the lower reso-nance frequency range of the strontium calcium manga-nite powder than the measured frequency range (8.2–18 GHz) [15]. The enhanced μ’ and μ” values will improve the microwave absorbing effect by transferring electro-magnetic energy into heat energy [16].
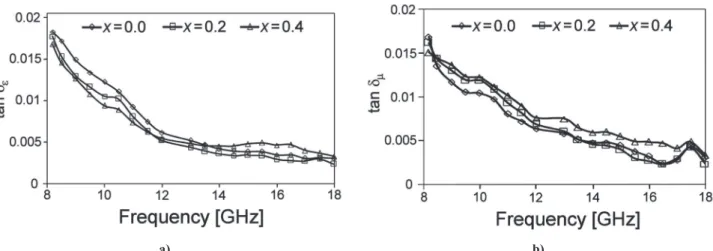
The electromagnetic loss mechanism of the materi-als can be explained by the characteristic change of loss tangent (loss factor) for Sr1-xCaxMnO3 (0.0 ≤ x ≤ 0.4).
According to the data of electromagnetic parameters (complex permittivity and complex permeability), the relations between the dielectric loss tangent (tan δε) and magnetic loss tangent (tan δμ) and microwave frequency for the samples have been calculated, as shown Fig. 7.
In the whole range of frequency, the value of tan δε is similar to tan δμ. The frequency dependent dielectric loss is more prominent in the X-band than in the Ku-band, whereas the frequency dependent magnetic loss
decreases linearly up to 18 GHz. Magnetic losses are caused by the time lag of the magnetization vector M
behind the magnetic ield vector H [9]. The change of the magnetization vector is generally brought about by rotation of the magnetization or the domain wall dis-placement. These motions lag behind the change of the magnetic ield and contribute to μ’’. The smaller the particle size, the weaker the spins coupling at the sur-face of the particle, which makes the magnetic relax-ation behaviour more complex, and will give rise to a magnetic loss mechanism.
The microwave conductivity of the Sr1-xCaxMnO3 (0.0 ≤ x ≤ 0.4) thick ilms was calculated using the for -mula [17]:
(7)
where ω is angular frequency, εo is permittivity of free space and ε” is dielectric loss of material.
Figure 5. Variation of real and imaginary part of permittivity of Sr1-xCaxMnO3 (0.0 ≤ x ≤ 0.4) thick ilm with frequency
Figure 6. Frequency dependent real and imaginary part of permeability of Sr1-xCaxMnO3 (0.0 ≤ x ≤ 0.4) thick ilm
b)
b) a)
a)
'' 0
ε
ε
ω
From Fig. 8, it is observed that as calcium con-tent increases microwave conductivity decreases. The conductivity varies from ~0.1 S/cm for the composi -tion x = 0, ~0.09 S/cm for x = 0.2 and >0.08 S/cm for x = 0.4. As calcium content increases the frequency de-pendent variations are decreased. Conduction is caused by the hopping of electrons between the Mn3+ and Mn4+. In other words it can be described with:
Mn3++Ca2++Mn4+ ↔ Mn4++Ca++Mn4+
Mn3++Ca2++Mn4+ ↔ Mn4++Ca2++Mn3+
This means that both Mn and Ca cations act as hop-ping ions which causes the decrease in the conductivity. To the authors knowledge there are no reports avail-able on the microwave conductivity of Sr1-xCaxMnO3 thick ilm in the 8.2–18 GHz frequency range.
IV. Conclusions
The Sr1-xCaxMnO3 thick ilms, synthesized by chemical co-precipitation method and deposited by screen printing, show absorbing nature over a large range of frequency in the X-band (minimum absorp
-tion loss) whereas transmitting nature in the Ku-band region (minimum insertion loss) of the electromagnet-ic spectrum. Densielectromagnet-ication could be achieved by mi -crowave sintering technique with low sintering tem-perature and reduced soaking time, which results in low emission of nitrates and hence the process is envi-ronmentally friendly. Uniform and ine grains as well as lakes and tabular structure were observed as a re -sult of calcium doping. The investigation of complex dielectric permittivity and magnetic permeability indi-cates that the absorption can be ascribed to the mag-netic and dielectric losses. The microwave permittivity of the Sr1-xCaxMnO3 (0.0 ≤ x ≤ 0.4) thick ilms decreas -es with increase in calcium concentration. The micro-wave conductivity also decreases with the increase in calcium content. Both permittivity as well as perme-ability matches with each other, i.e. ε* = μ* indicat-ing that the strontium calcium manganite can be used as an impedance matched material. The unique prop-erties of the doped manganese oxides provide an im-portant foundation for developing the materials with strong microwave absorption in certain band as well as high transmittance in certain bands resulting in wide application prospects.
Acknowledgements: One of the authors Vijaya Puri would like to thank the UGC India for Award of Re -search Scientist ‘C’. R.P. Pawar would like to thank the DST PURSE scheme for their inancial support. All authors acknowledge the UGC-SAP and DST-FIST.
References
1. S. Borah, N.S. Bhattacharyya, “Broadband measure-ment of complex permittivity of composite at micro-wave frequencies using scalar scattering parameters”,
Prog. Elect. Resear. M., 13 (2010) 53–68.
2. H.S. Cho, S.S. Kim, “M-exaferrites with planar mag -netic anisotropy and their application to high-frequen-cy microwave absorbers”, IEEE Trans. Magn., 35
(1999) 3151–3153. Figure 8. Frequency dependent variations in microwave
conductivity of Sr1-xCaxMnO3 thick ilm
Figure 7. The dielectric and magnetic losses, tan δє and tan δμ, as a function of frequency for x = 0.0, 0.2, 0.4 b)
3. S.P. Ruan, B.K. Xu, H. Suo, F.Q. Wu, S.Q. Xiang, M.Y. Zhao, “Microwave absorptive behavior of ZnCo-substi-tuted W-type Ba hexaferrite nano crystalline composite material”, J. Magn. Magn. Mater., 212 (2000) 175–177. 4. M.R. Anantharaman, S. Sindhu, S. Jagatheesan, K.A.
Malini, P. Kurian, “Dielectric properties of rubber fer-rite composites containing mixed ferfer-rites”, J. Phys. D: Appl. Phys., 32 (1999) 1801–1810.
5. U.C. Hasar, “Unique permittivity determination of low-loss dielectric materials from transmission mea-surements at microwave frequencies”, Prog. Elect. Resear., 107 (2010) 31–46.
6. P.R. Bonneau, R.F. Jarvis, R.B. Kaner, “Rapid solid-state synthesis of materials from molybdenum disul-phide to refractories”, Nature, 349 (1991) 510–512. 7. R.K. Sahu, M.L. Rao, S.S. Manoharan, “Microwave
syn-thesis of magneto resistive La0.7Ba0.3MnO3 using inor-ganic precursors”, J. Mater. Sci., 36 (2001) 4099–4102. 8. R.N. Jadhav, V. Puri, “Microwave absorption,
con-ductivity and complex permittivity of fritless Ni(1-x)CuxMn2O4 (0 ≤ x ≤ 1) ceramic thick ilm: effect of copper”, Prog. Elect. Resear. C., 8 (2009) 149–160. 9. R.P. Pawar, R.N. Jadhav, V. Puri, “Effect of Ca on mi-crowave properties of strontium mangnaite synthe-sized by microwave processing”, Elect. Mater. Lett.,
8 [3] (2012) 321–324.
10. D.C. Kulkarni, U.B. Lonkar, V. Puri, “High-frequency permeability and permittivity of NixZn(1-x)Fe2O4 thick ilm”, J. Magn. Magn. Mater., 320 (2008) 1844–1848.
11. M.B. Shelar, R.N. Jadhav, V. Puri, “Microwave studies of ferrite-ferroelectric composites prepared through self propagating auto combustion route”, Prog. Elect. Resear. C., 17 (2010) 55–65.
12. S.S. Kim, S.T. Kim, J.M. Ahn, K.H. Kim, “Mag -netic and microwave absorbing properties of Co–Fe thin ilms plated on hollow ceramic microspheres of low density”, J. Magn. Magn. Magn., 271 (2004) 39–45.
13. D.C. Kulkarni, V. Puri, “Ku band microwave studies of fritless strontium hexaferrite thick ilms”, Micro-elect. Int., 27 (2010) 143–147.
14. C.H. Peng, H.W. Wang, S.W. Kan, M.Z. Shen, Y.M. Wei, S.-Y. Chen, “Microwave absorbing materi -als using Ag-NiZn ferrite core-shell nanopowders as illers” J. Magn. Magn. Mater.,284 (2004) 113– 119.
15. X.L. Dong, X.F. Zhang, H. Huang, F. Zuo, “Enhanced microwave absorption in Ni/polyaniline nanocompos -ites by dual dielectric relaxations”, Appl. Phys. Lett.,
92 (2008) 013127.
16. Z. Zou, A.G. Xuan, Z.G. Yan, Y.X. Wu, N. Li, “Prep -arationof Fe3O4 particles from copper/ironore cinder and their microwave absorption properties”, Chem. Eng. Sci., 65 (2010) 160–164.
17. S.N. Mathad, R.N. Jadhav, R.P. Pawar, V. Puri, “Di-electric spectroscopy and microwave conductivity of bismuth strontium manganites at high frequencies”,