Efect of Activated Carbons on the Dielectric and Microwave Properties of Natural Rubber
Based Composites
Abdullah G. Al-Sehemia,b, Ahmed A. Al-Ghamdic, Nikolay Dishovskyd*, Radostin N. Nickolove,
Nikolay T. Atanasovf,g, Liliya T. Manoilovae
Received: April 17, 2017; Accepted: June 19, 2017
The efect of six diferent types of activated carbons has been studied in view of their applicability as functional illers upon the dielectric and microwave properties of natural rubber based composites. It is found that the textural characteristics of the studied active carbons exert inluence both on the real part of dielectric permittivity and dielectric loss angle tangent, as well as on the microwave properties of the studied composites. The composite containing activated carbon on the basis of wooden material possesses the highest value of the total shielding efectiveness in comparison with the composites, containing another activated carbons. It has the lowest values of speciic surface area, area and volume of micropores and the highest values of external surface area, volume of mesopores and average pore diameter. With gradually increasing the values of the indices in the irst group and gradually decreasing the values of the indices in the second group, the value of total shielding efectiveness decreases. It is obvious that these indices have inluence on the rubber matrix-iller particle interactions, such as multicontact chain adsorption to the surface of the iller. The spatial inhomogeneities formed give rise to polarization phenomena and to a frequency dependence of the dielectric properties.
Keywords: activated carbon, rubber composites, functional illers, dielectric and microwave
properties
* e-mail: [email protected]
1. Introduction
The production of materials possessing microwave absorbing properties has acquired signiicant importance recently. The most important applications of microwave absorbing composites are as follows: antenna techniques and production - improving the antenna parameters; protection of humans and other biological objects from the harmful efect of the electromagnetic waves; military application - for anti-radar camoulage, to reduce the radar cross section of objects; improving the electromagnetic compatibility between diferent electronic devices, reducing undesirable relections from objects and devices; to cover the inside surface of test rooms (anechoic chambers) in order to achieve “free space” conditions for measurements of components and systems1,2.
There has been a long history for research into carbonaceous-based microwave absorbers3-7.
Carbon (C) is the fourth most abundant chemical element in the universe by mass after hydrogen, helium, and oxygen. The inherent charge transport characteristics and the factors that limit the charge carrier mobility difer signiicantly between the various carbonaceous nanostructures relecting, on the one hand, the electronic dimensionality of the structures, and, on the other hand, the achievable dimensions of the respective π-systems8.
Carbon black and graphite remained the favorite absorbing candidates until the discovery of CNTs in the 1990s, which have been exploited to a wide range of potential industrial applications, including microwave absorbers9-16. Since the
beginning of this millennium, other forms of carbonaceous-based absorbers with good absorption characteristics have
aResearch Center for Advanced Materials Science (RCAMS), King Khalid University, Abha 61413, P.O.
Box 9004, Saudi Arabia
bDepartment of Chemistry, College of Science, King Khalid University, Abha 61413, P.O. Box 9004,
Saudi Arabia
cDepartment of Physics, Faculty of Science, King Abdulaziz University, Jeddah, Saudi Arabia
dDepartment of Polymer Engineering, University of Chemical Technology and Metallurgy,
1756 Soia, Bulgaria
eDepartment of Technology of Organic Synthesis and Fuels, University of Chemical Technology and
Metallurgy, 1756 Soia, Bulgaria
fDepartment of Telecommunications, Faculty of Telecommunications and Management, University of
Telecommunications and Post, 1700 Soia, Bulgaria
gDepartment of Communication and Computer Engineering, Faculty of Engineering, South-West
appeared. Most recently, graphene joined the carbonaceous family for microwave absorbers applications17-19 .
The active carbons are deined as carbonaceous materials, possessing well developed porous texture (more often a micro- mesoporous or a meso- microporous), containing about 87 - 97% carbon. They are classiied into the group of the so called mixed (transitional) forms of carbon, in which the atoms can participate in various combinations, corresponding to sp3-, sp2- and sp types of hybridization of
the electron orbitals. The availability of strongly developed (>100 m2/g) external surface, which usually contains considerable amount of surface oxygen-containing groups (SOG), determining the value of isoelectric points (IEP) is a prerequisite for the interaction between the macromolecules of the elastomer and the surface of the active carbon. It is well known that the interaction “elastomer-iller”, determined most of all by adsorption phenomena, lie at the basis of the process of formation of the properties of elastomeric composites. On the other hand, it can be supposed that the speciic structure of the active carbon will exert positive inluence upon the dielectric losses. It will result in achieving a higher degree of absorbance and lower degree of relection of the electromagnetic waves. The data published on the utilization of active carbons as reinforcing illers are quite a few20, while such data on their use as functional illers in elastomeric composites, absorbing the electromagnetic waves, are practically missing.
In this study, the complex dielectric constant (the real part of permittivity and dielectric loss tangent) and microwave properties (such as: relection coeicient, attenuation coeicient, and shielding efectiveness) of rubber composites, containing activated carbons difering in their textural characteristics, were investigated within the frequency range from 1 GHz to 12 GHz with the aim to establish:
- the values of the textural parameters and the IEPs of the active carbons, within such range of limits, where they could be applied as illers, without creating any technological problems during the vulcanization process;
- the inluence of textural parameters of the activated carbon on the complex dielectric constant (the real part of permittivity and dielectric loss angle tangent) and microwave properties (such as: attenuation and relection coeicients, the total, relective and absorptive shielding efectiveness) of composites on the basis of natural rubber in the frequency range from 1 GHz to 12 GHz.
2. Experimental
2.1. Activated carbons
Six types of active carbon have been used, difering in their adsorption-textural parameters. These types of active
carbon are the following: Norit, AG-K, ART, AC-L, 207C and ACVM. AG-K and AC-L are based on anthracite or respectively on lignite brown coal, the Norit and ART types are on the basis of wooden material, while the 207C and ACVM samples have been prepared from diferent nuts or fruit stones, respectively from cocoa nuts apricot stones.
The carbon samples ACVM and AC-L have been prepared by us using steam-gas activation and the rest of the samples are commercial products.
2.2. Activated carbons characterization
The activated carbons have been characterized by means of low-temperature nitrogen adsorption (at 77.4 К) using Quantachrome Instruments NOVA 1200e (USA) apparatus.
On the basis of the adsorption-desorption equilibrium nitrogen isotherms, applying the specialized software, belonging to the apparatus, the following textural parameters have been calculated:
- speciic surface area (ABET) after the equation of Brunauer-Emmet-Teller, for the pressure range P/ PO = 0.05 - 0.35 (adsorbate N2, at 77.4 K); - volume of the micropores (VMI) using the Density
Functional Theory (DFT) (adsorbate N2, at 77.4 K); - total pore volume (Vt) in accordance with the Rule
of Gurvich for the pressure range P/PO = 0.95 (adsorbate N2, at 77.4 K);
- volume of the mesopores (VMЕS), estimated as the diference between the total pore volume and the volume of micropores (adsorbate N2, at 77.4 K); - size distribution of the micropores based on the
equation of Dubinin-Astakhov 21;
- size distribution of the mesopores within the interval 1.7 - 15 nm on the basis of the adsorption branch of the adsorption-desorption equilibrium isotherm, using the Density Functional Theory;
- average pore diameter (DAV) as the ratio between Vt multiplied by four and the speciic surface area ABET (adsorbate N2, at 77.4 K);
- the external surface area (AEXT) based on the αS
method 22, from the adsorption branch of the isotherm (adsorbate N2, at 77.4 K).
isoelectric point was determined as the value, at which the change in рН becomes zero.
2.3. Sample preparation and vulcanization
A rubber compound, taken as a reference, and six samples of diferent activated carbon powder of one and the same quantity were charged in an open two-roll laboratory mill (L/D 320x160 and friction 1.27). The speed of the slow roll was 25 min-1. The formulations of the prepared samples areshown in Table 1. The inclusion of sulfur (vulcanization agent), zinc oxide (activator), stearic acid (dispersing agent and accelerating activator) and TBBS (N-tert-Butyl-2-benzothiazolesulfonamide-accelerator) was done with the aim to accomplish a normal vulcanization process24. The
process of mixing was carried out as follows: loading some raw rubber, afterwards the zinc oxide was added on the 5th minute as well as the stearic acid, then after 3 minutes of homogenization treatment the activated carbon powders were added, and after 7 minutes of homogenization the accelerator and the sulfur were added. Finally the mixture was again homogenized for 4 minutes. The temperature of the rolls did not exceed 70OC. The experiments were repeated to
check statistically the reproducibility. Samples in the form of sheets stayed for 24 hours prior to their vulcanization. The optimal vulcanization time interval was determined by the vulcanization isotherms taken on an oscillating disc vulcameter MDR 2000 (Alpha Technologies) at 150OC
according to ISO 3417:2002 standard.
The rheometer was carried out in a hydraulic electric press, with the size of the plate 400x400 mm at a pressure of 10 MPa. The obtained samples had dimensions 200х200х1.5 mm.
2.4. Microwave properties measurement
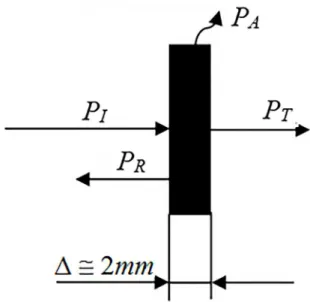
Figure 1 indicates the mechanism of interaction of one composite with the electromagnetic wave, possessing incident power PI. A fraction of the power of the wave is relected by
the surface of the material PR. Another fraction passes into
the material and it is absorbed by it, being transformed into a quantity of heat PA, and the remaining part of the power is
disseminated after the sample PT.
The shielding efectiveness is deined as the ratio between the power incident on the sample PI and the power passing
through the sample PT in accordance with the equation (1)25-27:
Table 1. Formulation of the studied NR based compounds (in parts per 100 parts of rubber).
NR1 NR2 NR3 NR4 NR5 NR6 NR7
Natural rubber SMR 10 100 100 100 100 100 100 100
Zinc oxide 5 5 5 5 5 5 5
Stearic acid 2 2 2 2 2 2 2
Activated carbon powder 0 Norit AG-K ART ACL 207C ACVM
TBBS 0.8 0.8 0.8 0.8 0.8 0.8 0.8
Sulfur 2.25 2.25 2.25 2.25 2.25 2.25 2.25
Note: The amounts of activated carbons in samples NR2-NR7 are 70 phr.
Figure 1. Mechanism of interaction of the composite with the incident power of the electromagnetic wave.
( ) log
SE 10 PP 1
T I
=
The total shielding efectiveness (SE, in dB) and the relective shielding efectiveness of the sample surface (SER, in dB) are determined by the equations (2) and (3)
28-31:
, ( )
lg
SE= -10 T 2
where T = /PT/PI/ = / S21/2,
( ), ( )
SER= -10lg 1-R 3
where R = /PR/PI/ = / S11/2,
S11 and S21 are complex scattering parameters or S-parameters (S11 corresponds to the relection coeicient
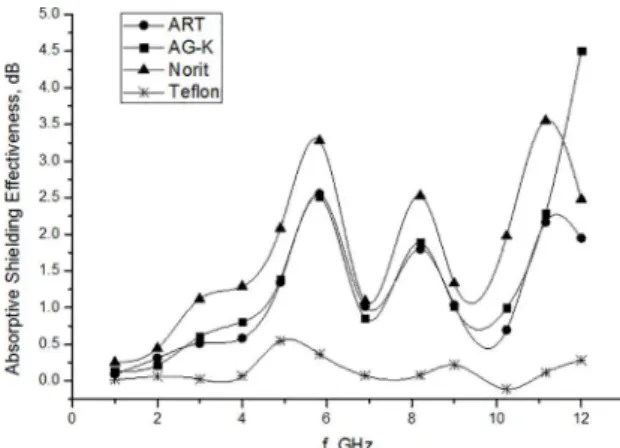
The absorptive shielding efectiveness (SEA) is calculated
as the diference between (2) and (3), as it is shown in equation (4)26, 28-31:
. ( )
SEA=SE-SER 4
The attenuation coeicient (α, dB/cm) was determined using Equation (4). Substituting SE and SER in it with Equations (2) and (3), Equation (5) is obtained.
| | ( )
lg SE
P
P S
10 1 5
A
r
I 11 2
= T
Q
-V
YFor determining the attenuation coeicient, Equation (5) was divided by the thickness of the sample d in centimeters, as shown in Equation (6).
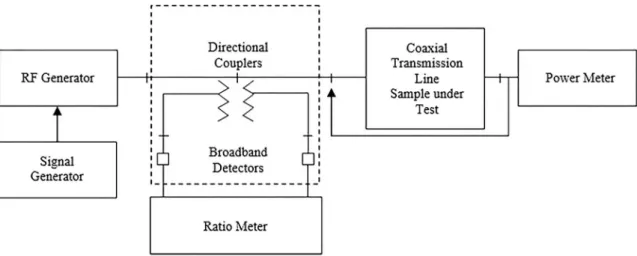
For the evaluation of the shielding efectiveness and measuring the coeicient of relection from the surface of the studied composites the apparatus, represented in Figure 2, has been applied. It consists of coaxial relectometric system (directed deviators Narda model 4222-16 and detectors Narda FSCM 998999 model 4503A, separating the incident power from the relected power in the line), Ratio Meter) HP Model 416A, calculating and depicting the amplitude of the coeicient of relection from the sample, a series of radio wave frequency generators G4-37A,G4-79 to G4-82 and HP 68A in the frequency interval from 1 GHz to 12 GHz, the signal generator BM492 releasing a modulating signal of frequency 1 kHz directed towards the radio frequency generator, coaxial transmission line Orion type E2M for frequencies from 1 GHz to 5 GHz and coaxial measuring line APC-7mm for frequencies from 6GHz to 12 GHz, power measuring device HP 432A. The critical frequencies for the
| | ( )
lg d
SE
P S
P
10 1 6
A
I T
11 2
a= =
T
Q
-V
Y
Figure 2. Apparatus for measuring the microwave properties.
coaxial measuring lines were determined by the formulas represented in32-33.
The radio frequency generator and the relection-measuring system (relectometer) are interconnected by means of rugged phase stable cable N9910X-810 Agilent and through the connectors to avoid any interference.
The measurements have been carried out observing the following procedure:
а) calibration of the system for removal of the systematic errors using the above mentioned kits of calibrating tools and the standard procedures, described in 34-35.
b) Cutting out samples from the obtained vulcanized materials having dimensions as follows:
- external diameter of 20 mm and internal diameter of 7 mm in case of using coaxial transmission line Oreon E2M;
- external diameter of 7 mm and internal diameter of 3 mm з in case of using coaxial measuring line APC-7mm.
c) Carrying out measurements for determining the module of the coeicient of relection using:
- standard load of the type Agilent 1250, connected in the position of the coaxial line;
- blank coaxial line with a standard load at the end (calibrating kit of tools of the type Agilent N9330); - coaxial line with with inserted standard material
(polytetraluoroethylene PTFE load of thickness 1 mm) for confirming the correctness of the measurements done;
d) the studied sample is placed between the external and the internal conductor of the coaxial line;
The measurements have been carried out at room temperature varying from 19ºC up to 24ºC and incident power PI at the inlet of the coaxial measuring line varying
2.5. Dielectric properties measurement
2.5.1. Complex permitivity
The determination of complex permitivity has been carried out by the resonance method, based on the cavity perturbation technique. The resonance frequency of an empty cavity resonator fr has also been measured. After
that the sample material was placed into the resonator and the shift in resonance frequency fε has been measured. The
real part of permittivityɛ’r was calculated from the shift in resonance frequency, cavity and the sample cross-sections
Sr and Sε respectively
In view of the fact that the applied active carbons have been used as reinforcing illers, it has to be noted that not all textural parameters are of importance, but mostly the speciic and the external surface areas and mainly the volume of the mesopores. This is due to the fact that the pore sizes that allow the penetration of the large elastomer macromolecules into the carbon particles are of signiicance. As far as the sizes of the micropores are concerned < 2.0 nm36 these are
not accessible to the molecules of the elstomer. The same holds true also for the speciic surface area of the micropores. Therefore, the parameters, associated with the micropores, will be considered only from the view point of comparison between the diferent samples of active carbons.
From the view point of the type of texture all the six studied samples of active carbons belong to the group of the micro-mesoporous materials.
The speciic surface areas of the commercial active carbons are varying within a comparatively wider range (Table 2) as for example that of the trademark Norit is more than twice smaller than those of AC-L and 207C. This diference is especially strongly demonstrated in regard to the value of the external surface area, whereupon this value in the case of AG-K compared to those of 207С and AC-L is smaller respectively 2.7 and 3.1 times.
Substantial diference is displayed by the studied active carbons in the case of the vulcanization of NR based samples. The vulcanization process is occurring and ending normally with the samples containing as illers the active carbons: Norit, ART and AG-K, which we shall call conditionally “the irst group”, but it does not end in the case of the carbon illers: AC-L, 207C and ACVM (“second group”).
The volumes of the micropores and mesopores are varying within comparatively narrower limits in the studied active carbons. Thus the greatest observed diference in the volumes of the micropores - that between Norit and 207C is about 1.8 times. Analogously, in regard to the volumes of the mesopores, the diference between ART and AG-K on one side and AC-L on the other side (Table 2) is also 1.8 times.
The analysis of the carbon samples of the irst group shows that the speciic surface areas (with the exception of the ART sample) are comparatively low (Table 2), by analogy The sample had the form of a disc with a diameter of
11 mm and about 1.5 mm thickness. It was placed in the position of the maximum electric ield of the cavity.
Dielectric loss angle tangent tan δ
The dielectric loss angle tangent tan δ was calculated from the quality factor of the cavity with Qε and without
a sample Qr
’r 1 2SSr . f f f ( )7
r r
f = +
-f f
( )
tan 41 SS Q1 Q1 8
r r
r
d f
=
-fT f Y
The measurement setup used several generators for the whole range: HP686A and G4-79 to 82, frequency meters: H 532A; FS-54, cavity resonator (Figure 3).
The dielectric properties have been measured within the frequency range from 1 GHZ to 10 GHz.
3. Results and Discussion
3.1. Textural parameters of activated carbons and
their inluence on the vulcanization process of
samples of materials
The textural parameters, calculated on their basis following the methods, described in the experimental section, are listed in Table 2.
with it in the second group (with the exception of the ACVM samples having ABET = 688 m2/g) the remaining two samples are characterized by speciic surface area >1100 m2/g.
Analogously, the external surfaces of the active carbons of the irst group are lower than those of the second group of active carbons (Table 2).
There exists a possibility to explain this diference based on the isoelectric points (IEP) of the active carbons (Table 2). It is obvious that the values of IEP for the carbons of the irst group are positioned at about 7, while these values for the carbons of the second group are either under the value of the neutral point 7 (5.3 in the case of 207С sample and 5.5 for the AC-L sample) or it is 9.7 in the case of the ACVM sample. Therefore the availability of supericial oxygen-containing functional groups (SOG), whatever their nature is (acidic or basic) is restricting the utilization of active carbons as illers in view of the negative inluence of some of them with respect to the vulcanization process. We can recommend as appropriate illers only those having IEP ≈ 7.
Another important parameter, connected with the ability of the carbons to be acceptable in the function of reinforcing illers, is the ratio between the volume of the mesopores and the external surface area. A logical prerequisite for it appears to be the fact that the external surface is easily accessible to the large molecules of the elastomer, while the internal surface of the mesopores (only that of the bigger ones) is not readily accessible to them.
It has been found out that the activated carbons exert serious inluence upon the vulcanization process, which depends both on the chemistry of the surface of carbons (respectively on the IEPs), as well as on their textural parameters (most of all on the ratio VMES/AEXT). In order to accomplish a normal vulcanization process without any technological problems it is necessary that the ratio VMES/ AEXT should be within the limits (8.5-12.0)10-4 and at the same time the IEP should be close to 7. It may be concluded that only the activated carbons ART, AG-K and Norit are suitable for application as reinforcing illers. This is why we used them in our further investigations.
3.2. Microwave properties
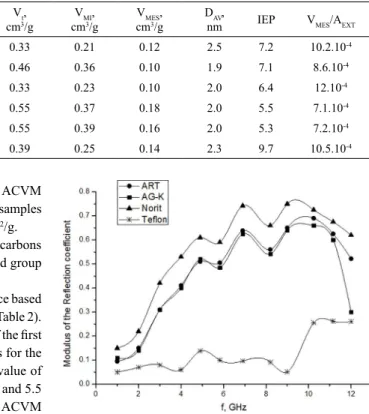
Figure 4 represents frequency dependence of relection coeicients |Г| of composites containing ART, AG-K and
Table 2. The main textural parameters of activated carbons used and their IEP values. Samples ABET,
m2/g
AMI, m2/g
AEXT, m2/g
Vt, cm3/g
VMI,
cm3/g
VMES,
cm3/g
DAV,
nm IEP VMES/AEXT
Norit 518 400 118 0.33 0.21 0.12 2.5 7.2 10.2.10-4
ART 957 840 117 0.46 0.36 0.10 1.9 7.1 8.6.10-4
AG-K 652 569 83 0.33 0.23 0.10 2.0 6.4 12.10-4
AC-L 1107 852 255 0.55 0.37 0.18 2.0 5.5 7.1.10-4
207C 1111 890 222 0.55 0.39 0.16 2.0 5.3 7.2.10-4
ACVM 688 555 133 0.39 0.25 0.14 2.3 9.7 10.5.10-4
Figure 4. Frequency dependence of relection coeicients |Г| of composites containing ART, AG-K and Norit illers.
Norit illers. It is seen that at the frequency range from 1 GHz to 5 GHz the coeicient of relection is growing up monotonously for all the materials, while for the range from 5 GHz to 9 GHz a resonance character is observed. The three studied materials manifest high values of the coeicient of relection within the frequency range from 5 GHz to 11 GHz. At frequencies higher than 10 GHz a monotonous decrease in the coeicient of relection is observed, which is more strongly expressed in the case of the material AG-K. For conirming the correctness of the measurements done for each frequency a standard Telon probe (PTFE load of thickness 1 mm) has been measured.
The coeicients of attenuation of composites containing ART, AG-K and Norit illers depending on frequency are shown in Figure 5.
3.3. Total shielding efectiveness
Figure 6 represents the frequency dependence of total shielding efectiveness, SE, dB of composites containing
ART, AG-K and Norit illers. It is seen that the sample Norit has larger values of the total shielding efectiveness (SE)
with about 2 dB by comparison with another two samples. Within the frequency range from 1 GHz to 11 GHz the total shielding efectiveness for all three materials (ART, AG-K and Norit) has identical behavior, whereas for frequencies up to 6 GHz it is increasing with the frequency. Further within the range from 7 GHz to 10 GHz low sensitivity is observed with respect to changes in the frequency.
the values of SER are very close to each other within the
entire frequency range.
On Figure 8 it is seen that within the range from 1 GHz up to 11 GHz the Norit sample displays the greatest absorption. At frequencies higher than 11 GHz the AG-K material possesses higher values of SEA, showing a diferent
behavior in regard to the other two materials and determining the behavior of the total shielding efectiveness.
For all studied materials the relective and absorptive shielding efectiveness manifest resonance behavior at frequencies from 6 GHz to 12 GHz, whereupon at frequency 6 GHz the SEA is prevailing, while within the range from 7 GHz to 11 GHz, the relecting component (SER) is prevailing in the total shielding efectiveness.
The study of the electromagnetic properties of an ensemble of iller particles embedded in a polymer matrix requires the determination of not only the intrinsic electromagnetic properties of the individual iller particles but also the type and strength of interparticle interactions, e.g., long-range dipoledipole interactions, clustering, and matrix-particle interactions, such as multicontact chain adsorption to the surface of the iller. It has been well established that spatial
Figure 5. Frequency dependence of attenuation coeicient α, dB/ cm of composites containing ART, AG-K and Norit illers.
Figure 6. Frequency dependence of total shielding efectiveness, SE, dB of composites containing ART, AG-K and Norit illers.
Figures 7-8 illustrates the results on the relective shielding efectiveness (SER) and absorptive shielding
efectiveness (SEA).
From the plots in Figure 8 one can determine that the highest relective shielding efectiveness comes as a consequence of the relection from the surface of the sample - the tested sample is Norit. For the other two tested samples
Figure 7. Frequency dependence of relective shielding efectiveness, SER, dB of composites containing ART, AG-K and Norit illers.
inhomogeneities, i.e., clusters of iller particles, give rise to polarization phenomena and therefore to a frequency dependence of the efective permittivity37
Homogeneous and heterogeneous media analyzed within an efective medium approach are described by two material parameters: the complex (relative) permittivity e ɛ=ɛ’ - jɛ’’ and the magnetic permeability (relative) µ=µ’-jµ’’. The terms ɛ’ (and µ’) are associated with energy storage and ɛ’’ (and µ’’) are associated with dielectric loss or energy dissipation within a material resulting from conduction, resonance, and relaxation mechanisms. The loss tangent of the dielectric material is tan δ = ɛ”/ɛ’, where δ is the dielectric loss angle of the material. Energy loss in a material illuminated by electromagnetic waves comes about through damping forces acting on polarized atoms and molecules and through the inite conductivity of a material.
Through equations available in the literature8, we can see that the combination of the magnetic permeability and the permittivity of the absorbing composite satisfying the impedance matching condition is the key to producing a high-performance microwave absorber. Speciically, for a single layer of absorber backed by a PEC [perfect electric conductor] the relection loss and the attenuation constant are dependent on complex magnetic permeability, permittivity, and frequency. If we consider diamagnetic carbonaceous materials, microwave absorbers is due to dielectric losses.
In the case of a dielectric absorbent, assuming that µ=1 - j0, the maximum relection loss and the attenuation coeicient depend on real and imaginary part of permittivity, dielectric loss angle tangents at a given frequency8. This is why to explain the efect observed we investigated the dielectric properties of the composites studied.
Figures 9 and 10 illustrate the dielectric parameters of the tested materials within a wide frequency band from 1 GHz to 10 GHz. For all materials one can observe increase in the real part of the relative dielectric permittivity (εr) upon
increasing the frequency up to 3 GHz (Fig. 9), while for the frequency range from 5 GHz to 10 GHz one can observe weak inluence of the frequency. Within the studied range the material ART possesses higher values of εr in comparison
to the other materials.
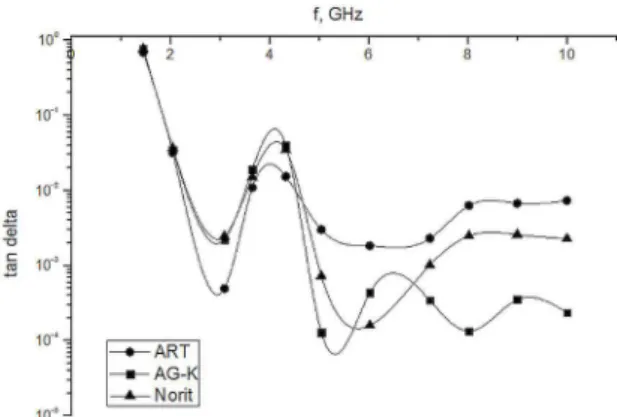
Figure 10 depicts in a logarithmic scale the results from the measurements of tanδε . It is seen that this parameter is
much more sensitive to changes in the frequency, and also to the quantity of the illers in the tested samples themselves. Within the frequency range from 1 GHz to 5 GHz all three materials have relatively high values of tanδε, and it is
probably for this reason that the values of the shielding efectiveness are smaller in this range. Within the frequency range from 5 GHz to 10 GHz the ART material displays higher values of tanδε.
The results of these measurements explain the observed microwave properties of the composites. It is obvious that the dielectric permittivity and the dielectric loss of the composite
Figure 9. Frequency dependence of the real part of the dielectric permittivity for the studied materials.
Figure 10. Frequency dependence of the dielectric losses tanδε for
the studied materials.
permittivity 37. It may be considered as a prove for the efect of activated carbons textural characteristics on the dielectric and microwave properties of containing them composites.
4. Conclusions
Six types of activated carbon diferent in their adsorption-textural parameters have been studied as functional illers of composite materials based on natural rubber. These types of active carbon are Norit, AG-K, ART, AC-L, 207C and ACVM.
It has been found out that the activated carbons exert serious inluence upon the vulcanization process, which depends both on the chemistry of the surface of carbons (respectively on the IEPs), as well as on their textural parameters (most of all on the ratio VMES/AEXT). In order to accomplish a normal vulcanization process without any technological problems it is necessary that the ratio VMES/ AEXT should be within the limits (8.5-12.0)10-4 and at the same time the IEP should be close to 7.
It has been observed that the composite containing activated carbon Norit possesses the highest value of the total shielding efectiveness in comparison with the composites, containing the carbons AG-K and ART. It has the lowest values of speciic surface area, area and volume of micropores and the highest values of external surface area, volume of mesopores and average pore diameter. With gradually increasing the values of the indices in the irst group and gradually decreasing the values of the indices in the second group, the value of total shielding efectiveness in the row Norit, AG-K and ART decreases. It is obvious that these indices have inluence on the rubber matrix-iller particle interactions, such as multicontact chain adsorption to the surface of the iller. It is obvious also that the textural characteristics of the studied active carbons exert inluence both on the dielectric, as well as on the microwave properties of the studied composites.
Some of the studied active carbons (Norit, ART and AG-K), answering the requirement for appropriate values of the IEPs and of the textural parameters can be used as illers in elastomeric composites designed for microwave application.
5. Acknowledgements
The authors would like to acknowledge the support of King Khalid University for this research through a grant RCAMS/KKU/003-16 under the Research Center for Advanced Materials Science at King Khalid University, Saudi Arabia and the University of Chemical Technology and Metallurgy, Soia, Bulgaria.
6. References
1. Al-Hartomy OA, Al-Ghamdi AA, Al-Salamy F, Dishovsky N, Shtarkova R, Slavcheva D, et al. Efect of Matrix Chemical Nature on the Properties of Composites for Microwave
Absorbers. Polymer-Plastics Technology and Engineering. 2013;52(11):1113-1121.
2. Al-Hartomy OA, Al-Ghamdi AA, Al-Salamy F, Dishovsky N, Slavcheva D. Iliev V, et al. Dielectric and Microwave Properties of Fullerenes Containing Natural Rubber-based Nanocomposites. Fullerenes, Nanotubes, and Carbon Nanostructures. 2014;22(4):332-345.
3. Lederer PG. An Introduction to Radar Absorbent Materials (RAM). Malvern: Royal Signals and Radar Establishment; 1986.
4. Gaylor K. Radar Absorbing Materials-Mechanisms and Materials. Maribyrnong: DSTO Materials Research Laboratory; 1989. 5. Knott EF, Shaefer JF, Tuley MT. Radar Cross Section. 2nd rev.
ed. Raleigh: SciTech Publishing; 2004.
6. Vinoy KJ, Jha RM. Radar Absorbing Materials-From Theory to Design and Characterization. Boston: Kluwer Academic Publishers; 1996.
7. Emerson W. Electromagnetic wave absorbers and anechoic chambers through the years. IEEE Transactions on Antennas and Propagation. 1973;21(4):484-490.
8. Qin F, Brosseau C. A review and analysis of microwave absorption in polymer composites illed with carbonaceous particles. Journal of Applied Physics. 2012;111(6):061301. 9. Dishovsky N. Rubber based composites with active behavior to
microwaves. Journal of the University of Chemical Technology and Metallurgy. 2009;44(2):115-122.
10. Shtarkova R, Dishovsky N. Elastomer-based Microwave Absorbing Materials. Journal of Elastomer & Plastics. 2009;41(2):163-174. 11. Dishovsky N, Grigorova M. On the correlation between electromagnetic waves absorption and electrical conductivity of carbon black illed polyethylenes. Materials Research Bulletin. 2000;35(3):403-409.
12. El-Tantawy F, Dishovsky N. Novel V-shaped negative temperature coeicient of conductivity thermistors and electromagnetic interference shielding efectiveness from butyl rubber-loaded boron carbide ceramic composites. Journal of Applied Polymer Science. 2004;91(5):2756-2770.
13. Attharangsan S, Ismail H, Bakar MA, Ismail J. Carbon Black (CB)/Rice Husk Powder (RHP) Hybrid Filler-Filled Natural Rubber Composites: Efect of CB/RHP Ratio on Property of the Composites. Polymer-Plastics Technology and Engineering. 2012;51(7):655-662.
14. Ling Q, Sun J, Zhao Q, Zhou Q. Efects of Carbon Black Content on Microwave Absorbing and Mechanical Properties of Linear Low Density Polyethylene/Ethylene-Octene Copolymer/ Calcium Carbonate Composites. Polymer-Plastics Technology and Engineering. 2011;50(1):89-94.
15. Das TK, Prusty S. Review on Conducting Polymers and Their Applications. Polymer-Plastics Technology and Engineering. 2012;51(14):1487-1500.
17. Bai X, Zhai YH, Zhang Y. Green Approach To Prepare Graphene-Based Composites with High Microwave Absorption Capacity. Journal of Physical Chemistry C. 2011;115(23):11673-11677.
18. Fang JJ, Li SF, Zha WK, Cong HY, Chen JF, Chen ZZ. Microwave Absorbing Properties of Nickel-coated Graphene. Journal of Inorganic Materials. 2011;26(5):467-471.
19. Zhang HB, Yan Q, Zheng WG, He ZX, Yu ZZ. Tough Graphene−Polymer Microcellular Foams for Electromagnetic Interference Shielding. ACS Applied Materials & Interfaces. 2011;3(3):918-924.
20. Kienle H, Bäder E. Activkohle und ihre industrielle Anwendung. Stuttgart: Ferdinand EnkeVerlag; 1980.
21. Dubinin MM, Astakhov VA. Description of Adsorption Equilibria of Vapors on Zeolites over Wide Ranges of Temperature and Pressure. In: Flanigen EM, Sand LB, eds. Molecular Sieve Zeolites II. Washington: American Chemical Society; 1971. p. 69-85.
22. Sing KSW. In: Everett DH, Ottewill RH, eds. Surface area determination: proceedings of the International Symposium on Surface Area Determination; 1969 Jul 16-18; Bristol, U.K. London: Butterworths; 1970. p. 15.
23. Noh JS, Schwarz JA. Efect of HNO3 treatment on the surface acidity of activated carbons. Carbon. 1990;28(5):675-682. 24. Mark JE, Erman B, Eirich FR, eds. The Science and Technology
of Rubber. 3rd ed. Amsterdam: Elsevier; 2005.
25. Jana PB, Mallick AK, De SK. Efects of sample thickness and iber aspect ratio on EMI shielding efectiveness of carbon iber illed polychloroprene composites in the x-band frequency range. IEEE Transactions on Electromagnetic Compatibility. 1992;34(4):478-481.
26. Paul CR. Introduction to Electromagnetic Compatibility. 2nd ed. Hoboken: Wiley; 2006.
27. Ott HW. Electromagnetic Compatibility Engineering. Hoboken; Wiley; 2009.
28. Villacorta Hernandez B. Efect of Graphitic Carbon Nanomodiiers on the Electromagnetic Shielding Efectiveness of Linear Low Density Polyethylene Nanocomposites. [Dissertation]. Clemson: The Graduate School of Clemson University; 2013.
29. Sadasivuni KK, Ponnamma D, Kim J, Thomas S, eds. Graphene-Based Polymer Nanocomposites in Electronics. Cham: Springer International Publishing; 2015.
30. Park SH, Theilmann PT, Asbeck PM, Bandaru PR. Enhanced Electromagnetic Interference Shielding Through the Use of Functionalized Carbon-Nanotube-Reactive Polymer Composites. IEEE Transactions on Nanotechnology. 2010;9(4):464-469.
31. Hong YK, Lee CY, Jeong CK, Lee DE, Kim K, Joo J. Method and apparatus to measure electromagnetic interference shielding eiciency and its shielding characteristics in broadband frequency ranges. Review of Scientiic Instruments. 2003;74(2):1098.
32. Więckowski TW, Janukiewicz JM. Methods for Evaluating the Shielding Efectiveness of Textiles. Fiber & Textiles in Eastern Europe. 2006;59(5):18-22.
33. Chen LF, Ong CK, Neo CP, Varadan VV, Varadan VK. Microwave Electronics Measurement and Material Characterization. Chichester: Wiley; 2004.
34. High-Directivity Coaxial Directional Couplers and Relectometers. Hewlett Packard Journal. 1955;7(2).
35. A New Frequency Counter Plug-In Unit for Direct Frequency Measurments to 510 MC. Hewlett Packard Journal. 1961;12(5). 36. Recommendations for the characterization of porous solids IUPAC. Pure and Applied Chemistry. 1994;66(8):1739-1758. 37. Brosseau C. Mesostructure and network properties of illed