www.clim-past.net/7/277/2011/ doi:10.5194/cp-7-277-2011
© Author(s) 2011. CC Attribution 3.0 License.
of the Past
A regional ocean circulation model for the mid-Cretaceous North
Atlantic Basin: implications for black shale formation
R. P. M. Topper1, J. Trabucho Alexandre1, E. Tuenter1,2, and P. Th. Meijer1
1Department of Earth Sciences, Faculty of Geosciences, Utrecht University, Utrecht, The Netherlands 2Institute for Marine and Atmospheric Research Utrecht, Utrecht University, Utrecht, The Netherlands
Received: 12 October 2010 – Published in Clim. Past Discuss.: 29 October 2010 Revised: 14 February 2011 – Accepted: 15 February 2011 – Published: 21 March 2011
Abstract. High concentrations of organic matter accumu-lated in marine sediments during Oceanic Anoxic Events (OAEs) in the Cretaceous. Model studies examining these events invariably make use of global ocean circulation mod-els. In this study, a regional model for the North Atlantic Basin during OAE2 at the Cenomanian-Turonian boundary has been developed. A first order check of the results has been performed by comparison with the results of a recent global Cenomanian CCSM3 run, from which boundary and initial conditions were obtained. The regional model is able to maintain tracer patterns and to produce velocity patterns similar to the global model. The sensitivity of the basin tracer and circulation patterns to changes in the geometry of the connections with the global ocean is examined with three experiments with different bathymetries near the sponges. Different geometries turn out to have little effect on tracer distribution, but do affect circulation and upwelling patterns. The regional model is also used to test the hypothesis that ocean circulation may have been behind the deposition of black shales during OAEs. Three scenarios are tested which are thought to represent pre-OAE, OAE and post-OAE situa-tions. Model results confirm that Pacific intermediate inflow together with coastal upwelling could have enhanced primary production during OAE2. A low sea level in the pre-OAE scenario could have inhibited large scale black shale forma-tion, as could have the opening of the Equatorial Atlantic Seaway in the post-OAE scenario.
Correspondence to: R. P. M. Topper
1 Introduction
In Mesozoic sequences all around the world, evidence of pro-longed periods of enhanced organic carbon burial has been found related to so-called Oceanic Anoxic Events (OAEs). All previous modelling studies regarding the triggering mechanism for enhanced organic carbon burial and the as-sociated ideas about (changes in) ocean circulation during Oceanic Anoxic Event 2 (OAE2), the subject of this study, have used global coupled ocean and atmosphere circulation models (e.g. Poulsen et al., 2001; Trabucho Alexandre et al., 2010). Horizontal resolution in these models is at best 2– 3◦ in both latitudinal and longitudinal directions. Close to the equator, this results in grid cells of∼200×200 km; for the North Atlantic Basin this comes down to a maximum of 400 grid cells in the horizontal plane. A more detailed ap-proximation of palaeogeography can be made with a regional ocean-only model; the grid size can be reduced while at the same time the model runs much faster than the global equiv-alent because the total amount of grid points in the model has been reduced. The advantage of such a regional ocean-only model is that it allows for more sensitivity experiments and a higher resolution than a global ocean model, let alone a global climate model.
those parts of the system left out: conditions at the open ends of the basin and at the water surface. In this study, these boundary conditions are derived from an existing Cenoma-nian CCSM3 run (Community Climate System Model ver-sion 3, Collins et al., 2006; Trabucho Alexandre et al., 2010; Sewall et al., 2007). Also initial fields for the regional model are derived from this CCSM3 run. The first question to be addressed is then whether the regional ocean model is able to maintain/reproduce the outcomes of the Cenomanian CCSM3 run. Although forced by global model results, re-gional model results can be different because of differences in resolution, palaeogeography and handling of boundary conditions..
If the regional model proves to be able to reproduce the main features of the CCSM3 results, the model can be used to examine some of the factors influencing circulation and upwelling patterns. Because upwelling zones are the zones where generally most organic matter is produced, the posi-tion of the modelled upwelling zones can be compared with the high organic matter contents found in southern North At-lantic sequences formed during the CTBI. Also, the cause of upwelling observed in the basin can be examined: is it wind driven or does it have another cause?
In reconstructions of the Cenomanian Atlantic bathymetry (e.g. Ross and Scotese, 1988; Sewall et al., 2007; Meschede and Frisch, 1998) there is some uncertainty about the pres-ence and geometry of the connections between the global ocean and the Atlantic. We will perform sensitivity exper-iments to assess the effect of Pacific gateway geometry, the largest unknown factor in the bathymetry.
In addition, the model will be used subsequently to exam-ine hypotheses about OAE2. In order to test the hypothesis that ocean circulation may be behind the initiation and wane of black shale deposition during OAE2 (Trabucho Alexan-dre et al., 2010), the regional model will be used to examine changes in the North Atlantic circulation for three different sets of boundary conditions, which are interpreted as rep-resenting scenarios for pre-OAE, OAE and post-OAE time envelopes. We will discuss (changes in) the circulation and upwelling patterns and the (anticipated) nutrient supply for all three scenarios to predict whether and where the condi-tions in the North Atlantic were favourable for black shale formation during each of these time envelopes.
Oceanic Anoxic Events
Oceanic Anoxic Events (Schlanger and Jenkyns, 1976) oc-curred at discrete intervals in the Mesozoic and have been extensively studied because of large scale source rock for-mation during these events. The best known of these events occurred in the mid-Cretaceous; OAE1a occurred in the early Aptian (∼120 Ma) and, the focus of this research, OAE2 in the CTBI (∼93.6 Ma). During an OAE, unusually high amounts of organic matter accumulate in marine sediments (Jenkyns, 1980), generally called black shales because of
their dark colour and thus regardless of lithology. OAE2 is defined by a global positive carbon isotope excursion, aδ13C increase of>2‰, for which conservative and maximum es-timates of the duration are 563–603 and 847–885 kyr respec-tively, as found at Pueblo, Colorado (Sageman et al., 2006).
The North Atlantic is the logical location in which to study OAE2 because the event was best developed in this basin. Around the CTBI the North Atlantic Basin was a land-locked basin with limited deep water connections to the global ocean (Fig. 1a). A deep water connection to the Pacific through the Central American Seaway (CAS) and shallow/intermediate water connections to the Tethys, through the Palaeo-Strait of Gibraltar (PSoG), and polar seas precluded complete isola-tion of the North Atlantic. This situaisola-tion changed in the Late Cretaceous with the opening of the Equatorial Atlantic Sea-way which forms the connection to the South Atlantic Ocean (Friedrich and Erbacher, 2006; Jones et al., 1995; Handoh et al., 1999; Pletsch et al., 2001; Poulsen et al., 2003).
0 10 20 30 40 50
−70 −60 −50 −40 −30 −20 −10 0 10
−70 −60 −50 −40 −30 −20 −10 0 10
10 20 40 60 100 140 180 220 260 300 380 460 540 700 1000 1500 2000 2500 3000 3500 4000 4500 5000
North America
South America
Africa Europe
Tethys
Pacific
0 10 20 30 40 50
−70 −60 −50 −40 −30 −20 −10 0 10
−70 −60 −50 −40 −30 −20 −10 0 10
15 20 25 30
0 10 20 30 40 50
−70 −60 −50 −40 −30 −20 −10 0 10
0 10 20 30 40 50
−70 −60 −50 −40 −30 −20 −10 0 10 −8
−6 −4 −2 0 2 4
0 10 20 30 40 50
−70 −60 −50 −40 −30 −20 −10 0 10
0
Depth [m]
Air temperature [
o
C]
E-P
[mm day
-1
]
oE oN
oE
oE oE
oN oN
oN
a b
c d
0.35 Pa South Atlanic
PSoG
EAS CAS
WIS
0 0.25
W
indstresss [Pa]
Fig. 1. Boundary conditions. (a) The bathymetry with 2 sponges attached; a Pacific sponge is connected at the Central American Seaway
and a Tethys sponge at the Palaeo-Strait of Gibraltar. Not shown here is a third South Atlantic sponge which can be attached to the Equatorial Atlantic Seaway. (b) Air temperature at 2 m above the sea surface, (c) evaporation minus precipitation, and (d) windstress in the North Atlantic area are all 4-year averages from the atmospheric model of the Cenomanian CCSM3 run.
rate. Enhanced primary production up to three times the pre-OAE production was found in the southern part of the basin (Kuypers et al., 2002), which has been proposed to be caused by enhanced upwelling (Parrish and Curtis, 1982). A high organic matter flux to the sea floor, where it consumes the available oxygen for organic matter oxidation, is there-fore proposed as the mechanism for the increased organic carbon burial rate (e.g. Kuypers et al., 2002, 2004a; Trabu-cho Alexandre et al., 2010; Barron and Washington, 1985; Piper and Calvert, 2009). Comparison of accumulation rates found at the north and south margins of the basin clearly in-dicates a higher primary production in the south (Sinninghe Damst´e and K¨oster, 1998).
In any case, recent views on the black shale discussion are less polarised and it is now generally agreed upon that at least some primary productivity is needed to cause anoxia and that the latter enhances preservation of labile organic matter com-pounds.
2 Model setup 2.1 Model description
The Mediterranean version of MOMA (e.g. Webb et al., 1997), used as the basis for our model, is a geopotential height coordinate, primitive equation model adapted from the MOM from the Geophysical Fluid Dynamics Laboratory (Bryan, 1969; Pacanowski, 1995). The model parameters used in this study are summarized in Table 1.
The most important parameters for describing the dynamic state of the ocean are potential temperature, salinity, velocity and pressure. The evolution of these parameters in time at all points in the discretised ocean can be described by the ocean primitive equations. These consist of a three-dimensional momentum equation, an advection-diffusion equation for the tracers heat (temperature) and salt, a continuity equation and an equation of state (IES80, Fofonoff and Millard, 1983). In order to reduce the computational load of the model, the Boussinesq and hydrostatic approximations are made.
Table 1. Model parameters.
Domain Latitude −5–50◦N
Longitude −75–10◦E
Resolution Horizontal 0.5×0.5◦
Vertical 10–500 m
Timesteps Baroclinic timestep 4800 s
Barotropic timestep 80 s
Horizontal mixing parameters Biharmonic eddy viscosity coefficient 2×1019cm4s−1
Biharmonic eddy diffusivity coefficient 1×1019cm4s−1
Vertical mixing parameters Laplacian eddy viscosity coefficient 1.5 cm2s−1
Laplacian eddy diffusivity coefficient 1 cm2s−1
adopted from the Mediterranean MOMA code (Haines and Wu, 1998) and extended to depths beyond 3000 m with 4 ad-ditional levels 500 m apart.
Following the constraints inherent to the numerical scheme (Pacanowski and Griffies, 1999), barotropic and baroclinic time steps of 80 and 4800 s (80 min) have been chosen, respectively. Eddy viscosity and diffusivity coeffi-cients values of 2×10¹⁹ and 1×1019cm4s−1 in the hori-zontal and 1.5 and 1.0 cm2s−1in the vertical are used (Ta-ble 1).
2.2 Topography/bathymetry
The model domain, the North Atlantic area at the CTBI (∼93.6 Ma), is bounded by the latitudes 5◦S and 50◦N and the longitudes 75◦W and 10◦E. In the horizontal, this gives 171×111 horizontal grid points. This area (Fig. 1a) in-cludes, besides the North Atlantic Basin, gateways to the Arctic seas through the Western Interior Seaway (WIS) and the Norwegian Seaway, and gateways to the global ocean through the CAS (Pacific gateway), the EAS (South Atlantic gateway) and the PSoG (Western Tethys).
M¨uller et al. (2008) have recently created a database with continuously scaled, high resolution (0.1◦×0.1◦) global bathymetry grid reconstructions considering only oceanic lithosphere, for the 140–0 Ma period with 1 Myr intervals. The spatial resolution is high, but the data used for the re-constructions makes this possible; marine magnetic anomaly data, palaeomagnetic data and rotation poles together with information on mid-oceanic ridge subduction events and the rules of plate tectonics are either available at this resolution or known well enough to allow for this resolution. Detailed information about the reconstructions is beyond the scope of this paper, but can be found in the Supplement from M¨uller et al. (2008). We chose the bathymetry reconstruction at 90 Ma as the basis for our bathymetry. It matches the CCSM landmass configuration better than the 93 Ma reconstruction,
which would have been preferable in view of the timing of OAE2.
The oceanic lithosphere reconstruction from M¨uller et al. (2008) has been discretised in depth to our 23 defined lev-els. The CCSM3 bathymetry, based on the reconstructions of C. R. Scotese, R. Blakey and published literature and con-structed/adapted by Sewall et al. (2007), provides the infor-mation required to add a shelf to this oceanic lithosphere. Af-ter combining the two bathymetries, the resulting bathymetry is smoothed to avoid topographic instabilities at runtime and shelf depth is increased to 220–260 m to provide sufficient vertical grid cells to resolve shallow flow. The bathymetry is cropped to retain only the North Atlantic Basin and the gate-ways to the global ocean, hereby creating spaces in the grid to place ‘sponges’, in which temperature and salinity values are restored every time step to boundary conditions (Sect. 2.4).
Incorporation of features differing between the M¨uller et al. (2008) and CCSM bathymetries has been conducted with the intent to stay as close to the CCSM bathymetry as possible. The possible presence of the Great Caribbean Arc at the contact between the Farallon and Proto-Carribean plate (Pindell and Dewey, 1982) and the Caribbean Plateau basalts west of the CAS, as present in the bathymetry of M¨uller et al. (2008), have not been included in our bathymetry to avoid limitations to flow in the CAS (Sewall et al., 2007).
A connection to the South Atlantic Ocean by means of the EAS may have existed before the CTBI, but recent research shows no consensus on this subject (e.g. Moulin et al., 2009; Poulsen et al., 2003; Pletsch et al., 2001). We chose a palaeo-geography with a closed EAS as our starting point. A South Atlantic sponge will be attached to the standard bathymetry to simulate a deep water connection to the South Atlantic Ocean only for the experiment in which the influence of a South Atlantic connection with the North Atlantic is exam-ined.
platforms in the Western Tethys do not inhibit intermediate water flow. The other global ocean connections are not put in the model palaeogeography because the CCSM3 results show that the inflow through these gateways is small.
Another important feature is the mid-oceanic ridge run-ning from NE to SW in the main part of the North Atlantic (M¨uller et al., 2008). The CCSM3 bathymetry, on the other hand, contains no ridge; the main basin has a distorted bowl shape. Because a mid oceanic ridge is expected when active spreading takes place, it has been included in the bathymetry. Furthermore, it may pose a serious limitation to deep water flow in the basin.
2.3 Surface boundary conditions
The horizontal momentum equations and the tracer equations all contain a term describing the forcing of each parameter by processes at the surface. Surface processes influencing tem-perature and salinity are captured in a heat and water flux, re-spectively. For the horizontal velocities, wind stress is set at the surface boundary. All boundary conditions are extracted from the Cenomanian CCSM3 results and interpolated to our grid.
Validation of these boundary conditions is unfortunately very hard, if not impossible. The main reasons are the lack of other model simulations for a similar Cretaceous period and the lack of proxies for the required boundary conditions (e.g. Sewall et al., 2007). However, since our study focuses on sensitivity experiments, the boundary conditions are the same for all but one of the experiments and, consequently, will not influence the qualitative results from the regional model.
2.3.1 Heat flux
A simple standard restoring boundary condition is imple-mented in the model (Bryan and Cox, 1967; Cox, 1970). The air temperature is prescribed and the downward heat flux is calculated with
Q = ρ CpŴ (Tair −Tsurface) (1)
whereQis the downward heat flux [J m−2s−1],ρis the
den-sity of seawater [kg m−3],C
pis the specific heat of sea water, ∼3.9×10³J kg−1K−1,Ŵis a relaxation coefficient which is
dependent on the relaxation time scale and the upper ocean layer thickness, Ŵ=1z/1trelax. With a relaxation time of
10 days, similar to the relaxation time scales used by Rahm-storf (1995) and RahmRahm-storf and Willebrand (1995), ρCpŴ
becomes 42 kJ m−2s−1K−1.
The heat flux is calculated every time step with an updated upper ocean layer temperature and an invariable surface air temperature throughout the year, obtained from the 2 m air temperature of the CCSM3 results (Fig. 1b). Air tempera-tures decrease, as expected, when moving to higher latitudes. Deviations from this trend can be found near the continental
landmasses of Africa and South America where the air tem-perature is a few degrees higher. Part of this is related to the warm surface waters coming from the South Atlantic in the CCSM3 results (Sect. 2.5), while a predominantly westward wind over the African continent may account for the rest. 2.3.2 Water flux
The easiest way of including the surface water flux is in-troducing a virtual salt flux (VSF) calculated from the av-erage evaporation minus precipitation data from the CCSM3 run (Fig. 1c). Differences between models with a boundary-model freshwater flux and VSF have proved to be generally small or statistically insignificant (Yin et al., 2010).
Because the volume of water in a grid cell is not changed, there is one disadvantage to using a VSF: when a water flux is included in the model by means of a VSF, the amount of water entering a grid cell through the surface must be small compared to the grid cell volume. Large volumes of water therefore cannot be added to a single grid cell with the VSF without inducing a significant error in the salinity.
Evaporation is in most of the Cretaceous North Atlantic (Fig. 1c) dominant over precipitation, with large parts show-ing net evaporation of 2–5 mm day−1. The only exceptions to this are areas along the North American coast where pre-cipitation locally exceeds evaporation on a yearly basis by 2 mm day−1, and along the South American and African coasts where precipitation is significantly higher and reaches values up to 9 mm day−1.
2.3.3 Windstress
In the horizontal momentum equations, the momentum flux through the sea surface comes from wind stress (Fig. 1d) and momentum transfer in connection with a fresh water flux. The latter is disregarded as its size is small compared to the wind stress. 4 year averaged zonal and meridional wind stress components are taken from the CCSM3 run results. 2.4 Sponges
sponge are (partly) restored to the salinity and temperature of the Pacific, as found in the CCSM3 run, before the wa-ter flows back into the North Atlantic Basin with these “Pa-cific” characteristics. The decreasing restoration timescale towards the gateways gradually reduces the density contrast between sponge and basin which otherwise could have lim-ited exchange and induced non-physical flow at the gateways. The first use of this type of sponge with the MOMA is from Roussenov et al. (1995), who justified it as a way “[...] to control areas of the model which are not well resolved.”. It had been used before in other regional ocean models (e.g. Philander et al., 1987) and has since been widely used for Mediterranean ocean circulation research (e.g. Haines and Wu, 1998; Meijer et al., 2004).
Our regional model used in this study can be equipped with 3 sponges (Fig. 1a) to simulate water exchange with the global ocean. Depending on the configuration needed for each of the experiments, one or more of these sponges can be attached to the model through a gateway with a changeable geometry (depth, width, full bathymetry).
Constant-depth sponges would introduce unrealistic bathymetric gradients, enhance undesirable upwelling and decrease water exchange with the North Atlantic Basin. Therefore smooth bathymetric profiles have been constructed for the sponges. With these, the vertical transport of water in the sponges from depths below gateway depth proceeds with more gradual upward water transport and higher horizontal velocities in the gateway.
2.5 Initial conditions
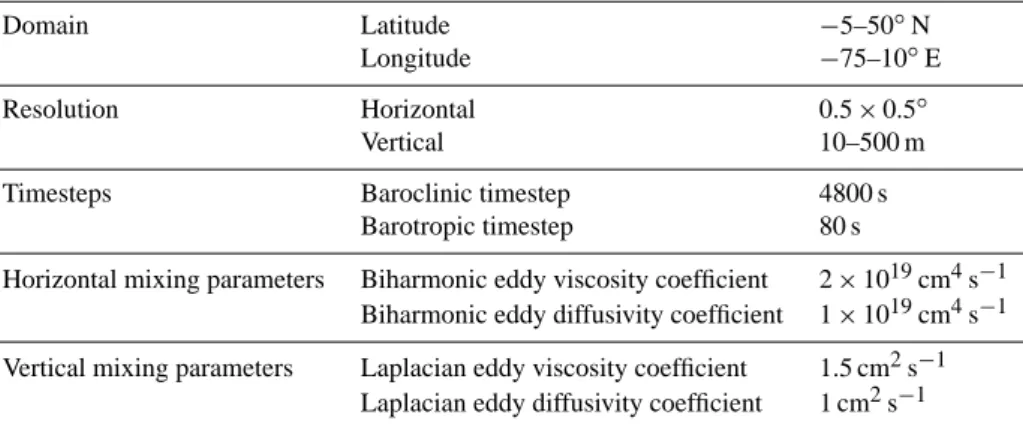
The initial conditions for all experiments consist of pre-scribed tracer fields of temperature and salinity (Fig. 2) with which the density structure of the ocean is defined directly. These fields are interpolated from the 4-year average salin-ity and temperature data of the CCSM3 run. All experiments start with zero velocity fields.
In the first 100 m of the CCSM3 results, the majority of the basin is affected by inflow from the Tethys which flows diag-onally through the basin to the Pacific and westwards from the gateway and back east in a western boundary current along the North American coast. At slightly greater depths, between 100 and 700 m, relatively cold water flows in from the Pacific and Tethys. In the upper part of this depth inter-val, this cold water follows the coasts of Africa and South America. At a greater depth, the cold water spreads out over the whole southern half of the North Atlantic Basin. The current from the Tethys to the Pacific marks the separation between cold southern water and warm northern water. The latter flows in a clockwise gyre between 25 and 40◦N. High temperature gradients form above 700 m between the north-ern and southnorth-ern part of the basin. At a depth of 700 m the PSoG sill is reached and inflow from the Tethys ceases. This causes disintegration of the Tethys-Pacific current, as well as of the high temperature gradient, until both are completely
gone at 1000 m. Below 1000 m depth the temperature is al-most uniform and equals that of the Pacific. Not present in our reference experiment is an inflow of warm surface water from the South Atlantic, which dominates the temperature distribution in the southern North Atlantic down to 100 m.
The salinities in the North Atlantic show a pattern similar to that of temperature. Surface salinities are dominated by the net evaporation over most of the basin, a South Atlantic and Tethys inflow, and extremely low salinities (20 g l−1) in the continental seaways. At depth, the southern half of the basin is less saline than the northern half, again separated by the current between the Tethys and Pacific. At depths below 1000 m, salinities are approximately uniform at 35.5 g l−1.
3 Analysis and results 3.1 Reference experiment
The first model configuration tested (REF, Table 2) features the simplest geometry and boundary conditions. Attached to the North Atlantic Basin are two sponges with gateway depths of 3000 and 700 m, similar to depths in the CCSM3 bathymetry, simulating respectively the Pacific and Tethys oceans. This experiment will be used to gain insight into ocean circulation and tracer (temperature and salinity) distri-bution in a regional model for the case that the North Atlantic was connected only to the Pacific and Tethys (i.e. no connec-tion with the South Atlantic ocean or with the Arctic region). Results will be compared with the CCSM3 results to assess to what extent this regional model is able to reproduce the main features of the global model results. Because each experi-ment starts with the initial (CCSM3) salinity and temperature field, the spin up of the model is short (<200 years). Figures and values presented for the regional model are averages of the last 50 years of a 500 year run when basin-averaged as well as layer-averaged tracer values are constant and confirm that the model has reached an equilibrium state.
0 10 20 30 40 50
0 10 20 30 40 50
0 10 20 30 40 50
−70 −60 −50 −40 −30 −20 −10 0 10
0 10 20 30 40 50
−70 −60 −50 −40 −30 −20 −10 0 10
0 10 20 30 40 50
0 10 20 30 40 50
32 34 36 38 40 42
0 10 20 30 40 50
−70 −60 −50 −40 −30 −20 −10 0 10
0 4 8 12 16 20 24 28 32
0 10 20 30 40 50
−70 −60 −50 −40 −30 −20 −10 0 10
oN oN oN oN
oN oN oN oN
oE oE
Temperature [oC] Salinity [g/l]
10 m 10 m
100 m 100 m
300 m 300 m
1000 m 1000 m
Fig. 2. Initial conditions. The temperature (left column) and salinity (right column) from the CCSM3 results at the surface and depths of
Table 2. Experiments. All experiments in this study and the CCSM3 run, and corresponding figures are listed here. Abbreviations for: IC,
initial conditions; BC, boundary conditions; Pac/Tet/SAtl, Pacific/Tethys/South Atlantic gateway depths; SL, sea level.
IC BC Pac Tet SAtl SL Fig(s).
CCSM – – 3000 m 1000 m 1000 m High 2,5b
REF CCSM CCSM 3000 m 700 m Closed High 3–6
ISOIC 15◦C/35 g l−1 CCSM 3000 m 700 m Closed High –
NOWIND CCSM No winds 3000 m 700 m Closed High 7
SILLED CCSM CCSM 1000 m 700 m Closed High S1
PACN CCSM CCSM Open N 700 m Closed High –
PACS CCSM CCSM Open S 700 m Closed High –
SATL CCSM CCSM 3000 m 700 m 3000 m High 8,9a,10a, S2
LOWSL CCSM CCSM 3000 m 500 m Closed Low –
LOWSL-TET CCSM CCSM 3000 m 200 m Closed Low 9b,10b,11
a large gyre in the northern part of the basin reducing the salinity of its waters.
Another source of low salinity water is the net precipita-tion along the coasts of South America and Africa (Fig. 1c) where it contributes to the formation of relatively low salin-ity surface waters. The total precipitation in the coastal areas is 0.8 Sv (Sverdrup = 106m3s−1), significantly less than the Pacific and Tethyan inflow. Only the surface layer is affected by precipitation, at 40 m depth all precipitation effects are indistinguishable in the “background” salinity.
In the northern part of the basin, the surface water flux is also the main reason for the high salinities. The total evapo-ration flux from the North Atlantic has a magnitude of 1.3 Sv. Evaporation minus precipitation has the largest values in the center of the North Atlantic where it reaches net evaporation rates of 6 mm day−1. The highly saline surface waters have a density larger than the layers below and mix or sink caus-ing the salinity in the lower layers to increase as well until density differences are too small to continue vertical move-ments.
The boundary between the warm saline northern (>15◦N) and colder, less saline southern part is marked by the pres-ence of a geostrophic Tethys-Pacific-directed current be-tween 12 and 17◦N and depths down to 700 m (Fig. 3). This
current is part of a large scale clockwise flow in the northern part of the basin and, next to the Tethys-Pacific current, con-sists of a western boundary current along the North Amer-ican shelf. The eastern part of this gyre is less clear, the western boundary current splits up in a broad zone with pre-dominantly southward flow, in which horizontal velocities decrease and vertical velocities increase. Along all Amer-ican, African and, to a lesser extent, European coasts the opposite can be observed: shallow water velocities increase where deep water comes to the surface in coastal upwelling zones (Fig. 5a).
At deeper levels, the southern boundary of the northern gyre is positioned further north(-west) with respect to the sur-face layer (Fig. 4). While the gyre becomes smaller with
depth, the Tethys-Pacific flow band becomes smaller and retains its velocity, leading to high velocities in the whole northern gyre. At a depth of 500 m, velocities and elevated salinities decrease rapidly towards basin average values at 1500 m where the Tethys-Pacific flow band has completely disintegrated and salinities in the whole basin are homoge-neous at∼35.6 g l−1.
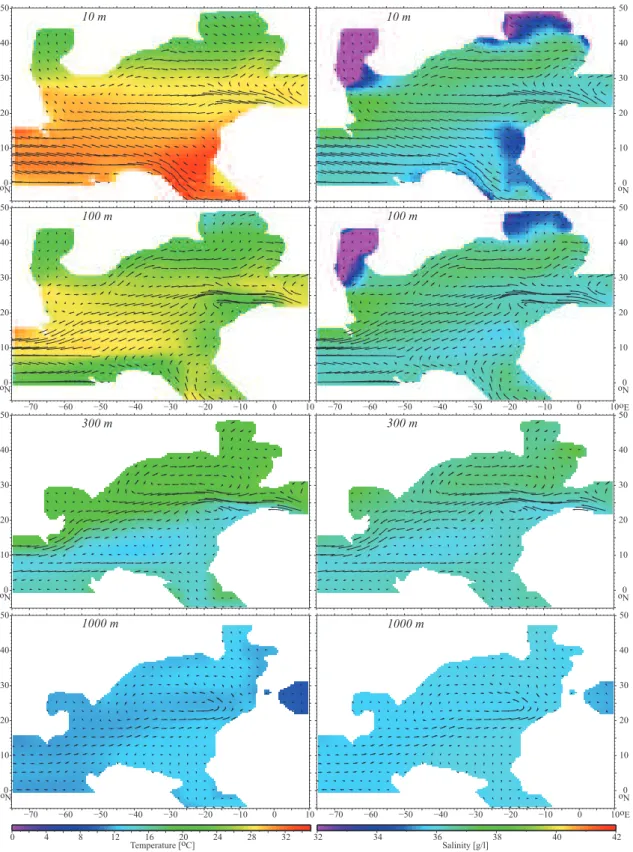
At depths greater than 300 m, a temperature front exists with a maximum temperature difference of 5◦C between a warm northern and cold southern part of the basin, which fades out at depth as cold water enters the central part of the basin from the Pacific. In the top 140 m there is no steep tem-perature gradient between the northern and southern parts of the basin. This surface layer temperature is strongly con-nected to the surface air temperature.
While surface salinity of the Tethys is similar to the salin-ity along the African coast, its temperature is very differ-ent. The warm surface water from the Tethys can be traced straight to the west, but horizontal and vertical velocities (Fig. 5a) also indicate strong downwelling and upwelling near the PSoG. Cold, low-salinity intermediate water is up-welled in the coastal zone where it replaces the warm water from the Tethys, and flows southwestwards along the African coast. In the salinity figures (Fig. 3), this process is harder to recognize because Tethyan and deep water have similar salinities. In general, upwelling in the African coastal zone is widespread and effectively reduces salinities and tempera-ture in the upper 500 m.
At depths as shallow as 40 m a pronounced low tempera-ture area (20◦C at this depth) is present between the African
0 10 20 30 40 50
0 10 20 30 40 50
0 10 20 30 40 50
0 10 20 30 40 50
32 34 36 38 40 42
0 10 20 30 40 50
−70 −60 −50 −40 −30 −20 −10 0 10
0 4 8 12 16 20 24 28 32
0 10 20 30 40 50
−70 −60 −50 −40 −30 −20 −10 0 10
oN oN oN
oN oN oN
oE
Temperature [oC] Salinity [g/l]
300 m 300 m
1000 m 1000 m
40 m 40 m
Fig. 3. REF tracer patterns. Temperature (left) and salinity (right) slices taken at depths of 40, 300 and 1000 m. The paths of water particles
of every fifth grid point followed for 42, 84 and 114 days are overprinted on the tracer colours. In order to visualize low velocity currents at deeper levels, the time during which water particles are followed increases with depth.
American coast is the presence of mesoscale eddies extend-ing to depths of 300 m; cyclonic eddies are associated with upwelling, anticyclonic eddies with downwelling.
Total inflow from the Pacific is 48 Sv with the main in-flow concentrated at depths between 1000 and 2500 m and outflow spread over shallower depths. The Tethyan inflow is smaller at 32 Sv. In the PSoG, the westward volume flux peaks in the upper 300 m, the eastward flux in the deeper layers. The circulation with respect to the Pacific is estuarine (i.e. shallow out, deep in), with respect to the Tethys it is anti-estuarine (i.e. shallow in, deep out). In order to visualize the overall basin circulation, we computed the zonal overturn-ing streamfunction (Fig. 6). The zonal overturnoverturn-ing rate is
0
500
1000
1500
2000
2500
3000
3500
4000
4500
5000
0 10 20 30 40 50
0
500
1000
1500
2000
2500
3000
3500
4000
4500
5000
0 10 20 30 40 50
0
500
1000
1500
2000
2500
3000
3500
4000
4500
5000
−70 −60 −50 −40 −30 −20 −10 0 10
0
500
1000
1500
2000
2500
3000
3500
4000
4500
5000
−70 −60 −50 −40 −30 −20 −10 0 10
0 5 10 15 20 25 30 35
Temperature [oC]
32 33 34 35 36 37 38 39 40 41 42
Salinity [g/l]
Depth [m]
Depth [m]
oE
oN
W E W E
S N S N
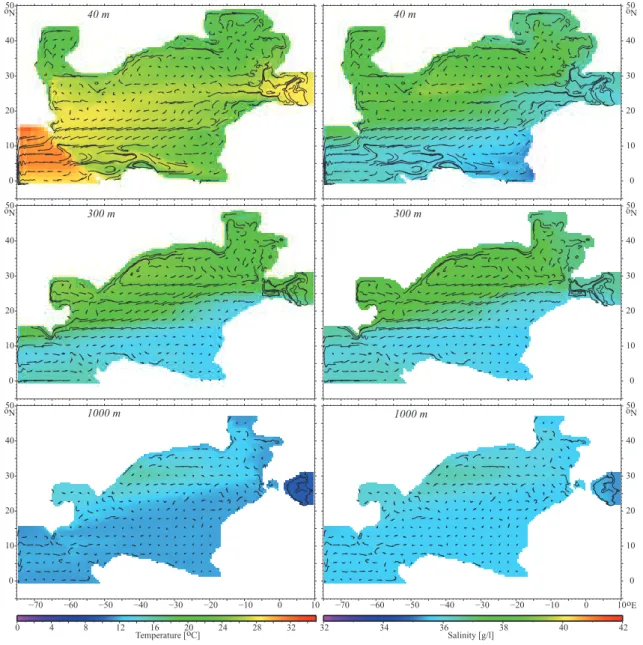
Fig. 4. REF cross sections. Two sets of cross sections of temperature (left) and salinity (right) give an overview of the tracer distribution in
the vertical direction. The west-east sections are taken at 27.5◦N and the south-north sections at 25◦W.
0 10 20 30 40 50
−70 −60 −50 −40 −30 −20 −10 0 10
−70 −60 −50 −40 −30 −20 −10 0 10
0 10 20 30 40 50
−70 −60 −50 −40 −30 −20 −10 0 10
−70 −60 −50 −40 −30 −20 −10 0 10
a
−12.5 −10.0 −7.5 −5.0 −2.5 0.0 2.5 5.0 7.5 10.0 12.5
0 10 20 30 40 50
−70 −60 −50 −40 −30 −20 −10 0 10
−70 −60 −50 −40 −30 −20 −10 0 10
0 10 20 30 40 50
−70 −60 −50 −40 −30 −20 −10 0 10
−70 −60 −50 −40 −30 −20 −10 0 10
b
V
ertical velocity 10
-6
m s
-1
oE oE
oN oN
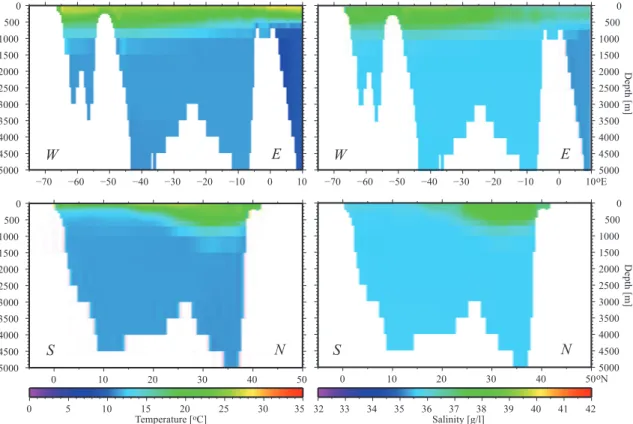
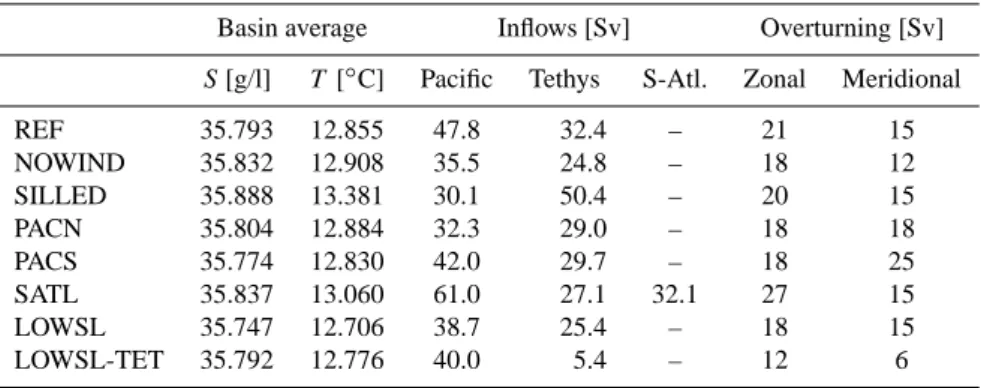
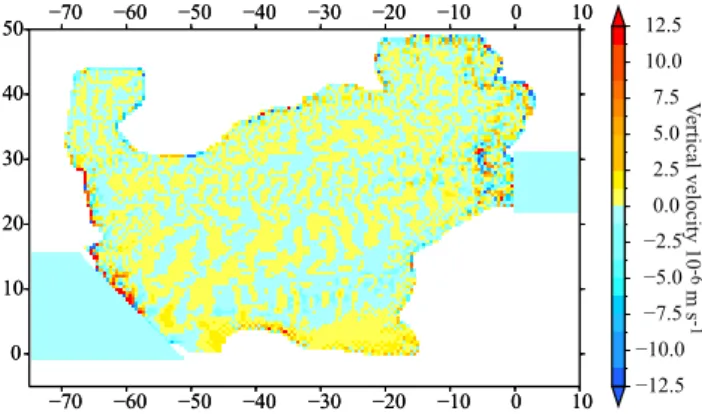
Fig. 5. Upwelling. Mean vertical velocity at 40 m from (a) REF and (b) the Cenomanian CCSM3 run. Upward velocities are positive and
downward negative. 10×10−6m s−1corresponds to∼0.86 m day−1.
In summary, the main features of the REF experiment are: a front in temperature and salinity between the northern and southern North Atlantic emphasized by an east-west directed current between the Tethys and Pacific, a large clockwise gyre in the northern half of the basin and a large coastal up-welling zone in the south, and zonal overturning consisting of one large counterclockwise cell. A summary of the quan-tifiable results of all experiments is given in Table 3.
A new experiment (ISOIC) with isothermal (15◦C) and isohaline (35 g l−1) initial values in the whole basin and the standard boundary conditions was run to verify or refute the
Table 3. Results. Summary of results.
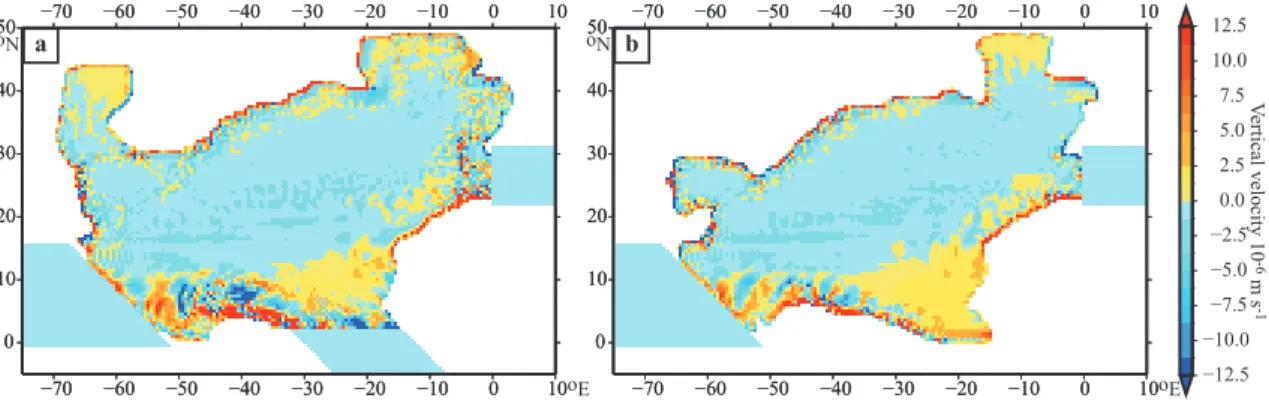
Basin average Inflows[Sv] Overturning[Sv]
S[g/l] T [◦C] Pacific Tethys S-Atl. Zonal Meridional
REF 35.793 12.855 47.8 32.4 – 21 15
NOWIND 35.832 12.908 35.5 24.8 – 18 12
SILLED 35.888 13.381 30.1 50.4 – 20 15
PACN 35.804 12.884 32.3 29.0 – 18 18
PACS 35.774 12.830 42.0 29.7 – 18 25
SATL 35.837 13.060 61.0 27.1 32.1 27 15
LOWSL 35.747 12.706 38.7 25.4 – 18 15
LOWSL-TET 35.792 12.776 40.0 5.4 – 12 6
−21
−18
−12 −12 −12
−6 −6
−3
0
0
0
0
0
0
0
0
500
1000 1500 2000 2500 3000 3500
4000
4500
5000
−60 −50 −40 −30 −20 −10 0
Depth [m]
oE
Fig. 6. REF zonal overturning. Zonal overturning in the North
Atlantic Basin. Contour lines are drawn every 3 Sv, blue colours indicate negative (counterclockwise in this view) overturning and red colours positive (clockwise). In the East, this graph stops at the Tethys sponge while the boundary with the Pacific sponge does not
run N–S. Consequently, west of 52◦W the overturning
streamfunc-tion shown is affected by overturning in the sponge. The positive cells between 2000 and 4000 m are an artifact hereof.
Besides a slightly larger northern gyre, both horizontal ve-locities and patterns of upwelling are largely similar in the CCSM3 and REF. The Tethys-Pacific flow band and the di-minishing size of the northern gyre with depth are found in both models, as well as upwelling in all coastal areas and ex-tensive upwelling in the southern part of the basin and along the African coast. Small differences between the experi-ments can be found in the surface circulation pattern where, as mentioned before, the CCSM3 includes an inflow of South Atlantic water to a depth of 100 m which we choose not to implement in the reference experiment.
When looking into the differences in more detail, the vol-ume averaged temperature difference between CCSM3 and our reference experiment is less than 0.01◦C. Larger differ-ences occur in the upper 100 m (the upper 5 layers of the
model) where the average difference is 2◦C. A main con-tributor to this difference is the upwelling zone between the African and American continents (Fig. 5); this is warmer in the CCSM3 because the South Atlantic inflow counteracts the cold upwelling. However, an almost uniform difference of 1.4◦C can be attributed to a weaker surface heat flux in our model caused by a different parametrization of the sur-face heat flux and a less vigorous vertical mixing in the top layers. At intermediate depth, local differences up to 5◦C occur in the northwestern part of the North Atlantic and the proto-Gulf of Mexico south of the WIS. The northern gyre in REF extends to these areas enclosing warm saline water, while it is limited to more eastern longitudes in the CCSM3 run.
Salinity differences are larger than temperature differences with an average of about 0.04 g l−1. Salinity is consistently higher with 1.0 g l−1in the upper 100 m with respect to the CCSM3 due to the fact that we do not include a small coastal runoff (fresh water) flux in the surface forcing and, again, to more vigorous vertical mixing in the top layers. Areas with anomalously large differences are the WIS and the area between North America and the European shelf where the North Atlantic is connected to the polar seas in the CCSM3. Inflow from these areas, however, is very small (0.6 Sv) and does not create differences outside the surface layers. The extended gyre in the northern North Atlantic also has its ef-fect on the salinities which can be up to 2 g l−1higher.
3.2 Wind forcing and upwelling
Understanding the cause of the modelled upwelling is im-portant to deduce what ultimately drives the system towards higher productivity and associated black shale formation, es-pecially during OAEs. Upwelling is generally associated with winds acting on the sea surface inducing transport in the Ekman layer. To assess the importance of wind on up-welling, a model has been run (NOWIND) which is a restart of REF without surface wind forcing.
Without winds, mixing between surface and deeper water layers decreases significantly. This results in temperatures in the upper 20 m of the basin being similar to the air tempera-ture, due to the imposed relaxation, and salinities are strongly influenced by the fresh water flux. The average temperature difference with respect to the CCSM3 in the upper 100 m has decreased in this experiment, while the salinity differ-ence increased. Reduced shallow-water mixing enhances the amount of heat and salt stored in the surface layers. At 200 m depth, a division between a warm, saline northern and cold, less saline southern part of the basin forms which exists down to 1500 m. The division is formed in a similar way as in REF. Although similar in formation, the northern gyre is much smaller without wind as the Tethyan inflow goes straight to the west instead of diagonally through the basin. In the southern part of the basin, flow directions vary strongly, but the general transport direction is to the southwest. Changes with respect to REF include also a decreased inflow from the Pacific, 36 Sv, and Tethys, 25 Sv. Although the circula-tion has changed and gateway transport has decreased, zonal overturning is little affected by the lack of wind forcing; it is still dominated by one negative cell, i.e. anti-clockwise flow in a WE-section, with a strength of 18 Sv.
The main difference with respect to REF concerns the up-welling pattern which has changed dramatically in the upper 300 m. With wind stresses, upwelling was concentrated in the coastal areas. Now it is virtually homogeneous through-out the whole basin withthrough-out clear upwelling zones near the coasts (Fig. 7). Also, the warm and cold cored mesoscale eddies along the South American coast have completely dis-appeared. Flow along the South American coast is now con-centrated in a small east-west directed current parallel to the coast. The only persistent upwelling zone that influences tracer distribution is the area between 0 and 5◦N in between Africa and South America, where the deep water inflow from the Pacific is still upwelled to the surface (Fig. 7).
From the results of NOWIND it can be deduced that the concentrated upwelling zones as well as the mesoscale eddies are driven by wind. In REF, upwelling in the southern part of the basin is stronger, with respect to the north, because all wind stresses are approximately WSW directed over large areas of sea surface. Ekman transport in the upper part of the ocean is directed NW up to latitudes of 20◦N where the average wind stress changes direction to NE. The area where both surface currents meet is positioned exactly above the
0 10 20 30 40 50
−70 −60 −50 −40 −30 −20 −10 0 10
−70 −60 −50 −40 −30 −20 −10 0 10
0 10 20 30 40 50
−70 −60 −50 −40 −30 −20 −10 0 10
−70 −60 −50 −40 −30 −20 −10 0 10
−12.5 −10.0 −7.5 −5.0 −2.5 0.0 2.5 5.0 7.5 10.0 12.5
V
ertical velocity 10
-6
m s
-1
Fig. 7. Upwelling without wind. Vertical velocity at 40 m depth for
the NOWIND experiment.
warm-cold boundary at deeper levels (Fig. 3). Warm saline surface waters in the Ekman layer in the northern part of the basin sink on the northern side, cold less saline waters on the southern side. Without this supply of surface waters to the deeper levels in NOWIND, the deep part of the northern gyre is not supplied with warm saline water any more.
The mesoscale eddies observed in REF can be compared with the cold- and warm-cored rings that form on both sides of the present-day Gulf Stream. Wind stresses on the surface cause baroclinic instabilities by upwelling and downwelling water, which trigger the formation of these eddies on both sides of the west-directed current; warm-cored eddies form on the north side of the current, cold-cored eddies on the south side. If instead of a time-averaged, a set of consecutive time slices were taken from the circulation pattern, it could be seen that the eddies move along the coast and disintegrate when they lose strength and reform around 45◦W.
3.3 Gateway geometry effects 3.3.1 Sill depth of the gateways
As mentioned before, the depth of the gateways, especially the depth of the CAS, is a point of discussion in reconstruc-tions of the CTBI palaeogeography. In the bathymetry of pre-vious experiments, the maximum depth at which exchange with the Pacific was possible through the CAS was 3000 m. In principle it is expected that a shallower connection with the Pacific would inhibit deep water exchange and hence in-fluence conditions in the North Atlantic. This has been tested by placing a sill with a depth of 1000 m in the CAS (SILLED experiment) leaving the PSoG at its original 700 m depth.
saline water in the basin is skewed with respect to REF in favour of the cold, less saline water. Also, the Tethys-Pacific flow band contains more variation in flow directions and de-livers more cold, less saline water to the northern gyre. At all depths, the influence of the additional intermediate Pacific inflow is noticeable (Fig. S1, Supplement). From 1000 to 3000 m a downward current is active just east of the sill, transporting slightly warmer and more saline water, with re-spect to deep Pacific water, to these depths. This warm saline water is transported through the whole basin by two main currents along the northern and southern coasts where they feed the upwelling zones. As a result, the temperature and salinity in the north decrease slightly while they increase in the south, reducing the differences in the basin. Deep wa-ter (>1000 m) in the North Atlantic reaches average tem-peratures 0.5◦C and salinities 0.1 g l−1higher than in REF.
At gateway depths the increased average temperature in the North Atlantic increases the density contrast with the Pacific, driving a stronger exchange flow which is not evident from the weaker overturning of 20 Sv because of meridional aver-aging. The depth of significant overturning also increases to 2500 m in relation to lower density differences in the water column.
3.3.2 Width of the Atlantic-Pacific gateway
The second sensitivity test with respect to the Pacific gateway geometry relates to the effects of a reduced CAS width. The bathymetry in the sponge and basin are close to the standard bathymetry. The only difference is the width of the CAS; in the experiment PACN the southern 6◦of the CAS have been
turned to land to leave an open connection in the North, in PACS the width has been reduced from the north with the same amount.
Reducing the cross sectional area of the gateway results in a lower total Pacific inflow, 32 Sv for PACN (42 for PACS) versus 48 Sv in REF. The flow pattern through the gateway has changed more dramatically than in the SILLED experi-ment. Inflow in the upper 300 m has become negligible and decreases further in the 1000 to 3000 m depth range. Inflow from the Tethys is also slightly lower in both experiments (29 Sv).
The changes in tracer distribution in the basin are mainly the result of a shift in the position of Pacific inflow. The Tethys-Pacific flow band still dominates the flow between the surface and 1000 m in both PACN and PACS, but there are small shifts in its position. The reduced surface inflow in PACN has been forced to the north which causes 0.5–1.5◦C
cooling with respect to REF in the upper 200 m along the whole South American coast. At intermediate depth, rel-atively warm Pacific waters flow along the coast and feed the upwelling zones, while simultaneously the northern gyre stays warmer (∼1◦C) because of this shifted current. In PACS, the whole Tethys-Pacific flow is shifted to the south causing a small expansion of the northern gyre and a colder
southern basin due to the increased upwelling of Pacific wa-ter as expressed also by the increased meridional overturning (25 Sv). Overall, the tracer and large scale circulation pat-terns are little affected by changes in the gateway width. 3.4 An open Equatorial Atlantic Seaway
This and the next section present the results of two exper-iments examining pre-OAE and post-OAE scenarios. The post-OAE contains a deep water connection with the South Atlantic through the EAS (SATL experiment). This has been shown to refresh the basin (Poulsen et al., 2003) and is ex-pected to change the large scale circulation pattern and asso-ciated upwelling.
The open two-way connection between the North At-lantic Basin and the South AtAt-lantic Ocean is implemented by means of a South Atlantic sponge. The gateway has a width of 10◦(∼1000 km) and depths of 300 to 3500 m, with
the greatest depths close to the African continent, similar to the CCSM3 bathymetry.
The net inflow of warm surface water from the South At-lantic as found in this experiment (1.7 Sv) is very close to the 1.8 Sv observed in the CCSM3 results. In the CCSM3, the whole western North Atlantic is affected, while here the warm saline water in the surface layer is trapped near the gateway where it flows along both continents to down-welling zones (Fig. 8; Jones et al., 1995). At depths up to 2500 m, the South Atlantic temperatures and salinities are higher than those in the North Atlantic and both the inflow and the downwelling of saline water are clearly visible in the cross-sections (Fig. S2, Supplement). The upwelling zone of the deep Pacific water situated between Africa and America is suppressed by the inflow and is cut by a large coast parallel downwelling zone of warm saline South Atlantic and surface water (Fig. 9a). In all previous experiments, an east- flowing deep current supplied water to the upwelling zones along the South American coast; here it has been replaced with a west-flowing current of warmer, more saline South Atlantic water (Fig. 8).
The northern gyre and the warm saline water it traps are af-fected by the South Atlantic inflow (32 Sv). The deep water inflow of Pacific cold, low salinity water is strongly reduced and forced to the north by the South Atlantic warm, saline water which occupies the whole southern and eastern North Atlantic at depth. Simultaneously, a deep current (>1500 m) transports a small part of the Pacific inflow along the North American coast to the north where it is caught in the coastal upwelling zone. The upwelling water in the North and the north-westward driven southern boundary result in a weak-ening and narrowing of the gyre which extends to only 750 m depth in this experiment.
32 34 36 38 40 42
0 4 8 12 16 20 24 28 32
oN oN oN
0 10 20 30 40 50
oN oN oN
oE
Temperature [oC] Salinity [g/l]
0 10 20 30 40 50
300 m 300 m
0 10 20 30 40 50
−70 −60 −50 −40 −30 −20 −10 0 10
0 10 20 30 40 50
−70 −60 −50 −40 −30 −20 −10 0 10
1000 m 1000 m
0 10 20 30 40 50
40 m
0 10 20 30 40 50 40 m
Fig. 8. SATL tracer patterns. Temperature (left) and salinity (right) slices taken at depths of 40, 300 and 1000 m from the SATL experiment.
Overprinted on the tracer colours are the paths of waterparticles of every fifth grid point followed for 42, 84 and 114 days.
now brought into motion by the density contrast between Pa-cific and South Atlantic water.
3.5 Lowered sea level
All productivity related OAEs in the Mesozoic coincide with a marine transgression. For a pre-OAE scenario, we therefore lowered the sea level with 150 m with respect to REF, result-ing in the exposure of large areas of the epicontinental shelf area and a shallowing of the gateways (LOWSL experiment). For the PSoG, sea level change results in a maximum gate-way depth of 550 m, the CAS depth does not change because such a small change is below the resolution of the model in deep water.
The shallowing of the PSoG is reflected in the gateway exchange. Flow from the Tethys lowers to 25 Sv (32 Sv in REF) while CAS exchange is also lower at 39 Sv (48 Sv in REF). Relatively to North Atlantic averages, the Tethys in-flow is colder and less saline. Reduced inin-flow therefore re-sults in higher Atlantic salinities and temperatures, on aver-age 0.1 g l−1 and 0.15◦C in the upper 1000 m, respectively. These values would have been higher if the Pacific-derived water at depths below the Tethys gateway had not intruded the northeastern part of the basin and fed the upwelling along the European coasts. Zonal overturning is shallower and drops to 19 Sv due to the decreased Tethyan exchange.
0 10 20 30 40 50
−70 −60 −50 −40 −30 −20 −10 0 10
−70 −60 −50 −40 −30 −20 −10 0 10
0 10 20 30 40 50
−70 −60 −50 −40 −30 −20 −10 0 10
−70 −60 −50 −40 −30 −20 −10 0 10
a
−12.5 −10.0 −7.5 −5.0 −2.5 0.0 2.5 5.0 7.5 10.0 12.5
0 10 20 30 40 50
−70 −60 −50 −40 −30 −20 −10 0 10
−70 −60 −50 −40 −30 −20 −10 0 10
0 10 20 30 40 50
−70 −60 −50 −40 −30 −20 −10 0 10
−70 −60 −50 −40 −30 −20 −10 0 10
b
V
ertical velocity 10
-6
m s
-1
oE oE
oN oN
Fig. 9. Upwelling. Modelled vertical velocity at 40 m depth for an experiment with (a) an open connection with the South Atlantic through
the EAS (SATL), and (b) a reduced shelf area due to low sea level (LOWSL-TET).
−24
−24
−18
−12
−12
−6
−6 −6
0
0
0
0
0
0
0 0
0
0
500
1000 1500 2000 2500
3000
3500
4000 4500
5000
−60 −50 −40 −30 −20 −10 0
−12 −9 −3
0
0
0 0
0
0
0
0 0
0 0
0
0
0
0 6
0
500
1000 1500 2000 2500
3000
3500
4000 4500
5000
−60 −50 −40 −30 −20 −10 0
Depth [m]
b a
oE oE
Fig. 10. Overturning. Zonal overturning in the North Atlantic Basin for the SATL experiment (left) and the LOWSL-TET experiment (right).
Contour lines are drawn every 3 Sv, blue colours indicate negative (counterclockwise) overturning and red colours positive (clockwise).
the density contrast along the coasts is low and eddies are weaker. The areal extent of the upwelling zone between South America and Africa is reduced by at least one third and instead of upwelling along the southern coasts, deep wa-ter is transported north-eastwards to the European coasts.
If we assume that carbonate platforms in the western Tethys inhibited intermediate water exchange between the North Atlantic and Tethys before the latest Cenomanian transgression, a model with a shallower Tethys sponge may be more appropriate. Results of two more experiments with a 200 m deep PSoG (LOWSL-TET experiment) and a closed PSoG are very similar because the exchange with the Tethys is only 5 Sv in the former. The small Tethyan inflow flows along the African coast down to 15◦N and shifts the entire Tethys-Pacific flow to this latitude (Fig. 11). This results in higher salinities (with respect to REF) at shallow to interme-diate depth due to a southwards extended northern gyre. The trend to higher temperatures, however, does not continue; up-welling of deep water from the Pacific has further increased along the European coasts (Fig. 9b).
The largest change with respect to the experiments with a deeper Tethys gateway is, however, not in the tracer patterns but in the overturning. Although inflow from the Pacific is still 40 Sv, the zonal overturning in the North Atlantic has decreased in strength to only 12 Sv (Fig. 10b). Furthermore, the overturning cell extends to only 1500 m and is largely absent east of 15◦W due to the missing Tethyan inflow.
4 Discussion 4.1 MOMA
Our regional model has proven to be a good complement to a global model for (sensitivity) experiments in a dedi-cated region. However, some limitations and boundary con-ditions which should be mentioned are inherent to this re-gional model.
32 34 36 38 40 42
0 4 8 12 16 20 24 28 32
oN oN oN
oN oN oN
oE
Temperature [oC] Salinity [g/l]
0 10 20 30 40 50
0 10 20 30 40 50
0 10 20 30 40 50
0 10 20 30 40 50
0 10 20 30 40 50
−70 −60 −50 −40 −30 −20 −10 0 10
0 10 20 30 40 50
−70 −60 −50 −40 −30 −20 −10 0 10
300 m 300 m
1000 m 1000 m
40 m 40 m
Fig. 11. TET tracer patterns. Temperature (left) and salinity (right) slices taken at depths of 40, 300 and 1000 m from the
LOWSL-TET experiment. The paths of waterparticles of every fifth grid point followed for 42, 84 and 114 days are overprinted on the tracer colours.
models. However, there is a risk attached to the level of detail at high resolutions. In Sect. 2.2, it became clear that the avail-able palaeogeographical reconstructions differ on important points of the bathymetry, like the CAS depth and width, the presence of an EAS and the possibility of Caribbean Plateau basalts near/in the CAS. The choices that have been made add a certain amount of uncertainty to the model results. The gateway geometry sensitivity tests show that the differences in the tracer (salinity and temperature) and velocity fields when one of the disputed features is changed are small and to some extent predictable.
One of the greatest limitations of the MOMA model is its inability to change the total volume of water within the model. Fresh water fluxes do not add water to the model,
4.2 OAE scenario 4.2.1 OAE
OAEs are time envelopes characterised by important per-turbations in the global carbon cycle, the records of which are found globally in sedimentary rocks as excursions in the carbon isotope record (e.g. Scholle and Arthur, 1980). However, organic-rich sediments associated with OAEs are mostly found in the North Atlantic Basin and surround-ing shelf seas (e.g. Friedrich, 2010; Kuroda and Ohkouchi, 2006). For this reason, it is expected that this ocean basin fulfilled certain conditions favourable for the production and subsequent preservation of organic matter.
Trabucho Alexandre et al. (2010) have recently proposed that a combination of hydrothermal nutrient input to Pacific seawater with a stronger thermohaline circulation and inflow of nutrient-rich Pacific sea water to the North Atlantic was behind the deposition of organic-rich sediments during the mid-Cretaceous. Indeed, the mid-Cretaceous was charac-terised by enhanced seafloor hydrothermal activity (seafloor spreading, large igneous provinces) which is thought to have resulted in an enhanced input of biolimiting nutrient elements to seawater (Kerr, 1998; Larson and Erba, 1999; Sinton and Duncan, 1997), especially in the Pacific Ocean (Utsunomiya et al., 2007).
The highest sea level stand of the Phanerozoic, which was due to a larger area of relatively more buoyant oceanic lithosphere (Cogne et al., 2006), took place around the Cenomanian-Turonian boundary (Miller et al., 2005; M¨uller et al., 2008). Such a high sea level resulted in wider shelves where conditions for the production and preservation of or-ganic matter were favourable. Concomitantly, flooding of coastal areas may have delivered an additional small amount of nutrient elements to the ocean while at the same time trapping terrigenous clastics further inshore (Erbacher et al., 1996; Piper and Calvert, 2009; Sageman et al., 2003). Fur-thermore, a higher sea level stand must have led to an in-creased water depth in gateways connecting the North At-lantic Basin with the global ocean thus improving intermedi-ate wintermedi-ater flow to the more restricted North Atlantic.
Our regional model results are in agreement with the re-sults presented by Trabucho Alexandre et al. (2010) and show (Figs. 3–6) an inflow of Pacific water at intermediate depths moving along the southern margin of the North At-lantic while water from the Tethys flows at the surface in the opposite direction, i.e. towards the Pacific.
The present-day Atlantic Ocean is a meridional basin con-necting both polar regions. In the mid-Cretaceous, however, the North Atlantic was part of a tropical east-west seaway, the Tethys. Nevertheless, meridional overturning in the basin was still 18 Sv with the strongest overturning taking place be-tween 10 and 30◦N (Trabucho Alexandre et al., 2010). As a consequence of basin physiography and palaeogeography, zonal overturning in the North Atlantic was slightly stronger
than the average present-day North Atlantic meridional over-turning circulation (21 vs. 18.7 Sv; Cunningham et al., 2007). Therefore, even though a sluggish overturning is often pro-posed to be behind the development of anoxia during OAEs (Bralower and Thierstein, 1984; Ryan and Cita, 1977), mod-elling studies have shown this not to be the case and geo-chemical studies have shown stagnation to be antithetic to the development of anoxic/euxinic conditions (Meyer and Kump, 2008; Otto-Bliesner et al., 2002; Trabucho Alexan-dre et al., 2010). Our model confirms these previous studies by showing a stronger circulation in the North Atlantic than at present.
Pacific nutrient-rich intermediate water was transported towards the euphotic zone by upwelling in mesoscale ed-dies and within the broad upwelling zone along the southern margins of the North Atlantic Basin. The enhanced nutrient supply to the euphotic zone thus generated must have led to a sharp increase in primary productivity, which in turn pro-moted anoxic conditions in the sediments. Under such con-ditions, phosphorus regeneration, for instance, would have provided a positive feedback to the system and fueled fur-ther productivity in the euphotic zone (Ingall et al., 1993; van Cappellen and Ingall, 1994).
Northern North Atlantic surface water only gets a small amount of Pacific nutrient-rich water by upwelling, because most of the Pacific water flows east in the southern part of the North Atlantic Basin. This provides an explanation for the lower organic carbon content of sediments in the northern part of the basin with respect to the southern margins (Kuhnt and Wiedmann, 1995; Tissot et al., 1980).
A strong argument for the proposal that Pacific seawater fuelled black shale formation in the mid-Cretaceous North Atlantic is the agreement between known black shale occur-rences and modelled upwelling zones (Fig. 12). All localities with the highest TOC values are located in the modelled up-welling zones along the Gondwanan coasts where our model predicts the strongest upwelling of Pacific water.
4.2.2 Pre-OAE
Prior to OAE2, sea levels were relatively low (Miller et al., 2005), epicontinental seas were basically absent and peri-continental shelves were relatively narrow (Thiede, 1979). Organic-rich sediments were deposited only locally (e.g. De-merara Rise, Tarfaya) with TOC values far below OAE val-ues (≤10%) (e.g. Summerhayes, 1981). Our experiments (LOWSL and LOWSL-TET) show that the Tethyan inflow and zonal overturning rates decrease significantly as a con-sequence of a lower sea level stand, the exact decrease being determined by the depth of the PSoG.
30ºN
15ºN
0º WIS
OAE 2-related black shales organic-lean OAE 2
45ºN 60ºN
CAS
Modeled
and documented upwelling 962959
EAS
PSoG
144 137
97 540
417 635
391 1052 603 105
387
551 400 641 398
135 370
362 549
G 1276
386
367 1260
Fig. 12. High total organic carbon map. All localities with the
high-est total organic carbon (TOC) values are located in the modelled upwelling zones along the Gondwanan coasts where our model pre-dicts the strongest upwelling of Pacific water. Numbers indicate DSDP/ODP sites.
scenario the small shelves limit dense water formation and consequently upwelling is further decreased.
The decreased inflow of Pacific water (ca. 10 Sv), of which the majority is intermediate inflow, probably had a negative impact on nutrient supply to upwelling zones in the North Atlantic. The combination of decreased overturning and up-welling in the pre-OAE scenario thus led to less favourable conditions for the production and preservation of organic matter in marine sediments.
4.2.3 Post-OAE
The SATL experiment shows that the opening of the EAS, the timing of which is still a matter of discussion (Moulin et al., 2009, and references therein), leads to significant changes in the model patterns previously described here. The upwelling of water with a Pacific origin in the southern part of the North Atlantic Basin is disturbed and limited to a small area away from the South Atlantic inflow.
The increased upwelling along the North American coast caused by the northward push and deflection of deep water and Pacific inflow, respectively, which takes place when the EAS is open, should have caused an increase in organic mat-ter deposition on the easmat-tern North American shelf seafloor. Since this is not supported by geologic data for the OAE2 interval (Summerhayes, 1981; Tissot et al., 1980), a model with an open EAS does not seem to represent conditions dur-ing this interval.
The areas where upwelling persists in the model after the opening of the EAS correspond well to localities where black shale deposition continued across the Cenomanian-Turonian boundary. The La Luna Formation in Venezuela (Romero et al., 2003) and the lateral equivalent of the Plantagenet For-mation at Demerara Rise (ODP Leg 207, Berrocoso et al., 2008; Hardas and Mutterlose, 2006) are therefore likely to be the products of organic productivity driven by upwelling of nutrient-rich Pacific water well after OAE2 and the open-ing of the EAS.
In our model, the opening of the EAS does not result in a freshening of the North Atlantic as found in the global model study of Poulsen et al. (2001). Instead, basin-averaged salinity and temperature increase with respect to REF. The differences in the results between the global and regional model results are probably caused by significant differences in the gateway bathymetries used as well as the South At-lantic tracer composition.
In the open EAS scenario, the overturning in the North At-lantic is vigorous in both zonal and meridional components and extends downwards well below 4000 m depth. Water column anoxic conditions, let alone euxinic, are extremely difficult to generate under such conditions, as deep water is constantly supplied with new oxygen from the surface layers. Decreased primary productivity in combination with vigor-ous ocean circulation and upwelling of South Atlantic sea-water instead of Pacific seasea-water along the margins of the basin must have led to a decreased oxygen demand and to less organic matter deposition and preservation in these ar-eas.
5 Conclusions
A regional ocean circulation model for the North Atlantic basin during the Cenomanian-Turonian OAE2 has been de-veloped and can be compared with a global ocean circula-tion model for the same time interval, a Cenomanian CCSM3 run. Boundary and initial conditions used were also obtained from this global model. Tracer distribution, horizontal ve-locities and upwelling patterns in the two models are similar for a regional model configuration with connections to the global ocean through the CAS and PSoG. This similarity of results proves that a regional model can be used as a high res-olution tool next to global models for studying OAE2. The high resolution can be exploited when the upwelling patterns found are compared with known black shale occurrences. The match between upwelling and the black shale deposits found is a large step forward in the prediction of undiscov-ered deposits.
Different gateway geometries in the CAS and PSoG have little effect on tracer distribution in the North Atlantic, but do affect overturning and upwelling.
strength of overturning and supply of Pacific water. Together, these suggest a lower organic matter production and the ab-sence of organic-rich black shale deposition along most of the southern coasts.
The enhanced primary production during OAE2 could have been caused by an increased amount of available nu-trients of Pacific origin in the upwelling zones in the south part of the basin as confirmed by the regional model results.
The opening of the EAS interrupts the supply of nutrient-rich Pacific water to the South American and African coastal zones, decreasing the primary productivity. Furthermore, vigorous overturning supplies the deep basin with oxygen to prevent sustained anoxic conditions.
Supplementary material related to this article is available online at:
http://www.clim-past.net/7/277/2011/ cp-7-277-2011-supplement.pdf.
Acknowledgements. We thank Michael Kliphuis for providing us with the CCSM3 data and technical support, and W. W. Hay
and an anonymous referee for constructive comments. RPMT
is supported by the Netherlands Research Centre for Integrated Solid Earth Science (ISES). Computational resources for this work were provided by the Netherlands Research Centre for Integrated Solid Earth Science (ISES 3.2.5 High End Scientific Computation Resources). The figures have been prepared using GMT (Wessel and Smith, 1998).
Edited by: V. Brovkin
References
Barron, E. J. and Peterson, W. H.: The Cenozoic ocean circulation based on ocean General Circulation Model results, Palaeogeogr. Palaeocl., 83, 1–28, 1991.
Barron, E. J. and Washington, W. M.: The carbon cycle and
atmo-spheric CO2: Natural variations from Archean to present;
Pro-ceedings of the Chapman Conference on Natural Variations in Carbon Dioxide and the Carbon Cycle, Tarpon Springs, FL, 9– 13 January 1984, (A86-39426 18-46), chap. Warm Cretaceous
climates – High atmospheric CO2 as a plausible mechanism,
1985.
Berrocoso, A. J., MacLeod, K. G., Calvert, S. E., and Elorza, J.: Bottom water anoxia, inoceramid colonization, and ben-thopelagic coupling during black shale deposition on Demerara Rise (Late Cretaceous western tropical North Atlantic), Paleo-ceanography, 23(3), PA3212, doi:10.1029/2007PA001545, 2008. Bralower, T. J. and Thierstein, H. R.: Low productivity and slow deep-water circulation in mid-Cretaceous oceans, Geology, 12, 614–618, 1984.
Bryan, K.: A numerical method for the study of the circulation of the world ocean, J. Comput. Phys., 4, 347–376, 1969.
Bryan, K. and Cox, M. D.: A numerical investigation of the ocean circulation, Tellus, 1967.
Cogne, J. P., Humler, E., and Courtillot, V.: Mean age of
oceanic lithosphere drives eustatic sea-level change since Pangea breakup, Earth Planet. Sc. Lett., 245, 115–122, 2006.
Collins, W. D., Bitz, C. M., Blackmon, M. L., Bonan, G. B., Bretherton, C. S., Carton, J. A., Chang, P., Doney, S. C., Hack, J. J., Henderson, T. B., Kiehl, J. T., Large, W. G., McKenna, D. S., Santer, B. D., and Smith, R. D.: The Community Climate System Model Version 3 (CCSM3), J. Climate, 19, 2122–2143, 2006.
Cox, M. D.: A mathemathical model of the Indian Ocean, Deep-sea Research and Oceanographic Abstracts, 1970.
Cunningham, S. A., Kanzow, T., Rayner, D., Baringer, M. O., Johns, W. E., Marotzke, J., Longworth, H. R., Grant, E. M., Hirschi, J. J. M., Beal, L. M., Meinen, C. S., and Bry-den, H. L.: Temporal variability of the Atlantic meridional
overturning circulation at 26.5◦N, Science, 317, 935–938,
doi:10.1126/science.1141304, 2007.
Erbacher, J., Thurow, J., and Littke, R.: Evolution patterns of radi-olaria and organic matter variations: a new approach to identify sea-level changes in mid-Cretaceous pelagic environments, Ge-ology, 24, 499–502, 1996.
Fofonoff, N. P. and Millard, R. C.: Algorithms for computation of fundamental properties of seawater, Unesco Technical Papers in Marine Science, 44, 1983.
Friedrich, O.: Benthic foraminifera and their role to
deci-pher paleoenvironment during mid-Cretaceous Oceanic
Anoxic Events – the “anoxic benthic foraminifera”
para-dox, Revue de micropal´eontologie, 53(3), 175–192,
doi:10.1016/j.revmic.2009.06.001, 2010.
Friedrich, O. and Erbacher, J.: Benthic foraminiferal assemblages from Demarara Rise (ODP Leg 207, western tropical Atlantic): possible evidence for a progressive opening of the Equatorial At-lantic Gateway, Cretaceous Res., 27, 377–397, 2006.
Haines, K. and Wu, P.: GCM studies of intermediate and deep-waters in the Mediterranean, J. Mar. Syst., 18, 197–214, 1998. Handoh, I. C., Bigg, G. R., Jones, E. J. W., and Inoue, M.: An
ocean modeling study of the Cenomanian Atlantic: equatorial paleo-upwelling, organic-rich sediments and the consequences for a connection between the proto-North and South Atlantic, Geophys. Res. Lett., 26, 223–226, 1999.
Haq, B. U., Hardenbol, J., and Vail, P. R.: Chronology of fluctuating sea levels since the Triassic, Science, 235, 1156–1167, 1987. Hardas, P. and Mutterlose, J.: Calcareous nannofossil
biostratig-raphy of the Cenomanian/Turonian boundary interval of ODP Leg 207 at the Demerara Rise, Revue de micropal´eontologie, 49, 165–179, 2006.
Ingall, E. D., Bustin, R. M., and van Cappellen, P.: Influence of water column anoxia on the burial and preservation of carbon and phosphorus in marine shales, Geochim. Cosmochim. Acta, 57, 303–316, 1993.
Jeans, C. V., Long, D., Hall, M. A., Bland, D. J., and Cornford, C.: The geochemistry of the Plenus Marls at Dover, England: evi-dence of fluctuating oceanographic conditions and of glacial
con-trol during the development of the Cenomanian-Turonianδ13C
anomaly, Geol. Mag., 128, 603–632, 1991.