BGD
8, 10797–10821, 2011
A model study on the sensitivity of surface ocean CO2 pressure
P. Landsch ¨utzer et al.
Title Page
Abstract Introduction
Conclusions References
Tables Figures
◭ ◮
◭ ◮
Back Close
Full Screen / Esc
Printer-friendly Version
Interactive Discussion
Discussion
P
a
per
|
Dis
cussion
P
a
per
|
Discussion
P
a
per
|
Discussio
n
P
a
per
|
Biogeosciences Discuss., 8, 10797–10821, 2011 www.biogeosciences-discuss.net/8/10797/2011/ doi:10.5194/bgd-8-10797-2011
© Author(s) 2011. CC Attribution 3.0 License.
Biogeosciences Discussions
This discussion paper is/has been under review for the journal Biogeosciences (BG). Please refer to the corresponding final paper in BG if available.
A model study on the sensitivity of
surface ocean CO
2
pressure with
respect to the CO
2
gas exchange rate
P. Landsch ¨utzer1,*, J. F. Tjiputra1,2, K. Assmann4, and C. Heinze1,2,3
1
Geophysical Institute, University of Bergen, Bergen, Norway
2
Bjerknes Centre for Climate Research, Bergen, Norway
3
Uni Bjerknes Centre, Uni Research, Bergen, Norway
4
British Antarctic Survey, High Cross, Madingley Road, Cambridge, UK
*
now at: School of Environmental Sciences, University of East Anglia, Norwich, UK
Received: 3 October 2011 – Accepted: 20 October 2011 – Published: 8 November 2011
Correspondence to: P. Landsch ¨utzer (p.landschutzer@uea.ac.uk)
BGD
8, 10797–10821, 2011
A model study on the sensitivity of surface ocean CO2 pressure
P. Landsch ¨utzer et al.
Title Page
Abstract Introduction
Conclusions References
Tables Figures
◭ ◮
◭ ◮
Back Close
Full Screen / Esc
Printer-friendly Version
Interactive Discussion
Discussion
P
a
per
|
Dis
cussion
P
a
per
|
Discussion
P
a
per
|
Discussio
n
P
a
per
|
Abstract
Rising CO2concentrations in the atmosphere and a changing climate are expected to
alter the air-sea CO2flux through changes in the respective control factors for gas
ex-change. In this study we determine the sensitivity of the CO2fluxes on the gas transfer velocity using the MICOM-HAMOCC isopycnic carbon cycle model. The monthly
gen-5
erated MICOM-HAMOCC output data are suitable to investigate seasonal variabilities concerning the exchange of CO2. In a series of 3 sensitivity runs the wind dependent gas exchange rate is increased by 44 %, both in the northern and southern westerly regions, as well as in the equatorial area to investigate the effect of regional variations of the gas transfer rate on the air-sea fluxes and the distribution of the ocean surface
10
pCO2. For the period between 1948–2009, the results show that locally increasing gas transfer rates do not play an important role concerning the global uptake of carbon from the atmosphere. While effects on a global and annual scale are low, the regional and intra-annual variability shows remarkable variations in the gas fluxes and the surface pCO2. An accurate quantification of the variable gas transfer velocity therefore
pro-15
vides a potential source to enhance model predictions over small spatial and temporal scales and to successfully reconcile model results on surfacepCO2and air-sea CO2 fluxes with observations.
1 Introduction
Gas exchange is one of the important links between the ocean and the atmosphere
20
regarding biochemical cycles. It plays an important role for global climate in particu-lar with respect to atmospheric greenhouse gases. The ocean is an important carbon reservoir and a major sink for anthropogenic CO2which has been emitted to the atmo-sphere (Solomon et al., 2007). The exchange process is controlled by the gas concen-tration difference between the atmosphere and the ocean surface layer, while the gas
25
BGD
8, 10797–10821, 2011
A model study on the sensitivity of surface ocean CO2 pressure
P. Landsch ¨utzer et al.
Title Page
Abstract Introduction
Conclusions References
Tables Figures
◭ ◮
◭ ◮
Back Close
Full Screen / Esc
Printer-friendly Version
Interactive Discussion
Discussion
P
a
per
|
Dis
cussion
P
a
per
|
Discussion
P
a
per
|
Discussio
n
P
a
per
|
transfer velocity and the gas solubility. In addition to the shifts in sea surface temper-ature and the surface wind stress, past and future greenhouse gas emissions provide changes in the ocean gas uptake. Trenberth et al. (2007) note that the strength of the mid-latitude winds have increased at least since the 1970s, especially in December, January and February. Model studies of Fyfe and Saenko (2006) confirm the
strength-5
ening and polewards shift of the Southern Hemisphere wind stress in the 20th century and predict the continuation of this trend during in the 21st century. These variations in the wind pattern provide changes in the gas uptake due to the wind dependency of the gas transfer velocity across the water-air interface. Studies of Zickfeld et al. (2007) and Tjiputra et al. (2010) predict an increasing carbon uptake in the high latitude Southern
10
Hemisphere due to changes in the wind pattern and the resulting circulation changes. In contrast, a study by Le Qu ´er ´e et al. (2007) based on both forward and inverse anal-ysis methods estimate using synoptic atmospheric forcing that the Southern Ocean carbon uptake has weakened by 0.08 PgC per year per decade relative to the atmo-spheric increase of CO2. This is attributed to the changing winds between 1981 and
15
2004 and is estimated to further weaken the Southern Ocean uptake strength in the near future. A study of Gruber et al. (2009) shows that there remain large uncertain-ties in the Southern Ocean carbon flux estimates. The study of Tjiputra et al. (2010) and numerous model studies presented in Meehl et al. (2007) predict a weakening of the Atlantic Meridional Overturning Circulation, which leads to a reduction of the CO2
20
uptake in the North Atlantic, where according to Sabine et al. (2004) 23 % of the global anthropogenic carbon is stored. Observations suggest a decrease in the North Atlantic sink since 1990, linked to the phase changes in the North Atlantic Oscillation (Schuster and Watson, 2007; Watson et al., 2009).
Exploring the sensitivity of the carbon fluxes on the gas transfer rate can possibly
25
BGD
8, 10797–10821, 2011
A model study on the sensitivity of surface ocean CO2 pressure
P. Landsch ¨utzer et al.
Title Page
Abstract Introduction
Conclusions References
Tables Figures
◭ ◮
◭ ◮
Back Close
Full Screen / Esc
Printer-friendly Version
Interactive Discussion
Discussion
P
a
per
|
Dis
cussion
P
a
per
|
Discussion
P
a
per
|
Discussio
n
P
a
per
|
the role of the gas transfer rate coefficient in influencing the global and regional uptake of CO2without changes in the ocean circulation.
2 The MICOM-HAMOCC isopycnic ocean carbon cycle model
We employ a state-of-the-art global biogeochemical ocean general circulation model (BOGCM) for our study. The physical component of the model is the Miami Isopycnic
5
Coordinate Ocean Model based on the study by Bleck and Smith (1990) and Bleck et al. (1992). The current version of the model has been improved considerably as described in Bentsen et al. (2004) and Lohmann et al. (2009). The horizontal resolu-tion of the model is approximately 2.4×2.4◦ with 34 isopycnic layers. In addition, the model includes a single non-isopycnic surface mixed layer, which provides the linkage
10
between the atmospheric forcing and the ocean interior.
The ocean biogeochemistry model is the Hamburg Ocean Carbon Cycle (HAMOCC5) model. It is based on the original work of Maier-Reimer et al. (1993), which has been extensively improved and used in many studies (e.g., Six and Maier-Reimer, 1996; Aumont et al., 2003; Maier-Reimer et al., 2005). The current version
15
of the model contains an NPZD-type ecosystem model with multi-nutrient limitation on the phytoplankton growth formulation (Maier-Reimer et al., 2005). The surfacepCO2 in the model is computed from the prognostic variables temperature, salinity, pressure, dissolved inorganic carbon (DIC), and alkalinity.
The model was originally spun up for 950 yr (Assmann et al., 2010). While 600 yr
20
of the spin up were performed with a monthly NCEP-based climatology (Kalnay et al., 1996), another 350 yr spin up was performed with repeated passes of the NCEP Re-analysis 1950–1999 to obtain realistic sea-ice distributions, surface mixing and mixed layers. The model simulations were all restarted in 1948 from an initialization run starting in 1860 using NCEP atmospheric forcing of the year 1959, since no gridded
25
BGD
8, 10797–10821, 2011
A model study on the sensitivity of surface ocean CO2 pressure
P. Landsch ¨utzer et al.
Title Page
Abstract Introduction
Conclusions References
Tables Figures
◭ ◮
◭ ◮
Back Close
Full Screen / Esc
Printer-friendly Version
Interactive Discussion
Discussion
P
a
per
|
Dis
cussion
P
a
per
|
Discussion
P
a
per
|
Discussio
n
P
a
per
|
A more detailed model description as well as the evaluation of the model perfor-mance on a global scale is documented in Assmann et al. (2010). The model simu-lations performed in this study are forced by the monthly atmospheric fields from the NCEP reanalysis. For the air-sea CO2fluxes computation, observed atmospheric CO2
concentration from the Mauna Loa observatory in Hawaii is prescribed in the model.
5
Where available the monthly mean CO2and otherwise, the annual mean Mauna Loa
CO2data are used to provide the atmospheric CO2concentration.
Gas Exchange
The gas flux between the ocean and the atmosphere is driven by the concentration difference between the atmosphere and the ocean and can be written, using the partial
10
pressure difference of a gas as the thermodynamical driving force (Wanninkhof et al., 2009), as
FCO2=kw·SCO2·(pCOO2−pCOA2) (1)
where pCOA2 expresses the CO2 partial pressure in the atmosphere and pCOO2 the partial pressure in the ocean surface.SCO2 describes the solubility of CO2in seawater
15
and can be derived according to Weiss (1974) from temperature and salinity via
ln(SCO
2)=A1+A2·(100/T)+A3·ln(T/100)+s·[B1+B2·(T/100)+B3·(T/100)
2] (2)
whereT denotes the temperature of the sea surface, s describes the salinity of the seawater andA1−3andB1−3are constants for the calculation in molar units. During the
last decades several research projects focused on the formulation of the gas transfer
20
velocitykw. Deacon (1977) suggested in his formulation the transfer velocitykwto be a
function of the dimensionless Schmidt number (Sc), the numerical constant (β) factor and the friction velocity (u∗)
BGD
8, 10797–10821, 2011
A model study on the sensitivity of surface ocean CO2 pressure
P. Landsch ¨utzer et al.
Title Page
Abstract Introduction
Conclusions References
Tables Figures
◭ ◮
◭ ◮
Back Close
Full Screen / Esc
Printer-friendly Version
Interactive Discussion
Discussion
P
a
per
|
Dis
cussion
P
a
per
|
Discussion
P
a
per
|
Discussio
n
P
a
per
|
Previous research focused on the quantitatively correct parameterizations of the gas transfer velocity (Liss and Merlivat, 1986; Wanninkhof, 1992; Wanninkhof and McGillis, 1999; Nightingale et al., 2000; Sweeney et al., 2007), resulting in different relationships between the gas transfer velocity and the wind speed. For the air-sea gas exchange, the model uses the formulation of Wanninkhof (1992) suggesting a quadratic
relation-5
ship between the wind speed and kw. Furthermore, in ice covered areas, the gas
exchange is scaled down to the ice free parts of the grid cell (Maier-Reimer et al., 2005).
3 Sensitivity experiment: regional changes of the gas fluxes
The relations in Eqs. (2) and (3) suggest that the highest specific gas transfer rates
10
(ks=kw·SCO2) arise in low temperature and strong wind regions. To investigate the
effect of an increasing gas exchange rate on the total uptake of CO2, three different
regions as listed in Table 1 were chosen. In the regions we substantially change the gas transfer velocity, however, do not take into account any change in the general pattern of gas exchange variability. Such a simplification is justified here as we first of all want
15
to quantify the effect of a potential substantial change of the gas transfer on surface pCO2 in general. The gas transfer rate in the various domains (Table 1) is increased in seperate experiments by 44 % which is equivalent to a 20 % increase in the wind speed as the model uses a quadratic relationship between the wind speed and the gas transfer velocity. The regions between 40–60◦N and polewards of 40◦S were selected
20
because of their high specific gas transfer rates. The gas transfer was increased for the entire region polewards of 40◦S including the ice covered area polewards of 60◦S. The high specific gas transfer rates in these areas are caused by the influence of the strong westerly winds and the high gas solubilities due to the low sea surface temperatures. Besides the high specific gas transfer rates in these regions the air-sea disequilibrium
25
BGD
8, 10797–10821, 2011
A model study on the sensitivity of surface ocean CO2 pressure
P. Landsch ¨utzer et al.
Title Page
Abstract Introduction
Conclusions References
Tables Figures
◭ ◮
◭ ◮
Back Close
Full Screen / Esc
Printer-friendly Version
Interactive Discussion
Discussion
P
a
per
|
Dis
cussion
P
a
per
|
Discussion
P
a
per
|
Discussio
n
P
a
per
|
warmer equatorial waters and the air-sea disequilibrium identifying large parts to be outgassing areas.
All the sensitivity runs were examined with the same model settings as for the stan-dard run. To avoid changes in the ocean surface circulation, the wind field was left unchanged. The model integration time starts in 1948 and ends in 2009. To present
5
the results the year 2000 was chosen because of the available literature values from Takahashi et al. (2009) in that year to compare the total integrated carbon uptake.
4 Results
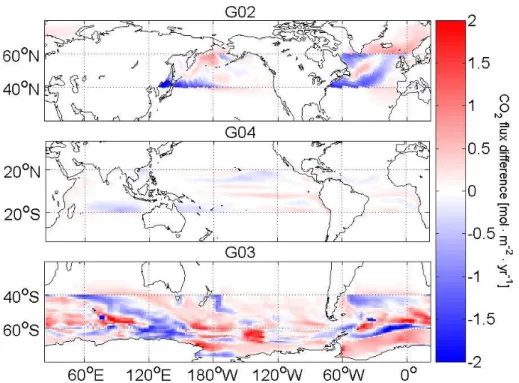
Annual mean CO2 flux differences for the reference year 2000 between the
sensitiv-ity experiments and the model standard run are shown in Fig. 1. The strongest flux
10
differences are in the northern and southern westerlies region where flux differences exceeding ±2 molC m−2yr−1 can be identified. In contrast the warm equatorial wa-ters show flux differences less than±0.5 molC m−2yr−1. Besides the differences in the experimental areas, changes in the carbon fluxes can likewise be discovered outside the experimental boarders. Water with higher carbon content gets transported by the
15
surface currents resulting in an adaptation of the surfacepCO2 and the resulting gas
fluxes outside the studied regions.
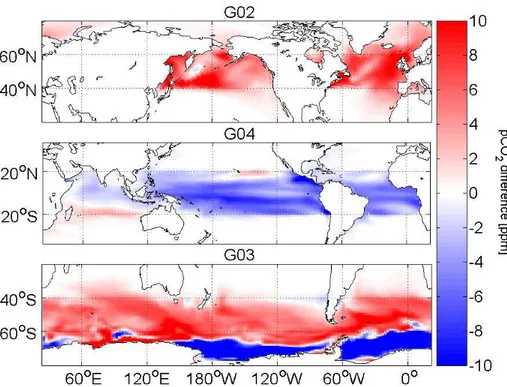
The increasing specific gas transfer rates influence the pCO2 concentration as
il-lustrated in Fig. 2. Changes in the surfacepCO2 result from modifications in the DIC
concentration due to local variations of the carbon fluxes. Figure 2 indicates increasing
20
partial pressures almost entirely in the uptake regions in the high latitudes and de-creasing partial pressures in the equatorial region. The faster gas exchange results in pCO2differences up to±10 ppm with the exception of the ice covered area of the high-est latitudes of the Southern Ocean. Assmann et al. (2010) point out that the sea-ice cover in the model is overestimated. Furthermore, the artificial highpCO2underneath
25
BGD
8, 10797–10821, 2011
A model study on the sensitivity of surface ocean CO2 pressure
P. Landsch ¨utzer et al.
Title Page
Abstract Introduction
Conclusions References
Tables Figures
◭ ◮
◭ ◮
Back Close
Full Screen / Esc
Printer-friendly Version
Interactive Discussion
Discussion
P
a
per
|
Dis
cussion
P
a
per
|
Discussion
P
a
per
|
Discussio
n
P
a
per
|
The effect of an enhanced gas transfer rate on the global integrated CO2 flux is visualized in Fig. 3. The net carbon uptake in the global ocean undergoes very little changes in all 3 scenarios compared to the standard run, varying mainly between ±0.1 PgC. Compared to the different scenarios experiment G03 shows stronger year-to-year variation caused by the ice covered area below 60◦S. A similar result can be
5
identified observing the globally integrated meanpCO2 difference between the runs,
which vary less than±2 ppm. Further analysis demonstrates that an increasing gas exchange rate does not simply show little effect on the global net uptake but has a notable effect on both the global upward and downward fluxes. Figure 4 illustrates the resulting fluxes plotted from 1990 onwards. Depending on the affected area the upward
10
and downward fluxes increase simultaneously. The resulting fluxes for the year 2000 are displayed in Table 2. This result comes as a no surprise as the increase of the gas exchange rate shows its effect on both in- and outgassing. More surprising is that the slope shows no difference between the runs. By increasing the exchange rate of a net outgassing area one would expect a faster increase in the upward fluxes than in the
15
downward fluxes. Instead, the lines only appear slightly shifted, leading to only small net differences between the runs.
To investigate the small annual differences an additional analysis for the year 2000 was performed on the intra-annual fluxes in the experimental regions. Figure 5 shows the monthly fluxes for the 3 experimental regions. The equatorial area shows a weak
20
seasonal variation and describes a source for atmospheric CO2throughout the entire
year, whereas both the high latitude regions are characterized by their intra-annual variability, but show a strong net uptake of CO2 integrated over the entire year. The strong seasonality in the high latitudes of the Southern Hemisphere mainly results from the seasonal variation of the sea-ice.
25
BGD
8, 10797–10821, 2011
A model study on the sensitivity of surface ocean CO2 pressure
P. Landsch ¨utzer et al.
Title Page
Abstract Introduction
Conclusions References
Tables Figures
◭ ◮
◭ ◮
Back Close
Full Screen / Esc
Printer-friendly Version
Interactive Discussion
Discussion
P
a
per
|
Dis
cussion
P
a
per
|
Discussion
P
a
per
|
Discussio
n
P
a
per
|
the months of July until September and May until August indicate an equally strong increase of the outgassing fluxes of CO2. The equatorial area shows generally less
variation. This outcome suggests that the intra-annual difference is related to thepCO2
variation shown in Fig. 2. The increasing gas transfer rate leads to a perturbation of the surfacepCO2 in relation to the standard run, leading to higher partial pressures
5
of CO2 in uptake areas and lower partial pressures in supersaturated areas. In the
high latitudes it results in less uptake or increased outgassing in months of low air-sea disequilibrium, whereas the effect of the increased gas transfer rate dominates in months where the air sea disequilibrium is high.
Integrating the monthly fluxes between 40–60◦N for both the model standard and the
10
sensitivity run G02 results in a net flux difference of−67 TgC for the year 2000, where −46 TgC is the contribution of the Atlantic and−21 TgC of the Pacific. This is more than twice as much as the−23 TgC calculated from Table 2 for the global ocean. The minus signs indicate more uptake by the ocean. These differences arise from the surface transport of water with high CO2 concentration outside the experimental domain of
15
artificially adjusted gas transfer velocities, where the gas exchange slows down due to a lower CO2disequilibrium (prescribed atmosphericpCO2 minus increasing ocean pCO2 outside the experimental domain) and unchanged gas transfer rate. A different
result can be identified in the Southern Ocean. The integrated carbon flux difference for the experimental region G03 between the standard run (−1406 TgC) and the sensitivity
20
run (−1344 TgC) is 62 TgC, hence, the increasing gas transfer rate leads to decreasing uptake in the year 2000. Figure 3 shows that this differs from year to year. Again, the identified flux deviates from the global net difference in Table 2, suggesting that transport of high CO2water equatorwards causes the global difference. Likewise, the
equatorial region from experiment G04 shows a net decrease in the outgassing flux of
25
−4 TgC in the year 2000 due to the increasing CO2partial pressure.
BGD
8, 10797–10821, 2011
A model study on the sensitivity of surface ocean CO2 pressure
P. Landsch ¨utzer et al.
Title Page
Abstract Introduction
Conclusions References
Tables Figures
◭ ◮
◭ ◮
Back Close
Full Screen / Esc
Printer-friendly Version
Interactive Discussion
Discussion
P
a
per
|
Dis
cussion
P
a
per
|
Discussion
P
a
per
|
Discussio
n
P
a
per
|
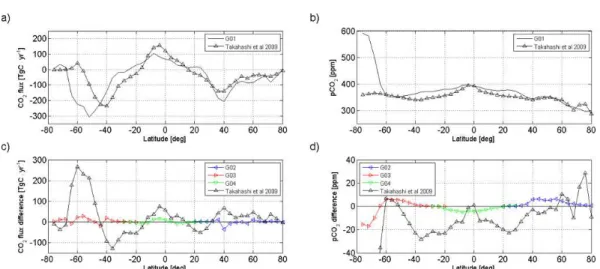
4×5◦grid boxes as presented for the climatology. Figure 6 shows the zonal averaged pCO2 and CO2 flux differences between the model runs compared to the Takahashi
et al. (2009) data. The results from the sensitivity runs relative to the model standard run are plotted only in those latitudes where they differ from the standard run.
While there is large disagreement between the model fluxes and the climatological
5
data in the Southern Hemisphere, differences in the Northern Hemisphere mainly do not exceed±50 TgC yr−1. Besides the good correlation between the fluxes northwards of 30◦S (R=0.88), the latitudes in the Southern Hemisphere southwards of 30◦S show a poor correlation (R=0.23) which slightly improves by the increasing gas exchange rate in experiment G03 (R=0.27). Figure 6 shows that bothpCO2and CO2flux minima
10
are shifted south relative to the observations and below 60◦S the ice cover causes the strongest disagreements. Therefore, in the following analysis, G03 is analyzed only between 40–60◦S. In addition to the small local improvements between the equator and 20◦S in experiment G04, Fig. 6 illustrates a remarkable deterioration resulting from experiment G02 at 40◦N due to the enhanced carbon fluxes. Beside the strongpCO2
15
difference in the ice covered area of the Southern Ocean the strongest disagreement between the model outputs and the climatology data lie in the mid latitudes in both hemispheres and the high latitudes in the Northern Hemisphere.
Stow et al. (2009) present a series of statistical tools to test the quality of the model output compared to observations. Some of these tools are used here to further
inves-20
tigate if the sensitivity runs improve the model prediction compared to the Takahashi et al. (2009) data for every zonal band. The results for the experimental areas are listed in Table 3. While the correlation coefficients between the CO2fluxes indicate that both
the model and the sensitivity runs presents the climatology well between 40–60◦N and between 20◦S–20◦N, the correlation is negative between 40–60◦S due to the
south-25
BGD
8, 10797–10821, 2011
A model study on the sensitivity of surface ocean CO2 pressure
P. Landsch ¨utzer et al.
Title Page
Abstract Introduction
Conclusions References
Tables Figures
◭ ◮
◭ ◮
Back Close
Full Screen / Esc
Printer-friendly Version
Interactive Discussion
Discussion
P
a
per
|
Dis
cussion
P
a
per
|
Discussion
P
a
per
|
Discussio
n
P
a
per
|
the accuracy of the model prediction relative to the average of the observations (Stow et al., 2009). A value close to 1 indicates a close match between model data and ob-servations, whereas a value close to 0 states that the model predicts the observations not better than the mean of the observations. Negative values indicate that the obser-vational mean would be a better predictor than the model output. Table 3 shows that
5
model predictions are best between 20◦S–20◦N and get improved by the sensitivity ex-periment. A slight improvement can be discovered from experiment G03, whereas the results show that the observation mean is a much better predictor between 40–60◦S due to the shift in the biology. The area 40–60◦N is slightly better represented by the mean of the observations, whereas sensitivity run G02 shows a strong degradation of
10
the model performance. The last result illustrates the potential to improve, or in this example rather deteriorate, the model prediction by adjusting the gas transfer rate in certain regions.
ThepCO2RMSE and the AAE again show the largest model data discrepancies 40– 60◦S, whilst the errors are in general smaller between 40–60◦N than between 20◦S–
15
20◦N. The MEF indicates the same trend as before for the CO2flux. Experiment G03
and G04 represent the observation patterns better than the standard run, whereas G02 leads to a degradation of the model performance. Figure 6 reveals that both climatological CO2fluxes andpCO2data are lower between 40–60◦N compared to the
standard run, whilst the increasing gas exchange rate in G02 leads to increasing fluxes
20
and partial pressures relative to the model standard run. A decreasing gas transfer rate in contrast would potentionally lead to a better model performance in experiment region G02. Additionally, due to the stronger inter-annual variation of the CO2 fluxes in G03 the model mean results from the years 1995 to 2004 were compared to the Takahashi climatology (not shown). The results indicate that averaged over the 10 yr
25
period the G03 outputs show higher uptake fluxes compared to the model standard run and therefore do not improve the model performance for the CO2 fluxes, whereas the
BGD
8, 10797–10821, 2011
A model study on the sensitivity of surface ocean CO2 pressure
P. Landsch ¨utzer et al.
Title Page
Abstract Introduction
Conclusions References
Tables Figures
◭ ◮
◭ ◮
Back Close
Full Screen / Esc
Printer-friendly Version
Interactive Discussion
Discussion
P
a
per
|
Dis
cussion
P
a
per
|
Discussion
P
a
per
|
Discussio
n
P
a
per
|
5 Conclusions
The model results indicate that regional changes in the gas transfer rate, as they are applied in this study, do not strongly effect the global air-sea net flux of CO2 on the
long run. The enhanced regional gas fluxes lead to a perturbation in the surfacepCO2 relative to the model standard run, resulting in a negative flux feedback as the
con-5
centration difference between the atmosphere and the ocean is the driving factor for the gas exchange. We therefore conclude that changes in the ocean carbon uptake are dominated by the changes in the ocean circulation rather than the gas transfer coefficient.
A comparison with climatology data from Takahashi et al. (2009) shows that an
in-10
creasing gas transfer rate of 44 % in the experimental areas does not substantion-ally improve the model predictions in the higher latitudes of the Southern Hemisphere where the model data and the climatology data are poorly correlated. The results in the equatorial area and the Northern Hemisphere instead do support the idea that lo-cal enhancements of the gas transfer rate have the potential to improve lolo-cal model
15
predictions by adjusting the gas transfer rate.
Furthermore, the study on the intra-annual variation between the sensitivity runs sug-gests that enhancements, some of them which are not considered in this study, could improve the local model performance relative to climatology data. Wanninkhof et al. (2009) suggest the gas exchange to be affected by naturally occurring surfactants, rain
20
and bubble effects. An estimation of Woolf (1997) suggests a bubble contribution of 30 % on the global gas transfer velocity. Local model prediction results would undoubt-edly benefit from including these effects.
This means, that after all, more detailed descriptions of variations in gas transfer velocities may have to be taken into account in advanced data assimilation schemes
25
for parameter optimisations in biogeochemical ocean models. An omission of these descriptions may still result in acceptable global CO2uptake rates, but other processes
BGD
8, 10797–10821, 2011
A model study on the sensitivity of surface ocean CO2 pressure
P. Landsch ¨utzer et al.
Title Page
Abstract Introduction
Conclusions References
Tables Figures
◭ ◮
◭ ◮
Back Close
Full Screen / Esc
Printer-friendly Version
Interactive Discussion
Discussion
P
a
per
|
Dis
cussion
P
a
per
|
Discussion
P
a
per
|
Discussio
n
P
a
per
|
Acknowledgements. Supercomputer CPU time through NOTUR (Norwegian Metacenter for Computational Science) project nn2980k and file storage through NorStore (Norwegian Storage Infrastructure) project ns2980k, which made this study possible, are gratefully acknowledged. The research leading to these results has received funding from the European Community’s Seventh Framework Programme (FP7/2007-2013) under grant agreement no. 238366. This
5
study was co-sponsored by the EU FP7 project COMBINE (grant agreement no. 226520) and the EU FP7 coordination action COCOS (grant agreement no. 212196).
References
Assmann, K. M., Bentsen, M., Segschneider, J., and Heinze, C.: An isopycnic ocean carbon cycle model, Geosci. Model Dev., 3, 143–167, doi:10.5194/gmd-3-143-2010, 2010. 10800,
10
10801, 10803, 10806
Aumont, O., Maier-Reimer, E., Blain, S., and Monfray, P.: An ecosystem model of the global ocean including Fe, Si, P colimitations, Global Biochem. Cy., 17, 23, doi:10.1029/2001GB001745, 2003. 10800
Bentsen, M., Drange, H., Furevik, T., and Zhou, T.: Simulated variability of the Atlantic
merid-15
ional overturning circulation, Clim. Dynam., 22, 701–721, 2004. 10800
Bleck, R. and Smith, L. T.: A wind driven Isopycnic Coordinate Model of the North and Equa-torial Atlantic Ocean. 1 Model Development and Supporting Experiments, J. Geophys. Res., 95, 3273–3285, 1990. 10800
Bleck, R., Rooth, C., Hu, D., and Smith, L. T.: Salinity-driven Thermocline Transients in a
20
Wind- and Thermohaline-forced Isopycnic oordinate Model in the North Atlantic, J. Phys. Oceanogr., 22, 1486–1505, 1992. 10800
Deacon, E. L.: Gas transfer to and across an air-water interface, Tellus, 29, 363–374, doi:10.1111/j.2153-3490.1977.tb00746.x, 1977. 10801
Friedlingstein, P., Cox, P., Betts, R., Bopp, L., von Bloh, W., Brovkin, V., Cadule, P., Doney, S.,
25
Eby, M., Fung, I., Bala, G., John, J., Jones, C., Joos, F., Kato, T., Kawamiya, M., Knorr, W., Lindsay, K., Matthews, H. D., Raddatz, T., Rayner, P., Reick, C., Roeckner, E., Schnitzler, K.-G., Schnur, R., Strassmann, K., Weaver, A. J., Yoshikawa, C., and Zeng, N.: ClimateCarbon Cycle Feedback Analysis: Results from the C4MIP Model Intercomparison, J. Climate, 19, 3337–3353, doi:10.1175/JCLI3800.1, 2006. 10799
BGD
8, 10797–10821, 2011
A model study on the sensitivity of surface ocean CO2 pressure
P. Landsch ¨utzer et al.
Title Page
Abstract Introduction
Conclusions References
Tables Figures
◭ ◮
◭ ◮
Back Close
Full Screen / Esc
Printer-friendly Version
Interactive Discussion
Discussion
P
a
per
|
Dis
cussion
P
a
per
|
Discussion
P
a
per
|
Discussio
n
P
a
per
|
Fyfe, J. C. and Saenko, O. A.: Simulated changes in the extratropical Southern Hemisphere winds and currents, Geophys. Res. Lett., 33, L06701, doi:10.1029/2005GL025332, 2006. 10799
Gruber, N., Gloor, M., Mikaloff Fletcher, S. E., Doney, S. C., Dutkiewicz, S., Follows, M. J., Gerber, M., Jacobson, A. R., Joos, F., Lindsay, K., Menemenlis, D., Mouchet, A., M ¨uller, S. A.,
5
Sarmiento, J. L., and Takahashi, T.: Oceanic sources, sinks, and transport of atmospheric CO2, Global Biochem. Cy., 23, GB1005, doi:10.1029/2008GB003349, 2009. 10799
Kalnay, E., Kanamitsu, M., Kistler, R., Collins, W., Deaven, D., Gandin, L., Iredell, M., Saha, S., White, G., Woollen, J., Zhu, Y., Chelliah, M., Ebisuzaki, W., Higgins, W., Janowiak, J., Mo, K. C., Ropelewski, C., Wang, J., Leetmaa, A., Reynolds, R., Jenne, R., and Joseph,
10
D.: The NCEP/NCAR 40-year reanalysis project, B. Am. Meteorol. Soc., 77, 437–471, doi:10.1175/1520-0477(1996)077<0437:TNYRP>2.0.CO;2, 1996. 10800
Le Qu ´er ´e, C., R ¨odenbeck, C., Buitenhuis, E. T., Conway, T. J., Langenfelds, R., Gomez, A., Labuschagne, C., Ramonet, M., Nakazawa, T., Metzl, N., Gillett, N., and Heimann, M.: Sat-uration of the Southern Ocean CO2 Sink Due to Recent Climate Change, Science, 316,
15
1735–1738, doi:10.1126/science.1136188, 2007. 10799
Liss, P. S. and Merlivat, L.: The Role of Air-Sea Exchange in Geochemical Cycling, chap. Air-sea gas exchange rates: Introduction and Synthesis, D. Reidel, Dordrecht, Netherlands, 113–127, 1986. 10802
Lohmann, K., Drange, H., and Bentsen, M.: Response of the North Atlantic subpolar
20
gyre to persistent North Atlantic Oscillation like forcing, Clim. Dynam., 32, 273–285, doi:10.1007/s00382-008-0467-6, 2009. 10800
Maier-Reimer, E., Mikolajewicz, U., and Hasselmann, K.: Mean circulation of the Hamburg LSG OGCM and its sensitivity to the thermohaline surface forcing, J. Phys. Oceanogr., 23, 731–757, 1993. 10800
25
Maier-Reimer, E., Kriest, I., Segscheider, J., and Wetzel, P.: The HAMburg Ocean Carbon Cicle model HAMOCC5.1 – Technical description release 1.1, in: Berichte zur Erdsystem-forschung, Tech. Rep. 14, Max Planck Institute for Meteorology, Hamburg, Germany, 2005. 10800, 10802
Meehl, G. A., Stocker, T. F., Collins, W. D., Friedlingstein, P., Gaye, A. T., Gregory, J. M.,
30
BGD
8, 10797–10821, 2011
A model study on the sensitivity of surface ocean CO2 pressure
P. Landsch ¨utzer et al.
Title Page
Abstract Introduction
Conclusions References
Tables Figures
◭ ◮
◭ ◮
Back Close
Full Screen / Esc
Printer-friendly Version
Interactive Discussion
Discussion
P
a
per
|
Dis
cussion
P
a
per
|
Discussion
P
a
per
|
Discussio
n
P
a
per
|
Change, chap. Global Climate Projections, Cambridge University Press, Cambridge, United Kingdom and New York, NY, USA, 2007. 10799
Nightingale, P., Malin, G., Law, C., Watson, A., Liss, P., Liddicoat, M., Boutin, J., and Upstill-Goddard, R.: In situ evaluation of air-sea gas exchange parameterizations using novel con-servative and volatile tracers, Global Biochem. Cy., 14, 373–387, 2000. 10802
5
Sabine, C. L., Feely, R. A., Gruber, N., Key, R. M., Lee, K., Bullister, J. L., Wanninkhof, R., Wong, C. S., Wallace, D. W. R., Tilbrook, B., Millero, F. J., Peng, T.-H., Kozyr, A., Ono, T., and Rios, A. F.: The oceanic sink for anthropogenic CO2, Science, 305, 367–371, doi:10.1126/science.1097403, 2004. 10799
Schuster, U. and Watson, A. J.: A variable and decreasing sink for atrmospheric CO2 in the
10
North Atlantic, J. Geophys. Res., 112, C11006, doi:10.1029/2006JC003941, 2007. 10799 Six, K. D. and Maier-Reimer, E.: Effects of plankton dynamics on seasonal carbon
fluxes in an ocean general circulation model, Global Biochem. Cy., 10, 559–583, doi:10.1029/96GB02561, 1996. 10800
Solomon, S., Quin, D., Manning, M., Chen, Z., Marquis, M., Averyt, K. B., Tignor, M., and
15
Miller, H. L. (Eds.): Climate Change 2007. Contribution of Working Group I to the Fourth as-sessment Report of the Intergovernmental Panel on Climate Change, Cambridge University Press, Cambridge, United Kingdom and New York, NY, USA, 2007. 10798
Stow, C. A., Jolliff, J., McGillicuddy, D. J., Doney, S. C., Allen, J. I., Friedrichs, M. A. M., Rose, K. A., and Wallhead, P.: Skill assessment for coupled biological/physical models of marine
20
systems, J. Marine Syst., 76, 4–15, doi:10.1016/j.jmarsys.2008.03.011, 2009. 10806, 10807 Sweeney, C., Gloor, E., Jacobson, A. R., Key, R. M., McKinley, G., Sarmiento, J. L., and Wan-ninkhof, R.: Constraining global air-sea gas exchange for CO2with recent bomb 14C mea-surements, Global Biochem. Cy., 21, GB2015, doi:10.1029/2006GB002784, 2007. 10802 Takahashi, T., Sutherland, S. C., Wanninkhof, R., Sweeney, C., Feely, R. A., Chipman, D. W.,
25
Hales, B., Friederich, G., Chavez, F., Sabine, C., Watson, A. J., Bakker, D. C. E., Schuster, U., Metzl, N., Yoshikawa-Inoue, H., Ishii, M., Midorikawa, T., Nojiri, Y., K ¨ortzinger, A., Steinhoff, T., Hoppema, M., Olafson, J., Arnarson, T. S., Tilbrook, B., Johannessen, T., Olsen, A., Bellerby, R., Wong, C. S., Delille, B., Bates, N. R., and de Baar, H. J. W.: Climatological mean and decadal change in surface oceanpCO2, and net sea-air CO2flux over the global
30
oceans, Deep-Sea Res. Pt. II, 56, 554–577, 2009. 10803, 10805, 10806, 10808, 10814, 10815, 10821
BGD
8, 10797–10821, 2011
A model study on the sensitivity of surface ocean CO2 pressure
P. Landsch ¨utzer et al.
Title Page
Abstract Introduction
Conclusions References
Tables Figures
◭ ◮
◭ ◮
Back Close
Full Screen / Esc
Printer-friendly Version
Interactive Discussion
Discussion
P
a
per
|
Dis
cussion
P
a
per
|
Discussion
P
a
per
|
Discussio
n
P
a
per
|
ocean, Ocean Sci., 6, 605–614, doi:10.5194/os-6-605-2010, 2010. 10799
Trenberth, K. E., Jones, P. D., Ambenje, P., Bojariu, R., Easterling, D., Klein Tank, A., Parker, D., Rahimzadeh, F., Renwick, J. A., Rusticucci, M., Soden, B., and Zhai, P.: Climate Change 2007: The Physical Science Basis. Contribution of Working Group I to the Fourth Assess-ment Report of the IntergovernAssess-mental Panel on Climate Change, chap. Observations:
Sur-5
face and Atmospheric Climate Change, Cambridge University Press, Cambridge, United Kingdom and New York, NY, USA, 2007. 10799
Wanninkhof, R.: Relation between wind speed and gas exchange over the ocean, J. Geophys. Res., 97, 7373–7383, 1992. 10802
Wanninkhof, R. and McGillis, W.: A cubic relationship between air-sea CO2exchange and wind
10
speed, Geophys. Res. Lett., 26, 1889–1892, 1999. 10802
Wanninkhof, R., Asher, W. E., Ho, D., Sweeney, C., and McGillis, W. R.: Advances in Quanti-fying Air-Sea Gas Exchange and Environmental Forcing, Annual Review of Marine Science, 1, 213–244, doi:10.1146/annurev.marine.010908.163742, 2009. 10801, 10808
Watson, A. J., Schuster, U., Bakker, D. C. E., Bates, N. R., Corbi `ere, A., Gonz ´alez-D ´avila, M.,
15
Friedrich, T., Hauck, J., Heinze, C., Johannessen, T., K ¨ortzinger, A., Metzl, N., Olafsson, J., Olsen, A., Oschlies, A., Padin, X. A., Pfeil, B., Santana-Casiano, J. M., Steinhoff, T., Tel-szewski, M., Rios, A. F., Wallace, D. W. R., and Wanninkhof, R.: Tracking the variable North Atlantic sink for atmospheric CO2, Science, 326, 1391–3, doi:10.1126/science.1177394, 2009. 10799
20
Weiss, R. F.: Carbon Dioxide in Water and Seawater: The Solubility of a Non-Ideal Gas, Mar. Chem., 2, 203–215, 1974. 10801
Woolf, D. K.: The Sea Surface and Global Change, chap. Bubbles and their role in gas ex-change, Cambridge University Press, 173–205, 1997. 10808
Zickfeld, K., Fyfe, J. C., Saenko, O. A., Eby, M., and Weaver, A. J.: Response of the global
25
BGD
8, 10797–10821, 2011
A model study on the sensitivity of surface ocean CO2 pressure
P. Landsch ¨utzer et al.
Title Page
Abstract Introduction
Conclusions References
Tables Figures
◭ ◮
◭ ◮
Back Close
Full Screen / Esc
Printer-friendly Version
Interactive Discussion
Discussion
P
a
per
|
Dis
cussion
P
a
per
|
Discussion
P
a
per
|
Discussio
n
P
a
per
|
Table 1.Description of the model simulations performed in this work.
Experiment Description
G01 Model standard run
BGD
8, 10797–10821, 2011
A model study on the sensitivity of surface ocean CO2 pressure
P. Landsch ¨utzer et al.
Title Page
Abstract Introduction
Conclusions References
Tables Figures
◭ ◮
◭ ◮
Back Close
Full Screen / Esc
Printer-friendly Version
Interactive Discussion
Discussion
P
a
per
|
Dis
cussion
P
a
per
|
Discussion
P
a
per
|
Discussio
n
P
a
per
|
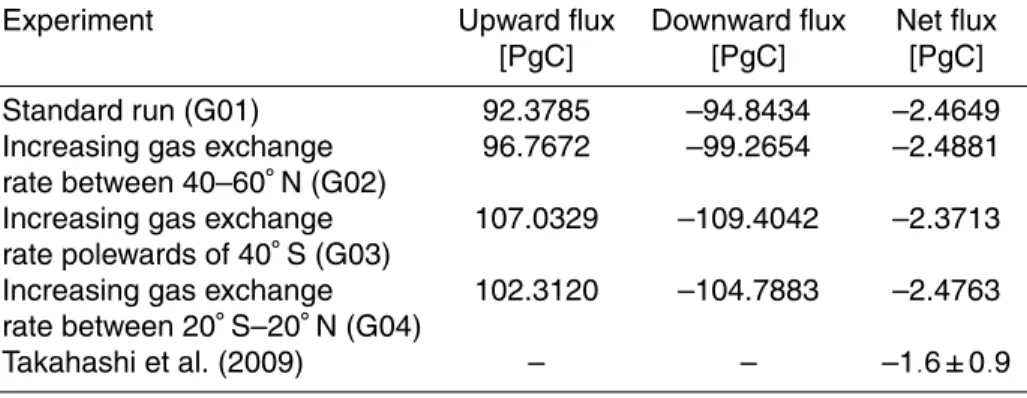
Table 2. Summary of the global integrated carbon fluxes for the reference year 2000 and the best estimation from Takahashi et al. (2009).
Experiment Upward flux Downward flux Net flux [PgC] [PgC] [PgC]
Standard run (G01) 92.3785 –94.8434 –2.4649 Increasing gas exchange 96.7672 –99.2654 –2.4881 rate between 40–60◦N (G02)
Increasing gas exchange 107.0329 –109.4042 –2.3713 rate polewards of 40◦S (G03)
Increasing gas exchange 102.3120 –104.7883 –2.4763 rate between 20◦S–20◦N (G04)
BGD
8, 10797–10821, 2011
A model study on the sensitivity of surface ocean CO2 pressure
P. Landsch ¨utzer et al.
Title Page
Abstract Introduction
Conclusions References
Tables Figures
◭ ◮
◭ ◮
Back Close
Full Screen / Esc
Printer-friendly Version
Interactive Discussion
Discussion
P
a
per
|
Dis
cussion
P
a
per
|
Discussion
P
a
per
|
Discussio
n
P
a
per
|
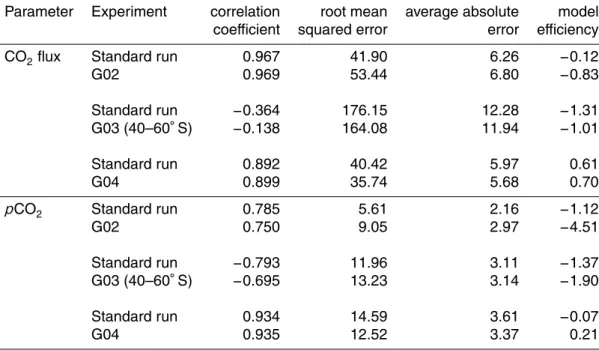
Table 3.Statistical analysis for the reference year 2000 compared to the best estimation from Takahashi et al. (2009) in the experimental areas for both zonally averaged CO2fluxes and the
pCO2.
Parameter Experiment correlation root mean average absolute model coefficient squared error error efficiency
CO2flux Standard run 0.967 41.90 6.26 −0.12 G02 0.969 53.44 6.80 −0.83
Standard run −0.364 176.15 12.28 −1.31 G03 (40–60◦S) −0.138 164.08 11.94 −1.01
Standard run 0.892 40.42 5.97 0.61 G04 0.899 35.74 5.68 0.70
pCO2 Standard run 0.785 5.61 2.16 −1.12 G02 0.750 9.05 2.97 −4.51
Standard run −0.793 11.96 3.11 −1.37 G03 (40–60◦S)
−0.695 13.23 3.14 −1.90
BGD
8, 10797–10821, 2011
A model study on the sensitivity of surface ocean CO2 pressure
P. Landsch ¨utzer et al.
Title Page
Abstract Introduction
Conclusions References
Tables Figures
◭ ◮
◭ ◮
Back Close
Full Screen / Esc
Printer-friendly Version
Interactive Discussion
Discussion
P
a
per
|
Dis
cussion
P
a
per
|
Discussion
P
a
per
|
Discussio
n
P
a
per
|
Fig. 1. Annual surface flux difference between the model standard run and the G02 sce-nario (top), the G04 scesce-nario (middle) and the G03 scesce-nario (bottom) in molC m−2
yr−1
BGD
8, 10797–10821, 2011
A model study on the sensitivity of surface ocean CO2 pressure
P. Landsch ¨utzer et al.
Title Page
Abstract Introduction
Conclusions References
Tables Figures
◭ ◮
◭ ◮
Back Close
Full Screen / Esc
Printer-friendly Version
Interactive Discussion
Discussion
P
a
per
|
Dis
cussion
P
a
per
|
Discussion
P
a
per
|
Discussio
n
P
a
per
|
Fig. 3. Annual global integrated sea-air carbon flux simulated by G01 in PgC yr−1
(top). Dif-ference in the global integrated carbon flux between the sensitivity scenarios and the model standard run in PgC yr−1
BGD
8, 10797–10821, 2011
A model study on the sensitivity of surface ocean CO2 pressure
P. Landsch ¨utzer et al.
Title Page
Abstract Introduction
Conclusions References
Tables Figures
◭ ◮
◭ ◮
Back Close
Full Screen / Esc
Printer-friendly Version
Interactive Discussion
Discussion
P
a
per
|
Dis
cussion
P
a
per
|
Discussion
P
a
per
|
Discussio
n
P
a
per
|
Fig. 5. Monthly mean (for the year 2000) CO2fluxes for the model standard run between 40– 60◦N (top), 20◦S–20◦N (middle) and south of 40◦S (bottom) in TgC mon−1
BGD
8, 10797–10821, 2011
A model study on the sensitivity of surface ocean CO2 pressure
P. Landsch ¨utzer et al.
Title Page
Abstract Introduction
Conclusions References
Tables Figures
◭ ◮
◭ ◮
Back Close
Full Screen / Esc
Printer-friendly Version
Interactive Discussion
Discussion
P
a
per
|
Dis
cussion
P
a
per
|
Discussion
P
a
per
|
Discussio
n
P
a
per
|