R E S E A R C H A R T I C L E
Open Access
Strategies for genotype imputation in
composite beef cattle
Tatiane C. S. Chud
1, Ricardo V. Ventura
3,4, Flavio S. Schenkel
4, Roberto Carvalheiro
2, Marcos E. Buzanskas
1,
Jaqueline O. Rosa
1, Maurício de Alvarenga Mudadu
5, Marcos Vinicius G. B. da Silva
6, Fabiana B. Mokry
7,
Cintia R. Marcondes
5, Luciana C. A. Regitano
5and Danísio P. Munari
1*Abstract
Background:Genotype imputation has been used to increase genomic information, allow more animals in genome-wide analyses, and reduce genotyping costs. In Brazilian beef cattle production, many animals are resulting from crossbreeding and such an event may alter linkage disequilibrium patterns. Thus, the challenge is to obtain accurately imputed genotypes in crossbred animals. The objective of this study was to evaluate the best fitting and most accurate imputation strategy on the MA genetic group (the progeny of a Charolais sire mated with crossbred Canchim X Zebu cows) and Canchim cattle. The data set contained 400 animals (born between 1999 and 2005) genotyped with the Illumina BovineHD panel. Imputation accuracy of genotypes from the Illumina-Bovine3K (3K), Illumina-BovineLD (6K), GeneSeek-Genomic-Profiler (GGP) BeefLD (GGP9K), GGP-IndicusLD (GGP20Ki), Illumina-BovineSNP50 (50K), GGP-IndicusHD (GGP75Ki), and GGP-BeefHD (GGP80K) to Illumina-BovineHD (HD) SNP panels were investigated. Seven scenarios for reference and target populations were tested; the animals were grouped according with birth year (S1), genetic groups (S2 and S3), genetic groups and birth year (S4 and S5), gender (S6), and gender and birth year (S7). Analyses were performed using FImpute and BEAGLE software and computation run-time was recorded. Genotype imputation accuracy was measured by concordance rate (CR) and allelic R square (R2).
Results: The highest imputation accuracy scenario consisted of a reference population with males and females and a target population with young females. Among the SNP panels in the tested scenarios, from the 50K, GGP75Ki and GGP80K were the most adequate to impute to HD in Canchim cattle. FImpute reduced computation run-time to impute genotypes from 20 to 100 times when compared to BEAGLE.
Conclusion: The genotyping panels possessing at least 50 thousands markers are suitable for genotype imputation to HD with acceptable accuracy. The FImpute algorithm demonstrated a higher efficiency of imputed markers, especially in lower density panels. These considerations may assist to increase genotypic information, reduce genotyping costs, and aid in genomic selection evaluations in crossbred animals.
Keywords: Canchim breed, Crossbred cattle, Genomic data, Low-density panel, Single nucleotide polymorphism
* Correspondence:[email protected]
1Departamento de Ciências Exatas, UNESP - Univ Estadual Paulista “Júlio de Mesquita Filho”, Jaboticabal, SP, Brazil
Full list of author information is available at the end of the article
Background
The recent implementation of genomic selection in cattle breeding programs has allowed the rate of genetic pro-gress to increase, especially in the dairy industry [1]. Selec-tion based on genetic markers requires a large number of genotyped individuals and thousands of single nucleotide polymorphisms (SNP) scattered throughout the genome [2]. The improvement in accuracy of genomic selection in beef cattle, which often includes data from different breeds and crossbred animals, depends on conservation of link-age disequilibrium, consistency of the linklink-age phase be-tween QTL (quantitative trait loci) and genetic markers across breeds, and similarity of QTL effects between breeds [3, 4].
In some dairy breeds, animals have been genotyped with 50,000 SNPs (50K). However, the 50K panel generally does not increase genomic selection accuracy in combined data from different breeds [1, 5]. According to de Roos et al. [6], more than 300,000 informative SNPs are required to detect conserved linkage disequilibrium and allow multi-breed genomic selection. High-density panels have higher coverage of SNPs in smaller genomic distances, greater linkage disequilibrium and conserved linkage disequilib-rium across breeds, and are better for genomic selection and genome-wide association studies in beef cattle and crossbred animals [3, 7]. However, genotyping with high-density panels remains costly and can limit the number of animals used in genomic studies. An alternative that re-duces these costs is genotype imputation [8, 9].
Genotype imputation is a method that allows for infer-ring the missing marker genotypes from individuals geno-typed with low and medium density (LD) panels by using information from a reference population genotyped with high-density panels [10, 11]. This makes it possible to in-crease the genomic information and predict missing geno-types [7, 12], reduce genotyping costs and intensify genomic selection [13, 14], and combine data from differ-ent breeds [11, 15].
Imputation methods may be based on family informa-tion (using pedigree), thus using Mendelian segregainforma-tion rules and linkage to predict genotypes, and/or on population-based information; wherein genotypes are predicted by means of linkage disequilibrium observed between markers in the reference population [11]. Im-putation accuracy is influenced by several factors such as population structure, reference population size, the number of SNPs in the LD panel, marker frequency, re-latedness between the reference and the target popula-tions, and the imputation tools [10, 16, 17].
In Brazil, crossbreeding schemes have been used to de-velop composite breeds such as the Canchim, originating from alternate crosses between Charolais (Bos taurus taurus) and Zebu breeds (Bos taurus indicus) [18]. Gener-ally, the final genetic composition of Canchim animals is
62.5 % Charolais and 37.5 % Zebu; however, different pro-portions of Charolais/Zebu genes may be present in Can-chim animals due to the various mating schemes which have been used to expand the genetic base for this breed [19]. One such scheme produces the“MA”genetic group, which is the progeny of a Charolais sire mated with cross-bred Canchim X Zebu cows. The expected proportion of genes for MA is approximately 65.6 % Charolais and 34.4 % Zebu.
In Brazilian beef cattle production, many animals result from crossbreeding between or within Bos taurus taurus
andBos taurus indicus. Therefore, genotype imputation in crossbred animals remains a challenging task; leading to the development of methodologies and imputation strat-egies that can maximize accuracy in the population of interest. The objective of this study was to evaluate the best fitting and most accurate imputation strategy for the MA genetic group and Canchim cattle.
Methods
Ethics statement
This study had the approval of the Embrapa Southeast Livestock Ethical Committee of Animal Use (CEUA-CPPSE), under protocol number 02/2009.
Data set and genotype
The genomic database used in this study was pro-vided by the Brazilian Corporation of Agricultural Re-search (Embrapa), located in São Carlos, SP, Brazil.
Four hundred animals, born between 1999 and 2005, were genotyped with the BovineHD BeadChip (Illumina, Inc., San Diego, CA) panel, consisting of 786,799 SNPs distributed throughout the genome. There were 205 females and 195 males in the data set. Approximately half of the animals (194) were from Embrapa, originating from 17 different bulls; 186 were Canchim and 8 were MA. The remaining animals were from farms located in São Paulo (38 Canchim and 9 MA) and Goiás (60 Canchim and 97 MA animals) states, and 1 Canchim bull and 1
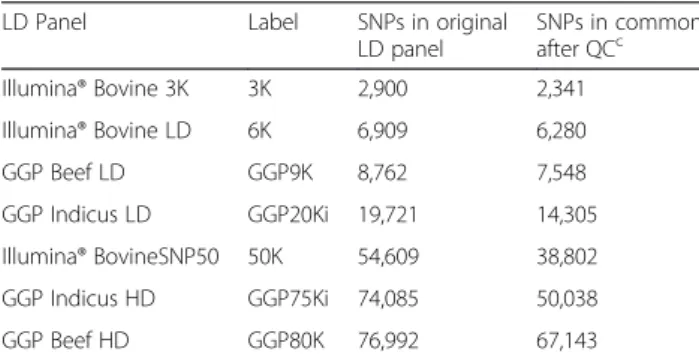
Table 1Number of SNPs in common between LDapanel and the HDbpanel
LD Panel Label SNPs in original LD panel
SNPs in common after QCc Illumina® Bovine 3K 3K 2,900 2,341
Illumina® Bovine LD 6K 6,909 6,280
GGP Beef LD GGP9K 8,762 7,548
GGP Indicus LD GGP20Ki 19,721 14,305
Illumina® BovineSNP50 50K 54,609 38,802
GGP Indicus HD GGP75Ki 74,085 50,038
GGP Beef HD GGP80K 76,992 67,143
a
Charolais bull that were parents of 7 and 14 geno-typed individuals, respectively.
The pedigree relationship matrix of these animals consisted of 4,095 animals and the average inbreeding was equal to 0.02, calculated by the CFC program [20]. The Canchim animals were progeny from 40 Canchim bulls and presented an average relatedness of 0.005, while the MA animals were progeny from 10 Charolais bulls, and presented an average related-ness of 0.018.
The average linkage disequilibrium between adjacent markers in the original HD panel (Additional file 1) was calculated using the SNPPLD software [21], with r2as the linkage disequilibrium measure [22].
Data quality control
Only the autosomal chromosomes and SNPs with known positions in the UMD_3.1 bovine assembly map [23] were considered. Genotype quality control (QC) excluded SNPs with a call rate lower than 0.90, SNPs with deviations from the Hardy-Weinberg equi-librium (p < 10−6) as calculated by means of the Fish-er’s Exact Test, SNPs with proportion of expected heterozygous higher than 0.85 [24], and SNPs with minor allele frequency (MAF) lower than 0.0025. For the QC of the samples, animals with a call rate lower than 0.90 were excluded from analysis. The final file contained 396 animals and 616,565 SNPs.
Low and medium density SNP panels
The low and medium density panels were created by masking SNPs originally present in the Illumina®
BovineHD SNP panel by selecting the markers in common with the Illumina® Bovine3K (3K), Illumina® BovineLD (6K), GeneSeek® Genomic Profiler (GGP) Beef LD (GGP9K), GGP Indicus LD (GGP20Ki), Illu-mina® BovineSNP50 version 2 (50K), GGP Indicus HD (GGP75Ki), and GGP Beef HD (GGP80K) (Table 1). The number of SNPs that remained after QC for the GGP75Ki (for indicine breeds) and GGP80K (for tau-rine breeds) may reflect the genetic composition of Canchim, because as previously mentioned, the contri-bution of the Charolais breed (taurine) is higher than the Zebu.
Genotype imputation
According to the possible situations, seven scenarios for reference and target populations were tested in order to identify the scenario that fit our data set and, as an extension, for composite beef cattle breeds
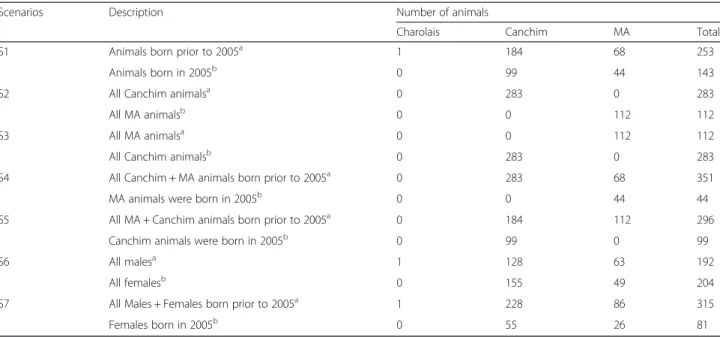
Table 2Description of imputation scenarios and number of animals in referenceaand targetbpopulation
Scenarios Description Number of animals
Charolais Canchim MA Total
S1 Animals born prior to 2005a 1 184 68 253
Animals born in 2005b 0 99 44 143
S2 All Canchim animalsa 0 283 0 283
All MA animalsb 0 0 112 112
S3 All MA animalsa 0 0 112 112
All Canchim animalsb 0 283 0 283
S4 All Canchim + MA animals born prior to 2005a 0 283 68 351
MA animals were born in 2005b 0 0 44 44
S5 All MA + Canchim animals born prior to 2005a 0 184 112 296
Canchim animals were born in 2005b 0 99 0 99
S6 All malesa 1 128 63 192
All femalesb 0 155 49 204
S7 All Males + Females born prior to 2005a 1 228 86 315
Females born in 2005b 0 55 26 81
aReference population;bTarget Population
Table 3Genomic relationship statistics between reference population and target population
Scenariosa Genomic Relationship
Minimum Mean Maximum
S1 0.023 0.198 0.390
S2 0.010 0.050 0.220
S3 0.003 0.040 0.225
S4 0.028 0.193 0.330
S5 0.050 0.198 0.390
S6 0.090 0.210 0.409
S7 0.108 0.228 0.390
a
(Table 2). Briefly, animals were grouped in scenarios considering birth year (S1), genetic groups (S2 and S3), genetic groups and birth year (S4 and S5), gender (S6), and gender and birth year (S7).
The population genotype imputation was imple-mented using the FImpute v2.2 [25] and BEAGLE v3.3.2 software [26]. We used population-based im-putation for both programs. The imim-putation accuracy was calculated by means of two criteria:
i. Concordance rate (CR) - The imputed markers were compared with the actual markers present in the original HD panel, and thus the proportion of ge-notypes that were imputed correctly or erroneously was calculated. The concordance rate represents the proportion of correctly imputed genotypes.
ii. Allelic r-squared correlation (allelic R2) - The allelic R2is determined by the square of the correlation between the allele dosage of the most likely imputed genotype and the allele dosage of the true genotype [26].
The effect of genetic relatedness between the valid-ation and reference animals (Table 3) on imputvalid-ation ac-curacy was assessed by regressing the concordance rate on the maximum genomic relationship between each animal in the validation set and all the animals in the reference set [27]. The average genomic relationship (G) was calculated according to VanRaden [28]:
G¼ MM
0
X
2pið1−piÞ
ð1Þ
in whichMis the incidence matrix of markers whose el-ements in the ith column are 0-2pi, 1-2pi, and 2-2pi for
genotypes AA, AB and BB, respectively;M’is the trans-pose of the incidence matrix; and pi is the frequency of
allele B in theithmarker.
Results and discussion
Imputation accuracy
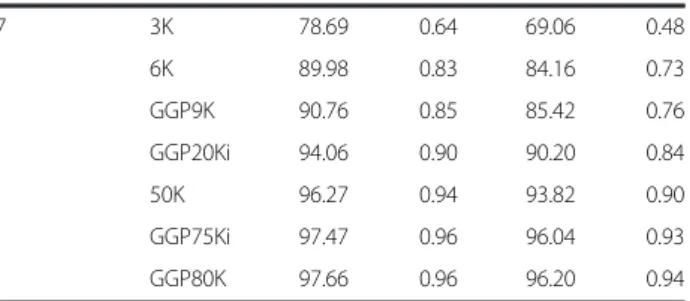
When the Flmpute software was used, the overall average imputation accuracy from LD to HD by concordance rate
Table 4Imputation accuracy from low-density panel to high-density panel using FImpute and BEAGLE software Scenariosa LD
panel
FImpute BEAGLE
CR%b R2c CR%b R2c
S1 3K 75.70 0.59 66.27 0.44
6K 87.72 0.79 80.79 0.68
GGP9K 88.64 0.81 82.19 0.70
GGP20Ki 92.43 0.87 87.50 0.71
50K 95.20 0.92 92.14 0.87
GGP75Ki 96.68 0.94 95.03 0.92
GGP80K 96.96 0.95 95.26 0.92
S2 3K 62.86 0.37 59.73 0.33
6K 76.17 0.58 72.23 0.58
GGP9K 77.54 0.61 73.78 0.55
GGP20Ki 83.61 0.71 79.75 0.65
50K 89.55 0.82 86.66 0.77
GGP75Ki 92.48 0.87 90.85 0.84
GGP80K 93.24 0.88 91.51 0.85
S3 3K 60.21 0.33 54.83 0.25
6K 71.46 0.51 63.00 0.38
GGP9K 72.93 0.54 64.15 0.40
GGP20Ki 79.19 0.65 69.91 0.49
50K 85.92 0.76 79.95 0.66
GGP75Ki 89.54 0.82 85.79 0.76
GGP80K 90.60 0.84 87.35 0.79
S4 3K 72.75 0.53 64.55 0.40
6K 85.17 0.74 79.32 0.65
GGP9K 86.12 0.76 80.85 0.67
GGP20Ki 90.60 0.84 86.55 0.77
50K 94.12 0.90 91.24 0.85
GGP75Ki 95.94 0.93 94.36 0.90
GGP80K 96.28 0.93 94.53 0.91
S5 3K 77.74 0.62 68.57 0.47
6K 89.84 0.83 83.86 0.73
GGP9K 90.67 0.84 85.23 0.75
GGP20Ki 94.15 0.94 90.23 0.84
50K 96.36 0.90 93.90 0.90
GGP75Ki 97.55 0.96 96.10 0.94
GGP80K 97.74 0.96 96.30 0.94
S6 3K 76.52 0.60 65.80 0.43
6K 88.71 0.81 80.35 0.67
GGP9K 89.56 0.82 81.71 0.70
GGP20Ki 93.13 0.88 87.33 0.80
50K 95.60 0.93 92.23 0.87
GGP75Ki 96.98 0.95 95.25 0.92
GGP80K 97.19 0.95 95.40 0.92
Table 4Imputation accuracy from low-density panel to high-density panel using FImpute and BEAGLE software
(Continued)
S7 3K 78.69 0.64 69.06 0.48
6K 89.98 0.83 84.16 0.73
GGP9K 90.76 0.85 85.42 0.76
GGP20Ki 94.06 0.90 90.20 0.84
50K 96.27 0.94 93.82 0.90
GGP75Ki 97.47 0.96 96.04 0.93
GGP80K 97.66 0.96 96.20 0.94
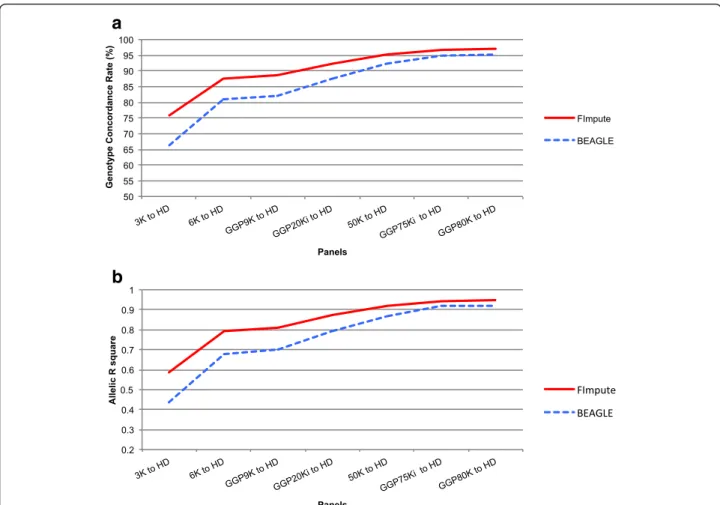
ranged from 60 to 98 %; and by the allelic R2 measure ranged from 0.33 to 0.96 (Table 4; Fig. 1). Using the BEA-GLE software, the overall average imputation accuracy ranged from 55 to 96 % by CR and from 0.25 to 0.94 by the allelic R2 (Table 4). We found that when the CR is high, the allelic R2value approaches this rate. The allelic R2value is smaller than the CR because this method has no relationship to MAF [7, 29, 30].
Ventura et al. [13], who imputed genotypes from 6K to 50K in Canadian crossbreed beef cattle, found overall average concordance rates ranging from 54 to 97 % (using FImpute) and from 54 to 96 % (using BEAGLE). Piccoli et al. [31] found results similar to ours when studying Brazilian Braford and Hereford beef cattle and imputing from various low-density panels to HD. Carvalheiro et al. [9], working with Nelore animals, found concordance rates of 97 and 99 % when using the GGP20Ki and GGP75Ki for genotype imputation to the HD panel. The imput-ation accuracy is lower in beef cattle populimput-ations than in dairy cattle populations due limited number of ani-mals in the genotyped reference population, the larger
number of effective ancestors, and the lower related-ness between reference and target populations [3].
The average gain in the CR from the GGP75Ki and GGP80K SNP panels to the HD panel, when com-pared to the 3K to HD, was 24 % for FImpute and 29 % for BEAGLE. The rate of correctly imputed geno-types increased as the number of SNP markers present in each of the LD panels increased (Fig. 1). The prediction of haplotypes and the linkage disequilibrium between markers are affected when the genotyping panel is com-posed by few SNPs; thus, the density of the tested LD panel is an important factor affecting imputation accuracy [10, 32]. Studies have shown that the accuracy of the pre-dicted genomic value decreases with increasing imput-ation error rates [33, 34]. Furthermore imputimput-ation errors can lead to bias in predicting breeding values [35, 36].
The most suitable LD panels were the 50K,
GGP80K, and GGP75Ki, because they had the highest imputation accuracy for genotype imputation in Can-chim cattle. Although the GGP75Ki and GGP80K panels have been developed for Bos taurus indicus
and Bos taurus taurus, respectively, and they have
a
b
Fig. 1Genotype concordance rate using FImpute (a) and BEAGLE (b) software for all scenarios tested. S1: animals born prior to 2005 in reference
different markers, no differences in the average im-putation accuracy were observed. As the Canchim is a composite breed, we can suggest that this result re-flects the genetic background from both Taurine and Indicine breeds.
Target population individuals presenting a higher average relatedness to the reference population had higher concordance rates. We observed a curvilinear
increase (p < 0.01) in the concordance rate when the relatedness between reference and target individuals increased (Fig. 2). The imputation accuracy from lower-density panels (3K, 6K, GGP9K, GGP20Ki) to HD was affected by the low relatedness between ref-erence individuals and target individuals; while the imputation accuracy from higher-density panels (50K, GGP75Ki, GGP80K) to HD had better results. Zhang
a
c
e
f
g
b
d
Fig. 2Average relationship between reference and target population. Figure 2 shows average relationship between reference and target
and Druet [37] and Carvalheiro et al. [9] obtained re-sults similar to ours and found better imputation ac-curacy from lower-density panels to HD in related individuals.
Because there is a different coverage of SNPs per chromosome, the panels showed different imputation errors per chromosome (Fig. 3). Chromosome 27 showed the lowest imputation accuracy from 50K to GGP80K panels to HD, while in the GGP75Ki panel,
chromosome 13 had the lowest imputation accuracy. In the 50K and GGP80K panels, chromosome 13 had a greater number of SNPs (1330 SNPs and 2202 SNPs, respectively) compared to the GGP75Ki panel (1273 SNPs), providing further information for haplo-type inferences. In addition, chromosome 13 showed lower average linkage disequilibrium between adjacent markers for the HD panel (S1 Table). Imputation dif-ferences may occur due to the difficulties in correctly
a
b
c
Fig. 3Genotype concordance rate by chromosome using FImpute and BEAGLE software. Considering individuals grouped by birth year (S1) from
imputing the initial and end regions of chromosomes [31], consequently shorter chromosomes presented less accurately imputed alleles. Pausch et al. [17], im-puting from 50K to 777K SNP panel in Fleckvieh cat-tle, found higher and lower accuracies on BTA1 and on BTA25, respectively. Moreover, low imputation ac-curacies on chromosomes can be due to mapping er-rors [38].
Scenarios of reference and target populations for genotype imputation
In practical terms and for future applications, sce-nario S1 (Table 2) was suggested as the most appro-priate for genomic studies in Canchim cattle, because the reference population includes older animals, while younger animals are included in the target population. The concordance rate from 50K, GGP75Ki and GGP80K to HD (Table 4) was acceptable for scenario S1 (overall average 95.2 %). Thus, young Canchim candidates could be genotyped with low-density panels (50K, GGP75Ki and, GGP80K), thereby reducing costs and
enabling the breeding programs to include genotype data for genomic selection.
The imputation accuracy when using Canchim ani-mals as the reference population and MA aniani-mals as the target population (S2) was better than the oppos-ite situation (S3). Using a larger number of individuals in the reference population could aid in estimating more reliable haplotypes [10, 13, 34] and therefore present better imputation accuracy. Another important issue was that scenarios S2 and S3 had the lowest average re-latedness (0.05 and 0.04 respectively) between reference and target populations (Table 3). Thus, in order to in-crease imputation accuracy, it is important to maintain the relatedness between reference and target popula-tions [3].
Scenario S5 presented the highest CR. The possible reasons for this result were that S5 presents a bal-anced number of Canchim and MA animals in the reference population, a high number of animals in the reference population, both males and females were in-cluded in the reference and target population, the ref-erence population considered varied ages, and the
a
b
Fig. 4Concordance Rate (a) and Allelic R-square (b) using FImpute and BEAGLE software. Considering the scenario S1 (individuals grouped by
mean genomic relatedness was the third highest. Des-pite of a very similar construction, the S4 imputation accuracy was lower than scenario S5. The main differ-ence between both scenarios was the mean genomic relatedness between reference and target population.
The gender division (scenarios S6 and S7) showed that the imputation of female genotypes could be car-ried out using only the males in a reference popula-tion. Scenarios S6 and S7 had the highest mean genomic relatedness between reference and target populations, which may have contributed to the im-putation accuracy. Genotype imim-putation using females genotyped with low-density panels could be an appro-priate strategy for large-scale female selection [39].
FImpute versus BEAGLE
FImpute demonstrated better imputation performance, especially for low-density panels (3K, 6K, GGP9K, and GGP20Ki) (Fig. 4). Moreover, low gains in imput-ation accuracy for 50K, GGP75Ki and GGP80K were observed. The FImpute algorithm reduces imputation error because it uses overlapping windows to identify long identity-by-descent segments, which facilitates the identification of haplotypes in panels with few markers. The BEAGLE software was developed for human populations and requires more complex algo-rithms due to population structure, as well as greater computational demand for haplotype construction. In our study, FImpute software reduced run-time from 20 to 100 times when compared to BEAGLE software. The issue of computational demand is very important due to the increasing number of animals being geno-typed. Ventura et al. [13] reported run-time reduc-tions of 13 to 52 times for genotype imputation when FImpute was compared to BEAGLE. Although imput-ation has great advantages, large-scale computimput-ational resources are required and imputation accuracy must be evaluated.
Conclusion
Low-density panels possessing at least 50 thousands markers (50K, GGP80K, and GGP75Ki) are suitable for genotype imputation to HD with acceptable ac-curacy. Canchim and MA animals from both sexes should be considered in the reference population. The scenario with the MA and Canchim animals born prior to 2005 in the reference population and the young Canchim animals in the target population was the best fit-ting to our data; however, it would be more practical to genotype young males and females with low-density panels (50K, GGP75Ki, and GGP80K) as the target lation, and maintain older animals in the reference popu-lation (S1). The FImpute algorithm demonstrated higher efficiency of imputed markers (best accuracy
and lowest run-time), especially in lower density panels (3K, 6K, GGP9K, and GGP20Ki). These con-siderations may assist in increasing genotypic infor-mation, decrease the run-time of analyses, reduce genotyping costs, and aid in genomic selection evalu-ations in Canchim cattle.
Availability of supporting data
The genomic data used in this study is available upon request from Dr. Luciana Correia de Almeida Regitano (Embrapa Livestock Southeast - Rodovia Washington Luiz, km 234, São Carlos, São Paulo, 13560–970, Brazil, Tel: 55 16 3411–5600).
Additional file
Additional file 1:Average linkage disequilibrium (r2) by
chromosome between adjacent markers.
Abbreviations
3K:Illumina-Bovine3K SNP panel; 6K: Illumina-BovineLD SNP panel; GGP: GeneSeek Genomic Profiler SNP panel; GGP9K: GeneSeek Genomic Profiler BeefLD SNP panel; GGP20Ki: GeneSeek Genomic Profiler IndicusLD SNP panel; 50K: Illumina-BovineSNP50 SNP panel; GGP75Ki: GeneSeek Genomic Profiler IndicusHD SNP panel; GGP80K: GeneSeek Genomic Profiler BeefHD SNP panel; HD: Illumina-BovineHD SNP panel; S1: Scenario 1: animals were grouped considering birth year; S2: Scenario 2: animals were grouped considering genetic groups; S3: Scenario 3: animals were grouped considering genetic groups; S4: Scenario 4: animals were grouped considering genetic groups and birth year; S5: Scenario 5: animals were grouped considering genetic groups and birth year; S6: Scenario 6: animals were grouped considering gender (S6); S7: Scenario 7: animals were grouped considering gender and birth year; CR: Concordance rate; R2: Allelic R square; SNP: Single nucleotide polymorphisms; QTL: Quantitative trait loci; LD: Low and medium density panels; MA: Progeny of a Charolais sire mated with crossbred Canchim X Zebu cows; r2: Linkage disequilibrium measure; QC: Quality control; MAF: Minor allele frequency; G: Average genomic relationship.
Competing interests
The authors declare that they have no competing interests.
Authors’contributions
TCSC: data analysis, results interpretation and discussion, figure compositions, and manuscript writing and revision. RVV, FSS, RC: analysis tools, results interpretation and discussion. MEB, JOR: results
interpretation and manuscript writing and revision. MAM, MVGBS, FBM, CRM, LCAR: experimental design, interpretation, and manuscript revision. DPM: results interpretation, discussion and manuscript revision. All authors read and approved the final manuscript.
Acknowledgements
Author details
1Departamento de Ciências Exatas, UNESP - Univ Estadual Paulista “Júlio de Mesquita Filho”, Jaboticabal, SP, Brazil.2Departamento de Zootecnia, UNESP - Univ Estadual Paulista“Júlio de Mesquita Filho”, Jaboticabal, SP, Brazil.3Beef Improvement Opportunities, Guelph, ON, Canada.4University of Guelph, Guelph, ON, Canada.5Embrapa Southeast Livestock - Brazilian Corporation of Agricultural Research, São Carlos, SP, Brazil.6Embrapa Dairy Cattle - Brazilian Corporation of Agricultural Research, Juiz de Fora, MG, Brazil. 7Department of Genetics and Evolution, Federal University of São Carlos, São
Carlos, SP, Brazil.
Received: 9 March 2015 Accepted: 9 July 2015
References
1. Hayes BJ, Bowman PJ, Chamberlain AJ, Goddard ME. Invited review: Genomic selection in dairy cattle: progress and challenges. J Dairy Sci. 2009;92:433–43.
2. Meuwissen THE, Hayes BJ, Goddard ME. Prediction of total genetic value using genome-wide dense marker maps. Genetics. 2001;157:1819–29.
3. Hozé C, Fouilloux M-N, Venot E, Guillaume F, Dassonneville R, Fritz S, et al. High-density marker imputation accuracy in sixteen French cattle breeds. Genet Sel Evol. 2013;45:33.
4. Moghaddar N, Swan AA, Van der Werf J. Comparing genomic prediction accuracy from purebred, crossbred and combined purebred and crossbred reference populations in sheep. Genet Sel Evol. 2014;46:58.
5. Kachman SD, Spanger ML, Bennett GL, Hanford KJ, Kuehn LA, Snelling WM, et al. Comparison of molecular breeding values based on within and across-breed training in beef cattle. Genet Sel Evol. 2013;45:30. 6. De Roos APW, Hayes BJ, Spelman RJ, Goddard ME. Linkage
disequilibrium and persistence of phase in Holstein-Friesian, Jersey and Angus cattle. Genetics. 2008;179:1503–12.
7. Ma P, Brondum RF, Zhang Q, Lund MS, Su G. Comparison of different methods for imputing genome-wide marker genotypes in Swedish and Finnish Red Cattle. J Dairy Sci. 2013;96:4666–77.
8. Johnston J, Kistemaker G. Success rate of imputation using different imputation approaches. In : Canadian Dairy Network. 2011. https:// www.cdn.ca/Articles/GEBAPR2011/Success%20rate%20of%20imputation% 20-%20Jarmila%20Johnston.pdf. Accessed 20 Dec 2014.
9. Carvalheiro R, Boison SA, Neves HHR, Sargolzaei M, Schenkel FS, Utsunomiya YT, et al. Accuracy of genotype imputation in Nelore cattle. Genet Sel Evol. 2014;46:69.
10. Howie BN, Donnelly P, Marchini J. A flexible and accurate genotype imputation method for the next generation of genome-wide association studies. Plos Genet. 2009; doi:10.1186/gb-2009-10-4-r42 11. Hayes BJ, Bowman PJ, Daetwyler HD, Kijas JW, Van der Werf JHJ.
Accuracy of genotype imputation in sheep breeds. Anim Genet. 2012;43:72–80.
12. Marchini J, Howie B. Genotype imputation for genome-wide association studies. Nat Rev Genet. 2010;11:499–511.
13. Ventura RV, Lu D, Schenkel FS, Wang Z, Li C, Miller SP. Impact of reference population on accuracy of imputation from 6K to 50K single nucleotide polymorphism chips in purebred and crossbreed beef cattle. J Anim Sci. 2014;92:1433–44.
14. Boichard D, Chung H, Dassonneville R, David X, Eggen A, Fritz S, et al. Design of a bovine low-density SNP array optimized for imputation. Plos One. 2012; doi: 10.1371/journal.pone.0034130.
15. Larmer SG, Sargolzaei M, Schenkel FS. Extent of linkage disequilibrium, consistency of gametic phase, and imputation accuracy within and across Canadian dairy breeds. J Dairy Sci. 2014;97:3128–41. 16. Dassonneville R, Brondum RF, Druet T, Fritz S, Guillaume F,
Guldbrandtsen B, et al. Effect of imputing markers from a low-density chip on the reliability of genomic breeding values in Holstein populations. J Dairy Sci. 2011;94:3679–86.
17. Pausch H, Aigner B, Emmerling R, Edel C, Götz K-U, Fries R. Imputation of high-density genotypes in the Fleckvieh cattle population. Genet Sel Evol. 2013;45:3.
18. Alencar MM. Bovino - Raça Canchim: Origem E Desenvolvimento. Embrapa-DMU: Brasília; 1988.
19. Andrade PC, Grossi DA, Paz CCP, Alencar MM, Regitano LCA, Munari DP. Association of an insulin-like growth factor 1 gene microsatellite with phenotypic variation and estimated breeding values of growth traits in Canchim cattle. Anim Genet. 2008;39:480–5.
20. Sargolzaei M, Iwaisaki H, Colleau J. CFC: A Tool for Monitoring Genetic Diversity. In: 8th World Congress of Genetics Appied to Livestock Production. 2006. p. 27–8.
21. Sargolzaei M, Schenkel FS, Jansen GB, Schaeffer LR. Extent of linkage disequilibrium in Holstein cattle in North America. J Dairy Sci. 2008;91:2106–017.
22. Hill WG, Robertson A. Linkage disequilibrium in finite populations. Theor Appl Genet. 1968;38:226–31.
23. Zimin A V, Delcher AL, Florea L, Kelley DR, Schatz MC, Puiu D, Hanrahan F, Pertea G, Van Tassell CP, Sonstegard TS, Marçais G, Roberts M, Subramanian P, Yorke JA, Salzberg SL. A whole-genome assembly of the domestic cow, Bos taurus. Genome Biol. 2009; doi:
10.1186/gb-2009-10-4-r42.
24. Turner S, Armstrong LL, Bradford Y, Carlson CS, Dana C, Crenshaw AT, et al. Quality control procedures for genome wide association studies. Curr Proc Hum Genet. 2011;68:1–24.
25. Sargolzaei M, Chesnais JP, Schenkel FS. A new approach for efficient genotype imputation using information from relatives. BMC Genomics. 2014;15:478.
26. Browning BL, Browning SR. A unified approach to genotype imputation and haplotype-phase inference for large data sets of trios and unrelated individuals. Am J Hum Genet. 2009;84:210–23. 27. Daetwyler HD, Calus MPL, Pong-Wong R, de Los CG, Hickey JM.
Genomic prediction in animals and plants: Simulation of data, validation, reporting, and benchmarking. Genetics. 2013;193:347–65. 28. VanRaden PM. Efficient methods to compute genomic predictions.
show [?A3B2 show $6#?] J Dairy Sci. 2008;91:4414–23.
29. Hickey JM, Kinghorn BP, Tier B, Van der Werf JHJ, Cleveland MA. A phasing and imputation method for pedigreed populations that results in a single-stage genomic evaluation. Genet Sel Evol. 2012;44:9. 30. Calus MPL, Bouwman AC, Hickey JM, Veerkamp RF, Mulder HA.
Evaluation of measures of correctness of genotype imputation in the context of genomic prediction: a review of livestock applications. Animal. 2014;8:1743–53.
31. Piccoli ML, Braccini J, Cardoso FF, Sargolzaei M, Larmer SG, Schenkel FS. Accuracy of genome-wide imputation in Braford and Hereford beef cattle. BMC Genet. 2014;15:157.
32. Hickey JM, Crossa J, Babu R, de los Campos G. Factors Affecting the Accuracy of Genotype Imputation in Populations from Several Maize Breeding Programs. Crop Sci. 2012;52:654–63.
33. Mulder HA, Calus MPL, Druet T, Schrooten C. Imputation of genotypes with low-density chips and its effect on reliability of direct genomic values in Dutch Holstein cattle. J Dairy Sci. 2012;95:876–89. 34. Khatkar MS, Moser G, Hayes BJ, Raadsma HW. Strategies and utility of
imputed SNP genotypes for genomic analysis in dairy cattle. BMC Genomics. 2012;13:538.
35. Ertl J, Edel C, Emmerling R, Pausch H, Fries R, Götz K-U. On the limited increase in validation reliability using high-density genotypes in genomic best linear unbiased prediction: observations from Fleckvieh cattle. J Dairy Sci. 2014;97:487–96.
36. Pimentel ECG, Edel C, Emmerling R, Götz K-U. Imputation errors bias genomic predictions. J Dairy Sci. 2015;98:4131–8.
37. Zhang Z, Druet T. Marker imputation with low-density marker panels in Dutch Holstein cattle. J Dairy Sci. 2010;93:5487–94.
38. Erbe M, Hayes BJ, Matukumalli LK, Goswami S, Bowman PJ, Reich CM, et al. Improving accuracy of genomic predictions within and between dairy cattle breeds with imputed high-density single nucleotide polymorphism panels. J Dairy Sci. 2012;95:4114–29.