1. Introduction
Due to rapid industrialization and uncontrolled urbanization around many cities and coastal areas, an alarming level of pollutants has contaminated these aquatic environments (Naji et al., 2010). Out of these pollutants, heavy metals are major concern because of their persistent and bio-accumulative nature (Kaushik et al., 2009). Heavy metals can be introduced into the aquatic environment and accumulate in sediments through disposal of liquid efluents, chemical leachates and runoff originating from domestic, industrial and agricultural activities, as well as atmospheric deposi-tion (Mucha et al., 2003). These metals can be released from the sediments to the overlying water via natural or anthropogenic processes, consequently causing potential danger to the ecosystems (McCready et al., 2006; Chen et al., 2007). Sediments have a high stor-age capacity for pollutants that in any part of the hy-drological cycle far less than 1% of these are actually dissolved in the water and more than 99% are stored in the sediments (Salomons and Stigliani, 1995), hence, producing remarkable metals enrichment. Due to these chararacteristics, sediments play an important role in the assessment of metal contamination in natural wa-ters (Wardas et al., 1996). Moreover, accumulation or release of metals in sediments is largely controlled by their geochemistry, in particular, type and quantities of organic matter, grain size and cation exchange capac-ity (Vertacnik et al., 1995). And since they can act as point sources of contamination during anthropogenic activities, sediments are suitable tool for measuring the
Assessment of Metals Contamination in Klang River Surface Sediments by using
Different Indexes
Abolfazl Naji and Ahmad Ismail
Department of Biology, Faculty of Science, University Putra Malaysia (UPM), Serdang, Selangor 43400, Malaysia
Abstract
Surface sediments (0-5 cm) from 21 stations throughout Klang River were sampled for metal concentration as well
sediment’s pH, total organic carbon (TOC) and particles sizes to obtain an overall classiication of metal contaminations in the area. The concentration of metals (µg∕g, Fe%, dw) were as follows: 0.57- 2.19 Cd; 31.89-272.33 Zn; 5.96-24.47 Ni; 10.57- 52.87 Cu; 24.23-64.11 Pb and 1.56-3.03 Fe. The degree of sediment contaminations were computed using an enrich
-ment factor (EF) and geoaccumulation index (Igeo). The results suggested that enrichment factor and geoaccumulation values of Cd were greatest among the studied metals. Pearson’s correlation indicated that effectiveness of TOC in controlling the
distribution and enrichment of metals was a more important factor than that of the grain size (<63µm). The study revealed
that on the basis of computed indexes, Klang River is classiied as moderately polluted river.
Keywords: Klang River; heavy metals; indexes; surface sediment; contamination
extent of metal enrichment using the enrichment factor (EF) and geoaccumulation index (Igeo).
This study therefore aimed to determine the dis-tribution and concentration of trace metals in surface sediments with different sediment characteristics from 21 stations in the Klang River; to identify the quality as-sessment of surface sediments using enrichment factor (EF), geoaccumulation index (Igeo) and to appraise their lithogenic inputs; and to determine the relationships between elements and total organic carbon (TOC). 2. Materials and Methods
2.1. Study area
Klang River is one of the most important rivers in Malaysia (3˚ 13 ’ 01.33” N 101˚ 40 ’ 54.92َ” E) (Fig. 1).
It has an approximate distance of 120 km and catchment area of about 1288 km2
. The Klang River discharges throughout the year at an average annual discharge of 17.2 m3/sec (Balamurugan, 1991). It lows through Kuala Lumpur and Klang Valley and eventually drains into the Straits of Malacca. This area was chosen for the present study because of it is situated in the most urbanized and heavily populated area of more than 4.4 million people (16% of the national population) living around this area. In addition, it drains into the one of the busiest international shipping lanes. Furthermore, most of the industrial growth in Selangor state has taken place on the banks of Klang River. The main sources of heavy metal inputs into Klang River are manufac-turing industries, agriculture and animal husbandry, in fish experimentally exposed in aquarium under controlled conditions. Fish (
annually as effluents from industries (Saffi, 1981).
Fish provides a suitable model for monitoring
been used successfully in several species (De Flora,
Titagarh Thermal Power Plant, Kolkata, India.
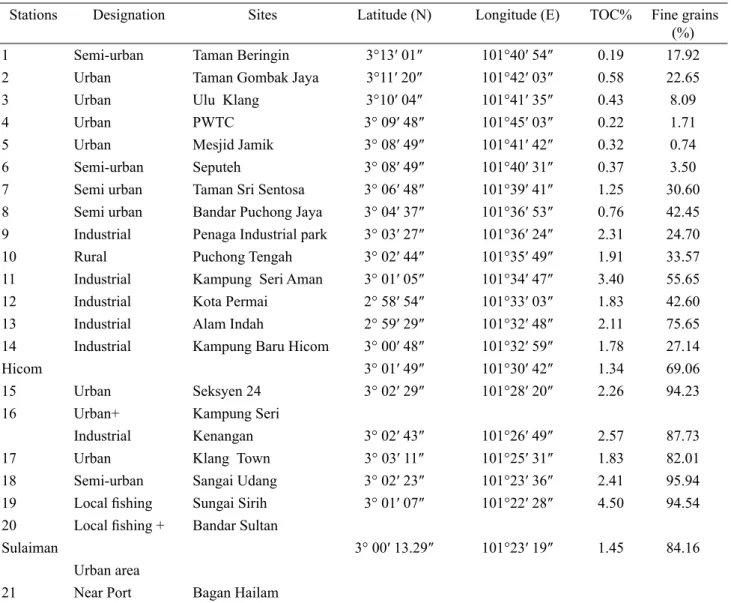
agro-based industries and urbanization activities (DOE, 1998). However, there is no suficient information of atmospheric inputs on the Klang River. The land use in the basin is diverse, ranging from tropical forests in the headwater region to urban and the other related activities such as towns, housing and industrial estate, infrastructures in the upper, middle and lower parts of the basin (Balamurugan, 1991). The longitudes and latitudes of sampling stations were measured by using global positioning system (GPS) (Table 1).
2.2. Field and laboratory methods
Surface sediment (0-5) samples were collected from 21 stations between January and February 2009 along Klang River (Fig 1). At each station, three sur -face sediment samples were collected by scraping the surface layer using a clean plastic spoon. The surface sediments of each sample were placed in polyethylene plastic bags and they were then kept in an ice box. As soon as the ield work was inished, samples were brought to the ecotoxicology laboratory at University Putra Malaysia and stored at -10˚C freezer for future analysis. The samples for assessment were dried using an air-circulating oven at 80˚C, and sieved through 63µm mesh size and kept in an acid-washed container
for future use. For metal (Cd, Zn, Ni, Cu, Pb and Fe) analyses, about 0.5 to 1g dried sediments were digested in 10 ml solution of mixtured HNO3 (AnalaR grade, R&M 65%) and HClO4 (AnalaR grade, R&M 70%) in the ratio of 4:1, staring at low temperature (40˚C) for 1 h and then at 140˚C for 3 h (Ismail, 1993). The digested samples were then diluted to 40 ml with double-distilled water (DDW) and iltered through Whatman No.1 ilter paper into pre-cleaned 50 ml volumetric lasks. The samples were measured for trace metal concentration using an air-acetylene lame Atomic Absorption Spec -trophotometer (Perkin-Elmer Model AAnalyst 800).
2.3. TOC, Fine grain-size distribution and pH analysis
Concentration of total organic carbon was mea-sured in surface sediment following the method of Nelson and Sommers (1996). The grain size distribu-tion in surface sediments was determined by pipette method (Gee and Bauder, 1986). And the pH of surface sediments were determined in distilled water with a 1: 2.5 sediment: water ratio (Madejon et al., 2002). All sediment samples for each trace metal were measured in triplicate.
2.4. Quality control
Figure 1. Study area and Geographical location of 21 stations in Klang River.
3
10 11 12 13
9 8
7 6
5 4 3
2 1
14 15 16 17 18 19 20 21
Klang Gate Dam
Kuala Lumpur
Batu Dam
Klang
Petaling
Gombak
Hulu Langat South China Sea
Indonesia
Kuala Lumpur
Klang River Basin
Shah Alam
To preclude uncertain contaminations, all labora-tory equipments used were washed with phosphate-free soap, double rinsed with distilled water (DDW) and left in 10% HNO3 for 24 hr and all equipments were then rinsed two times with double distilled water and left semi-closed to dry at room temperature. Certiied Reference Material (CRM) (International Atomic Energy Agency, Soil-5, and Vienna, Austria) was
determined as a precision check. Recovery and accuracy for certiied and measured concentration of the metals were tabulated in Table 2. Calibration curves for each trace element were determined with 1,000 mg/L (BDH Spectrosol®) stock solution. The reagent and procedural blanks were monitored after ive samples during the analysis as part of the quality accuracy program.
Table 2. Measured and certiied concentration, and percentages of recovery of International Atomic Energy Agency, Soil-5,
Vienna, Austria. (Mean± standard deviations; n=5)
Element Measured concentration
(µg/g)
Certiied concentration
(µg/g)
Percentage of
recovery (%)
Cd 1.62± 0.05 1.5±0.06 108.0
Zn 359.9±2.10 368.0±3.20 98.0
Ni 11.53±0.7 13±0.0 88.7
Cu 80.0±5.0 77.1±4.7 103.8
Pb 123.8±10.0 129.0±26.0 96.0
Fe (3.80±0.86)×104 (4.45±0.19)×104 85.6
Stations Designation Sites Latitude (N) Longitude (E) TOC% Fine grains
(%)
1 Semi-urban Taman Beringin 3°13′ 01″ 101°40′ 54″ 0.19 17.92
2 Urban Taman Gombak Jaya 3°11′ 20″ 101°42′ 03″ 0.58 22.65
3 Urban Ulu Klang 3°10′ 04″ 101°41′ 35″ 0.43 8.09
4 Urban PWTC 3° 09′ 48″ 101°45′ 03″ 0.22 1.71
5 Urban Mesjid Jamik 3° 08′ 49″ 101°41′ 42″ 0.32 0.74
6 Semi-urban Seputeh 3° 08′ 49″ 101°40′ 31″ 0.37 3.50
7 Semi urban Taman Sri Sentosa 3° 06′ 48″ 101°39′ 41″ 1.25 30.60
8 Semi urban Bandar Puchong Jaya 3° 04′ 37″ 101°36′ 53″ 0.76 42.45
9 Industrial Penaga Industrial park 3° 03′ 27″ 101°36′ 24″ 2.31 24.70
10 Rural Puchong Tengah 3° 02′ 44″ 101°35′ 49″ 1.91 33.57
11 Industrial Kampung Seri Aman 3° 01′ 05″ 101°34′ 47″ 3.40 55.65
12 Industrial Kota Permai 2° 58′ 54″ 101°33′ 03″ 1.83 42.60
13 Industrial Alam Indah 2° 59′ 29″ 101°32′ 48″ 2.11 75.65
14 Industrial Kampung Baru Hicom 3° 00′ 48″ 101°32′ 59″ 1.78 27.14
Hicom 3° 01′ 49″ 101°30′ 42″ 1.34 69.06
15 Urban Seksyen 24 3° 02′ 29″ 101°28′ 20″ 2.26 94.23
16 Urban+ Kampung Seri
Industrial Kenangan 3° 02′ 43″ 101°26′ 49″ 2.57 87.73
17 Urban Klang Town 3° 03′ 11″ 101°25′ 31″ 1.83 82.01
18 Semi-urban Sangai Udang 3° 02′ 23″ 101°23′ 36″ 2.41 95.94
19 Local ishing Sungai Sirih 3° 01′ 07″ 101°22′ 28″ 4.50 94.54 20 Local ishing + Bandar Sultan
Sulaiman 3° 00′ 13.29″ 101°23′ 19″ 1.45 84.16
Urban area
33 2.5. Statistical analysis
All statistical analyses were computed using Sta-tistical Package for Social Science (SPSS) version 16. Pearson’s correlation was applied to determine corre -lation matrix between metal concentrations, TOC and ine grain-size in surface sediments of Klang River.
3. Results and Discussion
3.1. General sediments characteristics
Some characteristics of the surface sediments at different stations are summarized in Table 1. Some of physico-chemical parameters of sediment as pH, grain size and TOC inluence the adsorption process. The results showed that sand was the principal surface sediment type in the upstream stations. Middle parts were cocked with well-stored silts and sands, and also downstream stations were choked with ine-grained clays and silts. The pH of sediments from 21 stations ranged from 6.1 to 7.1, and most stations were slightly acidic except Stations 6 and 9 that were slightly alka-line. According to Liao (1990), the acidic pH could be due to decomposition of microbial activity of litter and also from oxidation of FeS2 and FeS to H2SO4. The TOC in the sediment ranged between 0.19% and 4.5%. The percentages of TOC in the ine-grained size of the samples were higher than that in sand-grained size. The organic carbon in polluted surface sediments ranged from 1.5 to 2.4 times greater than those in less polluted surface sediments. The ine-grained fraction (≤63µm) has a high speciic surface area per unit quan -tity of material and, because of surface coatings of iron and manganese oxides and natural organic matter, it is more likely to adsorb organic and trace contamina-tions (Maher et al., 1999). According to Haque and Subramanian (1982) metal absorption capacity is in the order of sand<silt<clay. Due to increases in surface areas, mineral and organic matter content as particle size decreased from sand to clay. However, the trend found in this study, on which more metals were accumulated in the ine-grained fraction of the sediments might not be universal for all metals, and might be varied between metal species (Tam and Wong, 2000).
3.2. The concentration and distribution of trace metals
Metal concentrations (µg∕g, Fe %, dw) in the sur -face sediments from 21 stations varied from 0.57 to 2.19 µg/g for Cd, 31.89 to 272.33 µg/g for Zn, 5.96 to 24.47 µg/g for Ni, 10.57 to 63.03 µg/g for Cu, 24.23 to 64.11µg/g for Pb and 1.56% to 3.03% for Fe (Table 3). The highest concentration of metals was found in those
stations along the vicinity of industrial parks (e.g., Shah Alam industrial area) and highly populated centers (e.g., Klang Valley and Kuala Lumpur). Surface sediments in these areas have high contents of clay and organic carbon. Conversely, metal concentrations were lowest in those stations with low anthropogenic lux, clay and organic carbon. Mean concentrations of Cd, Zn and Pb in the surface sediments in the study area were higher than the average shale (Turekian and Wedepohl, 1961). Whereas, the average concentration of Ni and Cu were less than average shale. (Table 3)
3.3. Enrichment Factor (EF)
Improved interpretations are obtained by normal-izing metal concentration in sediments to percentage of a given grain size, or Al, Fe or organic carbon concentra -tions (Luoma and Rainbow, 2008). Enrichment factor (EF) is a good tool to differentiate the metal source be -tween lithogenic and naturally occurring (Zhang et al., 2009; Chen et al., 2007; Amin et al., 2009). Enrichment factor is usually distinguished by aluminum because of its high natural concentration, minimal anthropogenic contamination, it is a structural element of clays, and the metals to Al proportions in the crust are relatively constant (Schrop et al., 1990; Summers et al., 1996). However, in the present study we used Fe to compute EF because it is the fourth major element in the earth’s crust and most often has no contamination concern. In addition, according to Daskalakis and O’Connor (1995) the main advantages of using Fe as a normal -izer are: (1) Fe is associated with ine solid surface; (2) its geochemistry is close to that of many trace metals; and (3) its natural sediment concentration tends to be uniform. Iron (Fe) has been used successfully by several researchers to normalize metals contamination in river and coastal sediments (Baptista-Neto et al., 2000; Zhang et al., 2007; Amin et al., 2009; Cevik et al., 2009). The EF for Fe-normalised data is deined by:
Where Mx is the concentration of metal in the
ex-amined sample, Fex is the concentration of Fe in the examined sample, Mc is the concentration of metal in
the average shale or undisturbed sediment and Fec is
the concentration of Fe in the average shale or undis -turbed sediment. In the present study, average shale (Turekian and Wedepohl, 1961) was used as background or undisturbed value for those metals because no such data was available for the study area. The undisturbed sediment values utilized were (Turekian and Wedepohl, 1961) in µg/g: 0.30 for Cd, 95 for Zn, 68 for Ni, 45 for
EF
metal=shale sample
Fec Mc
Fex Mx
) / (
Cu, 20 for Pb, and 4.7 for Fe (Table 3). The EF values were interpreted as described by Chen et al. (2007) where EF<1 indicates no enrichment, EF<3 is minor enrichment, EF=3-5 is moderate enrichment, EF=5-10 is moderately severe enrichment, EF=10-25 is severe enrichment, EF=25-50 is very severe enrichment and EF>50 is extremely severe enrichment.
The result from the present investigation showed that EF of Cd ranged from 5.38 to 19.18, EF from 0.99 to7.15 for Zn, from 0.26 to 0.97 for Ni, from 0.69 to 3.78 for Cu and from 3.23 to 9.08 for Pb (Table 4).The EF values of Ni in all the stations were found to be less than 1 (EF<1) which indicated that this metal had no enrichment. The lowest EF values were determined in Ni (average value 0.58±0.18) which probably originated
from natural weathering process. The average EF of Cu (1.98±0.79) indicated that this metal was caused by minor enrichment, whereas, the average EF value of Zn (average value 4.13±1.83) suggested moderate enrichment. However in some stations Zn values could be classiied as moderately severe enrichment which indicated high anthropogenic discharge. In contrast, Cd EF values were greater than the other four metals studied. The average EF of Cd (average value 13.08 ±5.24) was determined to be higher than 10 (EF>10) in the Klang River surface sediments (Table 4), suggesting that Cd contamination was caused by severe enrichment and should be of major concern. The average EF value for Pb (average value 5.78±1.38) was EF>5 suggesting that Pb contamination was caused by moderate to severe
Stations No.
Cd Zn Ni Cu Pb Fe
1 0.57 31.89 5.96 10.57 26.57 1.60
2 1.02 130.10 11.27 18.87 42.15 1.73
3 1.19 146.77 14.27 37.59 56.95 2.15
4 1.12 87.30 11.12 30.8 50.11 1.97
5 1.31 176.59 17.33 51.81 64.11 1.66
6 0.98 103.90 11.17 25.17 36.78 2.33
7 1.13 138.70 15.84 30.42 41.05 2.53
8 1.04 174.17 15.2 43.89 57.53 3.03
9 2.19 179.33 18.00 33.83 59.82 2.08
10 1.78 97.20 15.18 19.69 36.05 1.56
11 2.13 251.40 24.47 63.03 51.23 1.74
12 2.06 257.90 19.13 35.13 49.23 1.81
13 1.76 272.33 19.09 39.87 52.06 2.07
14 1.61 252.59 20.68 52.87 45.64 1.77
15 1.16 152.21 16.27 31.98 41.65 1.66
16 2.11 261.16 22.53 53.34 59.66 2.20
17 1.91 219.23 20.07 39.24 55.87 1.88
18 2.13 160.35 21.7 52.55 57.49 2.35
19 2.16 151.38 19.13 49.44 53.43 2.54
20 1.91 120.30 14.89 43.20 51.78 1.71
21 1.40 86.71 11.31 17.33 24.73 1.80
Max 2.19 272.33 24.47 63.03 64.11 3.03
Min 0.57 31.89 5.96 10.57 24.23 1.56
Mean 1.54 163.30 16.30 37.14 47.94 2.03
SD 0.49 66.07 4.47 13.46 10.26 0.37
Aver. Shalea 0.30 95 68 45 20 4.7
*TELb **(FW) 0.60 123 18 36 35
-*TETb **(FW) 3 540 61 86 170 -
a
Turekian and Wedenphol (1961); b MacDonald et al. (2000).
٭ b
35 enrichment. Lead had the second highest EF values (e.g., 3.23 to 9.08) among the metals studied. The high contamination of these heavy metals could be related to the local point sources. For example, Station 5 and 17 are near the large sewage outlet area while Stations 9 to 16 are near industrial parks. Overall, EF of these metals was higher in the industry-affected area than urban-affected (mostly from domestic source) area. 3.4. Geoaccumulation Index (Igeo)
The Geoaccumulation Index (Igeo) was calculated to determine metals contamination in sediments of Klang River. This expression was proposed by Müller (1979) in order to calculate metals concentration in sediments by comparing current concentrations with undisturbed or crustal sediment (control) levels. Müller (1981) has classiied Igeo in relation to contamination levels into seven classes, Unpolluted (Class 0, Igeo<0), unpolluted to moderately polluted (Class 1,0< Igeo<1), moderately polluted (Class2 ,1< Igeo<2), moderately to strongly pol-luted (Class3, 2< Igeo<3), strongly polluted (Class4, 3< Igeo<4), strongly to very strongly polluted (Class5, 4< Igeo<5) and very strongly polluted (Class6, Igeo>5), the highest grade relecting a 100-fold enrichment above baseline values.
The geoaccumulation (Igeo) is expressed by the follow-ing pattern:
Where Cn is the measured concentration of the sediment for metal (n), Bn is the geochemical background value of metal (n) and factor 1.5 is the possible variations of background data due to lithogenic impacts. The back-ground values of the heavy metals were the same as applied in the enrichment factor calculation.
The geoaccumulation index (Igeo) of heavy metals in this study revealed that 83.33% of the elements be -longed to Igeo classes 0 and 1 (unpolluted and unpolluted to moderately polluted), 9.52% belonged to Igeo class 2 (moderately polluted) and only 7.14% is classiied at Igeo class 3 (moderately to strongly polluted ) (Table 4). Cadmium had the highest Igeo values and in most stations it was classiied as moderately polluted (Class 2, 1< Igeo<2) and moderately to strongly polluted (Class 3, 2< Igeo<3). Moreover, the average geoaccumulation index of Cd (1.71±5.24) suggested that surface sedi -ments of Klang River were moderately polluted by this metal, whereas the average geoaccumulation index of 0.058± 1.83 and 0.64 ± 1.38 suggested that surface sedi -ments of Klang River were unpolluted to moderately polluted (Class 1,0< Igeo<1) by Zn and Pb, respectively.
In contrast, the Igeo of Ni, Cu and Fe in all stations were of classiied to class 0 (Igeo<0) suggesting unpolluted state from these metals. None of the trace metals in this investigation belonged in the last three classes that is strongly polluted (Classes 4, 5 and 6).
3.5. Correlation Matrix
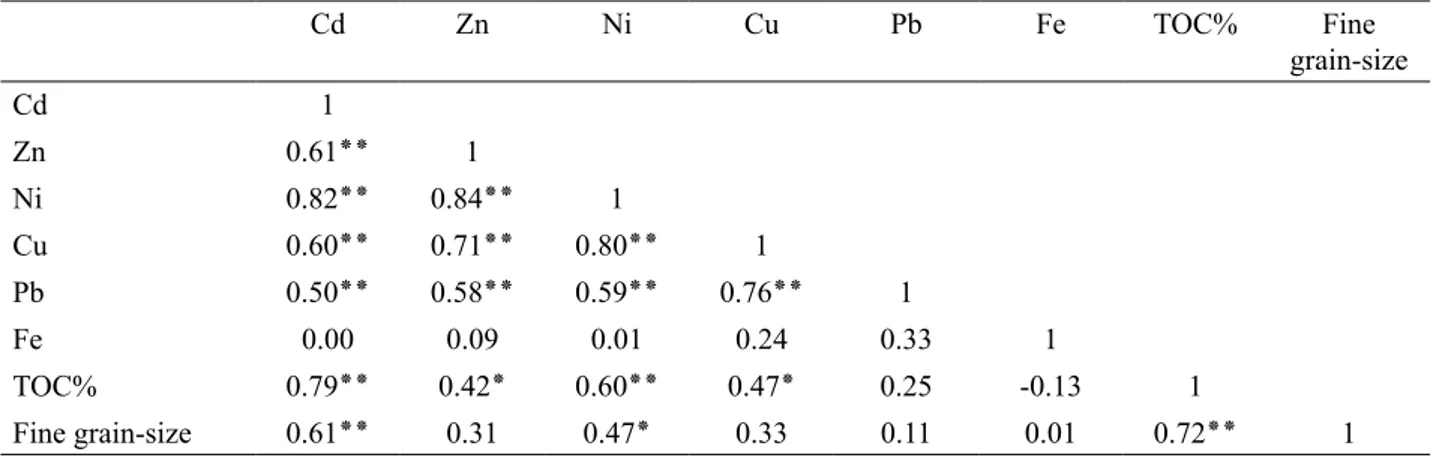
Pearson’s correlation matrix was used to determine the relationships between Cd, Zn, Ni, Cu, Pb, Fe, TOC and grain-size of surface sediments (Table 5). The result indicated that most metals (Cd, Zn, Ni, Pb and Cu) have a positive signiicant association within metals (r= 0.50- 0.84; p<0.01) (Table 5). The correlation coef-icient between Cd (r=0.0), Zn (r=0.09), Ni (r=0.01), Cu (r=0.24), Pb (r=0.33), ine grain-size (0.01) and Fe were positive, but none of these relationships were signiicant (at the 5% signiicance level) (Table 5). On the other hand, there was a negative correlation between Fe (r = -0.13) and TOC. The result suggested that concentrations of these metals were not controlled by natural weathering processes (Zhang et al., 2007). Similarly, there was a signiicant positive correlation between Cd (r=0.79; p<0.01), Zn (r = 0.42; p< 0.05), Ni (r=0.60; p<0.01), Cu (r= 0.47; p<0.05), ine grain-size (r=0.72; p< 0.01) and TOC (Table 5). Low positive correlations indicated by Pb suggested that this metal has low association with organic carbon. The number and intensity of binding sites are variable among types of organic matter. Some types of organic material have few sites per unit surface (e.g. lignins) and others have many (fulvic materials) (Luoma and Rainbow, 2008). Although, metal availability is inluenced by organic matter content, some characteristics of the sediment such as pH, redox reactions and the metal binding capacity, which control the solubility, availability and mobility of metals, are also important (Naji et al., 2010). Signiicant correlations between most of these metals were probably due to inluxes of some non-lithogenic and natural sources into the surface sediments.
3.6. Sediment quality guidelines (SQGs)
In order to predict adverse biological effects in contaminated sediments, numerous sediment quality guidelines (SQGs) have been developed over the past decade (MacDonald et al., 2000). In this investigation, we compared our total concentration with SQG of threshold effect level (TEL), which includes threshold effect concentrations, and toxic effect threshold (TET), which includes probable effect concentrations (PEC) as described by MacDonald et al. (2000) to assess the possible biological consequences of the metal concentrations in the surface sediments (Table 3).
Igeo=log2
¸
¹
·
¨
©
§
Station Cd Zn Ni Cu Pb Fe
EF Igeo EF Igeo EF Igeo EF Igeo EF Igeo EF Igeo
1 5.58 0.34 0.99 -2.16 0.26 -4.11 0.69 -2.68 3.90 -0.18 - -2.16
2 9.24 1.18 3.72 -0.13 0.45 -3.18 1.14 -1.84 5.73 0.49 - -2.03
3 8.67 1.40 3.38 0.04 0.46 -2.84 1.83 -0.84 6.22 0.92 - -1.72
4 8.91 1.32 2.19 -0.71 0.39 -3.20 1.63 -1.13 5.98 0.74 - -1.84
5 12.36 1.54 5.26 0.31 0.72 -2.56 3.26 -0.38 9.08 1.10 - -2.09
6 6.59 1.12 2.21 -0.46 0.33 -3.19 1.13 -1.42 3.71 0.29 - -1.66
7 7.00 1.33 2.71 -0.04 0.43 -2.69 1.26 -1.15 3.81 0.45 - -1.48
8 5.38 1.21 2.84 0.29 0.35 -2.75 1.51 -0.62 4.46 0.94 - -1.22
9 16.50 2.28 4.27 0.33 0.60 -2.51 1.70 -1.00 6.76 1.00 - -1.76
10 17.88 1.98 3.08 -0.56 0.67 -2.75 1.32 -1.78 5.43 0.26 - -2.18 11 19.18 2.24 7.15 0.82 0.97 -2.06 3.78 -0.10 6.92 0.77 - -2.02 12 17.83 2.19 7.05 0.86 0.73 -2.42 2.03 -0.94 6.39 0.71 - -1.96 13 13.32 1.97 6.50 0.93 0.64 -2.42 2.01 -0.76 5.91 0.79 - -1.77
14 14.25 1.84 7.07 0.82 0.81 -2.30 3.12 -0.36 6.06 0.60 - -1.99 15 10.95 1.37 4.54 0.09 0.68 -2.65 2.01 -1.08 5.90 0.47 - -2.09 16 15.03 2.23 5.87 0.87 0.71 -2.18 2.53 -0.34 6.37 0.99 - -1.68 17 15.92 2.09 5.77 0.61 0.74 -2.35 2.18 -0.79 6.98 0.90 - -1.91
18 14.07 2.24 3.38 0.17 0.64 -2.24 2.34 -0.36 5.75 0.94 - -1.59 19 13.32 2.26 2.95 0.09 0.52 -2.42 2.03 -0.45 .94 0.83 - -1.47 20 17.50 2.09 3.48 -0.24 0.60 -2.78 2.64 -0.64 7.12 0.79 - -2.05
21 12.19 1.64 2.38 -0.72 0.43 -3.17 1.01 -1.97 3.23 -0.28 - -1.97
Max 19.18 2.28 7.15 0.93 0.97 -2.06 3.78 -0.34 9.08 1.10 - -1.22
Min 5.38 0.34 0.99 -2.16 0.26 -4.11 0.69 -2.68 3.23 -0.27 - -2.18
Mean 13.08 1.71 4.13 0.06 0.58 -2.70 1.98 -0.98 5.78 0.64 - -1.84
SD 5.24 0.52 1.83 0.72 0.18 0.47 0.79 0.64 1.38 0.37 - 0.26
Threshold effect concentrations should be used to iden-tify sediments that are unlikely to be adversely affected by sediment-associated contaminants, while the PECs should be used to identify sediments that are likely to be toxic to sediment-dwelling organisms (MacDonald et al., 2000).
The result of this study showed that Cd concentra-tion of surface sediments in almost all the staconcentra-tions were above the TEL value of 0.6µg/g (except for Stations 1) and below the TET value of 3µg/g. On the other hand, Zn concentrations in all of stations were much lower than TET value (540µg/g) and were most stations (except Stations 1, 4, 6, 10, 20, 21) were above TEL (123µg/g). Concentration of Ni in surface sediments at all stations were still well below TET (61 µg/g) value. Likewise, Cu and Pb concentrations in all the stations were below the TET value of 86 µg/g and 170µg/g, respectively. In general, the distributions of Cd, Zn, Cu, Ni and Pb in the ≤ TEL range were 4.7, 28.57, 38.09, 47.61 and 9.52%, respectively. None of metal
concentrations in the sediments was as high as TET values. However, some metal concentrations exceeded the values for TEL.
4. Conclusions
the surface sediments could be classiied as “unpolluted to moderately polluted to strongly polluted”. Accord-ing to SQG of threshold effect level, and toxic effect threshold, none of the metals in the sediments of Klang River was equal or higher than the TET values, however, some metal concentrations exceeded the TEL values. These indexes revealed that stations close to industrial and urban areas were more metal-enriched than other areas. This investigation showed that risk of metal concentrations can be evaluated using some indexes and not only by testing of total metal concentrations. Although the levels of most trace metals in the surface sediments did not show extreme enrichment and did not present any serious threat to the local fauna and lora, it is still highly recommended that further investiga-tions and monitoring be conducted to assess long term effects of anthropogenic inputs into the Klang River ecosystems.
References
Amin B, Ismail A, Arshad A, Yap CK, Kamarudin MS. Anthropogenic Impacts on heavy metal concentrations in the coastal sediments of Dumai, Indonesia. Environ-
mental Monitoring and Assessment 2009; 148:
291-305.
Balamurugan G. Sediment balance and delivery in a humid tropical urban river basin: the Klang River, Malaysia. Catena1991; 18: 271-87.
Baptista-Neto JA, Smith BJ, McAllister JJ. Heavy metal concentrations in surface sediments in a nearshore environment, Jurujuba Sound, Southeast Brazil.
Environment Pollution 2000; 109: 1- 9.
Cevik F, Goksu M, Derici O, Findik O. An assessment of
metal in surface sediments of Seyhan dam by using enrichment factor, geoaccumulation index and statistical analyses. Environmental Monitoring and Assessment
2009; 148: 291-305.
Chen CW, Kao CM, Chen CF, Dong CD. Distribution and
accumulation of heavy metals in sediments of Kaohsiung
Harbor, Taiwan. Chemosphere 2007; 66(8); 1431–40.
Daskalakis KD, O’Connor TP. Normalization and elemental
sediment contamination in the coastal United States. Environmental Science and Technology 1995;
29:470-77.
DOE. Environmental quality report, Department of Environ ment. Ministry of Science Technology and the Environ- ment (Malaysia). Maskha Sdn Bhd, Ampang, Kuala
Lumpur. 1998.
Gee GW, Bauder JW. Particle-size analysis. In: Methods of soil Analysis. Part 1. Physical and Mineralogical
Methods, Agronomy Monograph No. 9. 2nd ed. ASA-SSSA.
Madison, USA. 1986; 383-411.
Haque MA, Subramanian V. Cu, Pb and Zn pollution of soil
environment. The CRC Critical Review in Environment
Control 1982; 12: 13- 90.
Ismail A. Heavy metal concentration in sediments of Bintulu,
Malaysia. Marine Pollution Bulletin 1993; 26: 706- 07.
Kaushik A, Kansal A, Santosh, Meena, Kumari S, Kaushik
CP. Heavy metal contamination of river Yamuna, Haryana, India: Assessment by Metal Enrichment Factor
of the Sediment. Journal of Hazardous Materials. 2009;
164: 265–70
Liao JF. The chemical properties of the mangrove Solonchak
in the northeast part of Hainan Island. The Acta. Scientia- rum Naturalium Universities Sunyatseni 1990;
(4): 67–72.
Luoma SN, Rainbow PS. Metal Concentration in Aquatic Environments. New York: Cambridge University Press, New York, USA. 2008; 101-16.
MacDonald DD, Ingersoll CG, Berger TA. Development and
evaluation of consensus-based sediment quality guide- lines for freshwater ecosystems. Archives of Environ-
mental Contamination and Toxicology 2000; 39: 20–
31.
Madejon P, Murillo JM, Maranon T, Cabrera TF, Lopez F. Bioaccumulation of As, Cd, Fe and Pb in wild grasses
affected by the Aznalcollar mine spill (SW Spain).
Science of the Total Environment 2002; 209: 105-20. Maher W, Batkey GE, Lawarence I. Assessing the health
of sediment ecosystems: Use of chemical measurements. Freshwater Biology1999; 41: 361-72.
Table 5. Pearson’s correlation coeficient between metals, TOC and Fine grain-size
Cd Zn Ni Cu Pb Fe TOC% Fine grain-size Cd 1
Zn 0.61٭٭ 1
Ni 0.82٭٭ 0.84٭٭ 1
Cu 0.60٭٭ 0.71٭٭ 0.80٭٭ 1
Pb 0.50٭٭ 0.58٭٭ 0.59٭٭ 0.76٭٭ 1
Fe 0.00 0.09 0.01 0.24 0.33 1
TOC% 0.79٭٭ 0.42٭ 0.60٭٭ 0.47٭ 0.25 -0.13 1
Fine grain-size 0.61٭٭ 0.31 0.47٭ 0.33 0.11 0.01 0.72٭٭ 1
contaminations in sediments of Sydney Harbour. Australia and Vicinity. A chemical dataset for evaluating sediment quality guidelines. Environment International
2006; 32: 455-65.
Mucha AP, Vasconcelos MTSD, Bordalo AA. Macrobenthic community in the Douroestuary: relations with trace
metals and natural sediment characteristics. Environ-
mental Pollution 2003; 121: 169 - 80.
Müller G. Schwermetalle in den sedimenten des Rheins-Veranderungen seitt 1971. Umschau 1979; 79: 778– 83.
Müller G. Die Schwermetallbelastung der sedimente des Neckars und seiner Nebenlusse: eine Bestandsauf-nahme. Chemical Zeitung1981; 105: 157–64.
Naji A, Ismail A, Ismail AR. Chemical speciation and
contamination assessment of Zn and Cd by sequential
extraction in surface sediment of Klang River, Malaysia,
Microchemical Journal 2010; 95: 285-92.
Nelson DW, Sommers LE. Total carbon, organic carbon, and
organic matter. In: Methods of Soil Analysis, Part 3.
Chemical methods , American Society of Agronomy,
Madison, USA. 1996: 961-1010.
Salomons W, Stigliani W. Biogeodynamic of pollutants in
soils and sediments. Heidelberg: Springer-Verlag, Germany. 1995; 352.
Schrop SJ, Lewis FG, Windom HL, Ryan JD, Calder FD,
Burney LC. Interpretation of metal concentration of
metal in estuarine sediments of Florida using aluminum as a reference element. Estuaries 1990; 13: 227- 35. Summers JK, Wade TL, Engle VD, Malaeb ZA.
Normaliza-tion of metal concentraNormaliza-tions in estuarine sediments
from the Gulf of Mexico. Estuaries1996; 19: 581- 94. Tam N FY, Wong YS. Spatial variation of heavy metals in
surface sediments of Hong Kong mangrove swamps.
Environnemental Pollution 2000; 110 : 195- 205.
Turekian KK, Wedepohl KH. Distribution of the elements in some major units of the earth’s crust. Bulletin of
Geological Society of America1961; 72: 175–92. Vertacnik A, Prohic E, Kozar S, Juracic M. Behavior of some
trace elements in alluvial sediments, Zagreb water-well ield area, Croatia. Water Research 1995; 29: 237-46.
Wardas M, Budek L, Rybicka EH. Variability of heavy metals content in bottom sediments of the Wilga River, a
tributary of the Vistula River (Krakow area, Poland). Applied Geochemistry 1996; 11: 197-202.
Zhang L, Ye X, Feng H, Jing Y, Ouyang T, Yu X, Liang R,
Chen W. Heavy metal contamination in western
Xiamen Bay sediments and its vicinity, China. Marine Pollution Bulletin 2007; 54: 974- 82.
Zhang W, Feng H, Chang J, Qu J, Xie H, Yu L. Heavy
metal contamination in surface sediments of Yangtze
River intertidal zone: An assessment from different indexes. Environmental Pollution 2009; 157; 1533-43.
Received 13 August 2010 Accepted 20 September 2010
Correspondence to
Dr. Ahmad Ismail Department of Biology,
Faculty of Science,
University Putra Malaysia (UPM),
Serdang,
Selangor 43400,
Malaysia
Email: [email protected] Tel: 603 8946 6617