www.hydrol-earth-syst-sci.net/18/3069/2014/ doi:10.5194/hess-18-3069-2014
© Author(s) 2014. CC Attribution 3.0 License.
Quantitative contribution of climate change and human activities to
runoff changes in the Wei River basin, China
C. S. Zhan2, S. S. Jiang3, F. B. Sun2, Y. W. Jia1, C. W. Niu1, and W. F. Yue3
1State Key Laboratory of Simulation and Regulation of Water Cycle in River Basin, China Institute of Water Resources and Hydropower Research, Beijing 100038, China
2Key Laboratory of Water Cycle and Related Land Surface Processes, Institute of Geographic Sciences and Natural Resources Research, Chinese Academy of Sciences, Beijing 100101, China
3College of Water Sciences, Beijing Normal University, 100875, Beijing, China
Correspondence to:S. S. Jiang ([email protected])
Received: 6 January 2014 – Published in Hydrol. Earth Syst. Sci. Discuss.: 17 February 2014 Revised: 2 July 2014 – Accepted: 4 July 2014 – Published: 19 August 2014
Abstract. Surface runoff from the Wei River basin, the largest tributary of the Yellow River in China, has dramat-ically decreased over last 51 years from 1958 to 2008. Cli-mate change and human activities have been identified as the two main reasons for the decrease in runoff. The study period is split into two sub-periods (1958–1989 and 1990–2008) us-ing the Mann–Kendall jump test. This study develops an im-proved climate elasticity method based on the original cli-mate elasticity method, and conducts a quantitative assess-ment of the impact of climate change and human activities on the runoff decrease in the Wei River basin. The results from the original climate elasticity method show that climatic impacts contribute 37–40 % to the decrease in runoff, while human impacts contribute 60–63 %. In contrast, the results from the improved climate elasticity method yield a climatic contribution to runoff decrease of 22–29 % and a human con-tribution of 71–78 %. A discussion of the simulation reliabil-ity and uncertainty concludes that the improved climate elas-ticity method has a better mechanism and can provide more reasonable results.
1 Introduction
Climate change is expected to extensively alter global hydro-logical cycles (Legesse et al., 2003; Milly et al., 2005; Piao et al., 2007;Tang et al., 2013) by primarily changing the pat-tern of precipitation (IPCC, 2013; Sun et al., 2012). After the falling of precipitation into basins, human activities
in-cluding land use change, dam construction, river diversion, and other engineering and management practices also mod-ify hydrological cycles locally and therefore temporal and spatial distribution of water resources (Govinda, 1995; Milly et al., 2005). Quantitatively assessing the influence of climate change and human activities on surface runoff is vital for sus-tainable water resources management.
different periods. For example, Qiu et al. (2012) analyzed the influence of climate change and human activities on water resources in north China and found that in the 1970s–1980s the effects of climate change were dominant, but in the late 1980s and early 1990s the effects of the two factors were similar, and since the 1990s the influence of human activities has been slightly higher at around 55 %. Guo et al. (2008) employed the SWAT model to analyze the annual and sea-sonal runoff variability caused by climate change and human activities and found that the main influencing factor on an-nual runoff was climate change, but that changing land use was the main influence on seasonal runoff changes.
So far, there are many different methods used to evaluate and separate the effects of the two factors (Sun et al., 2014). One such method is based on physical processes or physi-cal mechanisms. This method controls the evolution of the various elements and analyzes the changes in driving fac-tors and contributions in a physical process simulation. The approach may be physically sound but requires major ef-forts on model calibration and can lead to remarkably dif-ferent results because of uncertainty in model structure and parameter estimation (Nash and Gleick, 1991; Revelle and Waggoner, 1983; Schaake, 1990; Vogel et al., 1999). Other methods can be classified as statistical data analysis meth-ods, such as the climate elasticity method used in this pa-per. The statistical data analysis methods are based on mean annual change trends in long time series, and provide gen-eralized relationships which do not consider species differ-ences. This approach incorporates measured or observed data via a variety of data validation techniques, and analyzes the contributions of different factors on different processes. The method is relatively simple, but requires a large volume of high-quality data (Risbey and Entekhabi, 1996).
Many studies have proven that the climate elasticity method is reasonable and credible (Chen et al., 2014). Chiew (2006) evaluated rainfall elasticity of streamflow in 219 catchments across Australia using the nonparametric cli-mate elasticity estimator and compared the esticli-mates with results obtained from the conceptual rainfall–runoff model SIMHYD, showing a consistent relationship between cli-mate elasticity values esticli-mated using the rainfall–runoff model and the nonparametric estimator. Ma et al. (2010) used a distributed hydrological model (GBHM) and a cli-mate elasticity model to conduct a quantitative assessment of the impacts of climate change and human activities on inflow into a reservoir. The GBHM simulation and climate elasticity model showed that climate change accounts for about 55 and 51 % of the reservoir inflow reduction, re-spectively. Hu et al. (2012) analyzed the impacts of cli-mate change and human activities on the Baiyangdian up-stream runoff, using two assessment methodologies (climate elasticity and hydrological modeling). The climate elasticity method was implemented at the annual scale and was com-putationally relatively simple; it needed fewer data and pa-rameters to calculate the impacts of climate change on
an-nual runoff. The hydrological model was implemented at the daily scale, and therefore needed more data and parame-ters but yielded more detailed, high temporal resolution re-sults. These two independent methods based on different timescales obtained consistent results. Thus, the climate elas-ticity method is considered to be an important indicator for quantifying the sensitivity of runoff to climate change and for separating the effects of natural and anthropogenic fac-tors at catchment scale (Dooge et al., 1999; Fu et al., 2007; Milly and Dunne, 2002; Sankarasubramanian et al., 2001; Schaake, 1990; Zheng et al., 2009). However, the main point for the climate elasticity method’s previous research indi-cates is that the method is used to separate the sensitivity of runoff to climate change without considering the human ac-tivities directly, and furthermore the accuracy of the original climate elasticity method should be improved.
In this paper we improve the climate elasticity approach by adding the influence of human activities to evaluate the hy-drological consequences of climate change and human activ-ities. To compare the original and improved climate elasticity approaches, we choose the Wei River basin as a case study. The application results have a great strategic meaning in the regional economic development and the development of west China (Song et al., 2007). The rest of the paper is structured as follows: Sect. 2 describes the study area and data; Sect. 3 presents the methodology; and results and discussion are in Sect. 4. The conclusions are presented in Sect. 5.
2 Study area and data 2.1 Study area
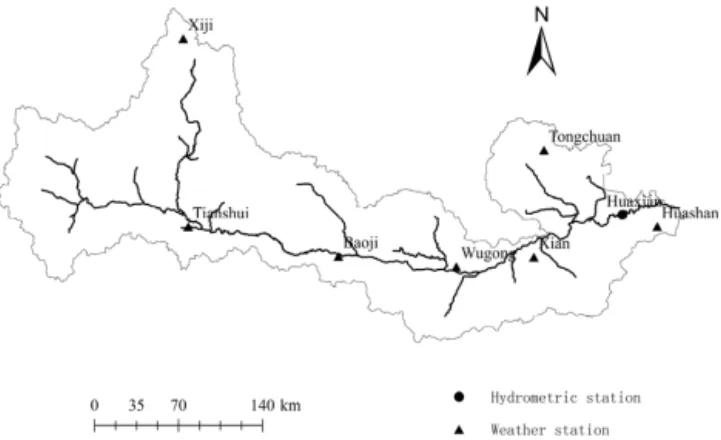
The Wei River is the largest tributary in the Yellow River. It originates from Niaoshu Mountain, and runs into the Yellow River at Tongguan. The basin is located between 104◦00′E– 110◦20′E and 33◦50′N–37◦18′N, with a length of 818 km and a drainage area of 1.35×10⁵km2.
The Wei River basin is located in temperate continental monsoon climate region. The climate is cold, dry and rain-less in winter controlled by the Mongolia high, while hot and rainy in summer affected by the western Pacific subtropical high. The mean air temperature is 7.8 to 13.5◦C, the mean annual precipitation is 400 to 800 mm, and the mean annual potential evapotranspiration is 800 to 1000 mm. The mean annual runoff in depth is 450 to 550 mm, with the coefficient of variation falling within 0.1 to 0.2 (He et al., 2009). 2.2 Data description
Figure 1.Location of the meteorological and hydrological stations used in this study.
from Hua County hydrological station, located in the river outlet downstream.
The potential evapotranspiration within the watershed can be calculated using the Hargreaves method, an empirical for-mula which was derived using the permeameter by Harg-reaves and Samani (1982) to estimate potential evapotranspi-ration, and most appropriate in all radiation and temperature estimation methods in north China (Luo and Rong, 2007). The expression is as follows:
E0=0.0135(T+17.8)
Rs
λ , (1)
where E0 represents potential evapotranspiration, mm day−1; T represents mean air temperature, ◦; Rs represents solar shortwave radiation, MJ/(m2day−1); λ
represents latency for vaporing water,λ=2.45 MJ kg−1.
3 Methodology
3.1 Detection of hydrologic changes 3.1.1 Trend analysis
In this study, the Mann–Kendall trend test is used to test the long-term trends of precipitation, evaporation and runoff in the Wei River basin. The Mann–Kendall trend test is a non-parametric statistical test method. It does not need the sam-ple to follow any particular distribution, and is not subject to interference from a small number of outliers. Moreover, the method is relatively simple (Mann, 1945; Kendall, 1975).
For a time seriesX which hasnsamples, construct vari-ableS:
S=
n−1 X
i=1
n
X
j=i+1
sgn(xi−xj), (2)
wherexi andxj represent the values in years i andj,i >
j,nis the record length of the series, and sgn(xi−xj)is a
characterization of the function.
The statistical test valueZc is calculated by the following
formula:
Zc=
S−1
√
Var(S), S >0
0, S=0
S+1
√
Var(S), S <0
.
(3)
When|Zc| ≤Z1−α/2, we accept the null hypothesis, which
indicates the sequence does not have a trend. If |Zc|>
Z1−α/2, we reject the null hypothesis and conclude that the
sequence does have a significant trend.Z1−α/2 is obtained from standard normal distribution function, andαis the sig-nificance level of the test.
To test the trend of the sequence in the Mann–Kendall test, it is usually necessary to estimate the slope of the monotonic trend, estimated as follows:
β= Media x
i−xj
i−j
, (∀j < i,1≤j < i≤n). (4) A positive value ofβindicates a rising trend (positive rate of change with time), and vice versa for negativeβ.
3.1.2 Change-point analysis
Identifying the change-point for runoff substantially influ-enced by human activities is significant. Depending upon the change-point, the hydrology series could be divided into two periods: before change-point, it was regarded as having no influence from human activities, and after change-point it was believed that human activities sharply affected runoff. Under the hypothesis that the time series is independent and stochastic, we can compute the following statistics:
UFk=
Sk−E(Sk)
√
Var(Sk)
(k=1,2, . . ., n), (5) whereE(Sk)and Var(Sk)represent the mean and variance of
Sk, respectively.
Next, the time series order is reversed (i.e.,xn,xn−1, . . . ,
x1), and the above process is repeated to yield the statistical variables UBk(k=n,n−1, . . . , 1), such that
UBk= −UFk (6)
Next, the curves of UBk and UFk are drawn, and if the two
curves have an intersection point and if the value ofU at this point satisfies|U|<1.96, then that point is regarded as a change point, with a confidence levelαof 0.05. Because the time series length in this study is 51 years, we use a signifi-cance test ofttest.
3.2 Original climate elasticity method
Runoff (R)can be expressed as a function of climate vari-ables (C)and other characteristics (H )(Hu et al., 2012):
where the parameter H represents the combined results of terrain, soil, land use/land cover and human activities (such as artificial water transfer). If the topography and soil in the study area remain constant during the study period, thenH
can represent human activities. So the runoff change can be expressed as
1R=1RC+1RH, (8)
where the parameter1R represents the total runoff change; and1RC,1RHrepresent the runoff changes caused by cli-mate change and human activities, respectively.
The total runoff change can be obtained from the formula
1R=Robs1−Robs2, where Robs1 and Robs2 represent the measured runoff before and after the change point, respec-tively.
Schaake (1990) first introduced the climate elasticity method to analyze the sensitivity of runoff to climate change. Climate elasticity of runoff (εX)can be defined as the
propor-tional change in runoff (R)relative to the change in climatic variables (X) (such as changes in precipitation or potential evapotranspiration) (Fu et al., 2007):
εX=
∂R/R
∂X/X. (9)
According to the long-term water balance equation (R= P −E), we assume that the runoff response to climate fac-tors is mainly caused by the precipitation and potential evap-otranspiration. According to the theory of total differential equations, the differential form is as follows:
1RC=εP
R
P1P+εE0 R E0
1E0 and εP+εE0 =1, (10)
where 1Rc represents runoff change caused by climate change, 1P and1E0 are the change of precipitation and potential evapotranspiration, andεP andεE0 are the
precipi-tation and potential evapotranspiration elasticities of runoff, respectively.
According to the Budyko hypothesis, actual evapotranspi-ration (E)is a function of the dryness indices (φ=E0/P ), specificallyE=P∗F (φ), and the precipitation and poten-tial evapotranspiration elasticities of stream flow can be ex-pressed as
εP=1+φF′(φ)/(1−F (φ)) εE0=−φF′(φ)/(1−F (φ)). (11)
The following formulae (one with a parameter and the others without) for the Budyko hypothesis are often used to estimate
F (φ), as shown in Table 1.
According to Table 1, the precipitation elasticity (εp) and
potential evapotranspiration elasticity (εE0) can be
deter-mined, allowing the runoff change caused by climate change (1Rc)to be calculated, and thus the contribution of climate change can be assessed. Calibration of Zhang’s (2001) for-mula using land cover and land use conditions yielded a pa-rameter value of 1.5.
3.3 Improved climate elasticity method
At the catchment scale, and over a long time period, the wa-ter balance equation can be simplified asP =E+R. Here the mean annual runoff R can be divided into observed runoff and changing runoff caused by human activities, i.e.,
R=Robs+RH, where Robs is observed runoff. RH refers mainly to water consumption or water intake by human activ-ities which mainly include measures of water and soil conser-vation, river dam construction, water intake from rivers, wa-ter transfer and so on. So the wawa-ter balance equation can be expressed asP =Robs+RH+E, which in differential form is
dP =dRobs+dRH+dE. (12)
Meanwhile, according to the Budyko hypothesis E= P F (φ) , φ=E0/P, the total differential form can be ex-pressed as
dE=
F (φ)−φF′(φ)
dP+F′(φ)dE0. (13) When substituted into Eq. (12), this leads to
dRobs=
1−F (φ)+φF′(φ)dP−F′(φ)dE0−dRH. (14) After dividing Eq. (14) by Robs, we obtain the following equation:
dRobs
Robs =
1−F (φ)+φF′(φ) P Robs
dP
P (15)
−F′(φ) E0 Robs
dE0
E0 −
RH
Robs dRH
RH
.
The climate and anthropic elasticities are calculated as fol-lows:
εP =1−F (φ)+φF′(φ)
P Robs
(16)
εE0= −F′(φ)
E0
Robs
(17)
εH= −
RH
Robs
, (18)
which satisfyεP +εE0+εH=1.
From Table 1 and Eq. (16), the elastic coefficientsεP,εE0,
andεH, which respectively represent the precipitation, evap-otranspiration, and human activities elasticities, can be calcu-lated. Next, the runoff changeRHcaused by human activities is computed. The contribution of human activities to runoff can be expressed byPH, wherePH=RH/1R, thus the con-tribution of climate change can also be calculated.
4 Results and discussion
4.1 Detection of hydrologic changes
Table 1.Different formulae for the Budyko hypothesis.
Expression F (φ) F′(φ)
Turc (1954); Pike (1964)
1+φ−2
−0.5
1/
φ3
1+(1/φ)2
1.5
Zhang (2001) (1+wφ) / (1+wφ+1/φ) w+2w/φ−1+1/φ2/ (1+wφ+1/φ)2
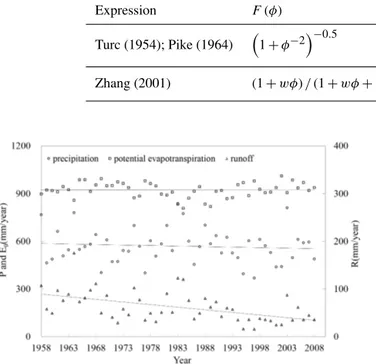
Figure 2.Time series of annual precipitation, annual potential evap-otranspiration and annual runoff in the Wei River basin from 1958 to 2008.
and potential evapotranspiration, and to analyze the trends in meteorological factors and corresponding runoff changes over nearly 50 years. Figure 2 shows time series of precipi-tation, potential evapotranspiration and runoff from 1958 to 2008, and the runoff series are observed at the hydrological gauging station located the river basin outlet. Qualitative in-spection shows that the trends in precipitation and potential evapotranspiration are not obvious, while runoff notably de-creases. The fluctuation range of potential evapotranspiration is not obvious in different years, but the fluctuation range of precipitation is significant, and its overall trends are stable. Thus, the decrease of runoff implies that precipitation and potential evapotranspiration are not the only influencing fac-tors on runoff, and instead human activities may have been the main influence on the decreasing runoff.
The Mann–Kendall test is also used to analyze the change point of the runoff in the Wei River basin, at a confidence level set to α=0.05. The normal distribution shows that the critical value wasUα/2=1.96. The result of the change-point test is presented in Fig. 3. It can be seen in Fig. 3 that the two curves intersect in 1990, and the intersection is within the critical value rangeUα/2= ±1.96. The result illustrates that an abrupt change of runoff occurred in 1990.
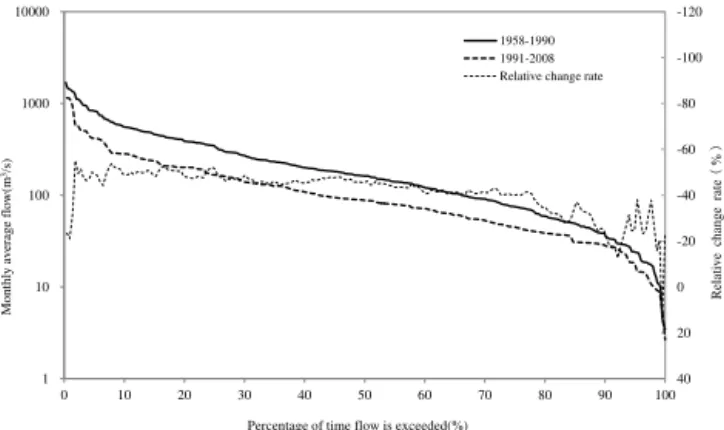
According to the results of trend analysis and change-point analysis, the monthly runoff data in the periods of 1958– 1990 and 1990–2008 is used to plot the flow duration curve (FDC) that indicates the runoff change of the basin in dif-ferent periods, and the monthly runoff series are observed at
30
-4 -2 0 2 4
1958 1968 1978 1988 1998 2008
sta
tist
ic
s
Year
UF UB
Figure 3.The result of the abrupt change-point test in the Wei River basin.
the hydrological gauging station located the river basin out-let. Vogel and Fennessey (1994) provide the details of the FDC method, which represents the relationship between the magnitude and frequency of runoff, and provides an esti-mate of the percentage of time a given runoff that is equal to or exceeds an historical period. The relationship between the magnitude and frequency of monthly average runoff are shown in Fig. 4, which indicates that the percentage of time runoff exceeded in the period 1958–1990 is larger than that for 1990–2008, and the runoff relative change for the two periods only have large fluctuations at percentages less than 10 % and more than 90 %. Figure 4 also implies the decrease of runoff for 1990–2008 correlates with human activities. Furthermore, the influence on decreasing runoff is facilitated by the high-flow and low-flow periods at which the percent-age time runoff exceeded is less than 10 % and more than 90 %.
4.2 Results of the original and improved climate elasticity methods
4.2.1 Original climate elasticity method
In order to evaluate the influence on runoff caused by cli-mate change, Eq. (11) is first used to calculate the elasticities of precipitation and potential evapotranspiration for 1958– 2008, which can be expressed asεP andεE0, respectively,
-120
-100
-80
-60
-40
-20
0
20
40 1
10 100 1000 10000
0 10 20 30 40 50 60 70 80 90 100 1958-1990
1991-2008 Relative change rate
Mont
hl
y
av
er
ag
e
fl
ow
(m
3/s)
R
el
at
iv
e
cha
ng
e
rat
e
⧊
%
⧋
Percentage of time flow is exceeded(%)
Figure 4.Flow duration curves under different periods in the Wei River basin.
increase by 15.8–17.7 %. Then, according to the calculated
εP,εE0 and Eq. (10), the runoff decrease caused by climate
change can be computed. The total contribution of precipi-tation and potential evapotranspiration to the runoff decrease is 32.1 mm. Therefore, the contribution of climate change to the runoff decrease is 37–40 %, and the contribution of hu-man activities is 60–63 %.
4.2.2 Improved climate elasticity method
In order to evaluate the influence on runoff caused by human activities, Eq. (16) is first used to calculate the elasticities of precipitation, potential evapotranspiration and human ac-tivities for 1958–2008, which can be expressed as εP,εE0
and εH, respectively, as shown in Table 3. We realize that if annual runoff decreases by 32.1 mm, the decrease caused by human activities is 22.9–24.9 mm. So the contribution of human activities to runoff decrease is 71–78 %, and the con-tribution of climate change is 22–29 %.
4.2.3 Comparison of the simulation results
In this paper, two methods are used to analyze the causes of the runoff decrease in the Wei River basin. One is the origi-nal climate elasticity method, and the other is the improved climate elasticity method. Each method adopts two formu-las based on the Budyko hypothesis (noting that one for-mula includes parameters and the other does not). Results are compared with each other and with those calculated by other methods, and the precision of the two methods is analyzed. Both methods are implemented at the annual timescale, and require relatively simple computation. The contributions of climate change and human activities to runoff variability can thus be computed by fewer data and parameters com-pared with other methods. The results of the original cli-mate elasticity method show that the contributions of clicli-mate change and human activities to runoff variability are 37–40 % and 60–63 %, respectively. Meanwhile, corresponding con-tributions calculated using the improved climate elasticity
method are 22–29 % and 71–78 %, respectively. Early studies showed that during the 1970–1995 period, the contribution of human activities to runoff decrease was 58.3 % in the Wei River basin (Zhang and Wang, 2007). In recent years, hu-man activities have intensified, so that by 2008 the contribu-tion of human activities most likely increased, and may now exceed 60 %. Gao et al. (2013) found that the contribution of human activities to reduced stream flow in the Wei River basin was even as high as 82.80 %. Zhan et al. (2014) used the SIMHYD model to partition the effects of climate change and human activities on surface runoff in the Wei River basin and found that the contribution rate of human activities to stream flow change was more than 65 %. The results of the improved climate elasticity method are closer to the exist-ing results than those of the original, suggestexist-ing that the im-proved climate elasticity method, which is more adaptable and easier to implement, is much more reliable and practical. Moreover, it is important to note that the improved cli-mate elasticity method is the first to introduce human activ-ities’ elasticityεH. Without the trend analysis and change-point test, the strength of the influence of human activities on runoff changes can be calculated. When calculating the con-tribution of human activities to runoff changes, the change-point test is needed so that the total runoff decrease can be calculated.
The improved climate elasticity method broadens the con-cept of climate elasticity, and provides a more intuitive and practical formula for calculating the contribution of human activities to runoff changes. Compared with the hydrologi-cal simulation method, the climate elasticity method not only needs fewer data and parameters, and is more reliable and easier to implement, but can also be easily extended. How-ever, its temporal resolution is low and it lacks a physical basis. There is a trend towards coupling hydrological simu-lations with the more reliable hydrological and meteorolog-ical statistmeteorolog-ical methods, to quantitatively study hydrologmeteorolog-ical responses to climate change and human activities.
4.3 Discussion
In this paper it is assumed that over a long period of time, change in catchment storage can be neglected, so that the water balance equation can be expressed asP =E+R. It is also assumed that the Budyko curve can comparably and pre-cisely estimate mean annual evaporation. In fact the two as-sumptions are fundamental and commonly used in Budyko-type elasticity studies for long-term averages (Gentine et al., 2012). We do not think there is an approach that can esti-mate the mean annual evaporation “precisely” but if any, the Budyko curve would be comparable at least for long-term means.
Table 2.Results of the original climate elasticity method.
Period Formula P /mm E0/mm εP εE0 1RC/mm 1RC/% 1RH/%
1958–2008 Turc (1954); Pike (1964) 569.3 923.1 2.77 −1.77 11.9 37 63 1958–2008 Zhang (2001) 569.3 923.1 2.58 −1.58 12.9 40 60
Table 3.Results of the improved climate elasticity method.
Period Formula P /mm E0/mm εp εE0 εH 1RH/mm 1RC/% 1RH/%
1958–2008 Turc (1954); Pike (1964) 569.3 923.1 3.53 −2.16 −0.37 22.9 29 71 1958–2008 Zhang (2001) 569.3 923.1 3.89 −2.49 −0.40 24.9 22 78
31 0.00
20.00 40.00 60.00 80.00
1958 1968 1978 1988 1998 2008
Ex
tr
em
e Pr
ecipitation
(
mm
)
Year The top five maximum daily precipitation
The maximum daily precipitation
Figure 5.The top five maximum daily precipitation and the maxi-mum daily precipitation curves.
rainfall and distribution, while the steady decrease in runoff investigated in this study would require a steady decrease in rainfall intensity if the change in distribution is the cause. Those results are consistent with our experience with this catchment in that precipitation and potential evapotranspira-tion are not the only influencing factors on runoff, but in-stead human activities have been the main influence on the decreasing runoff.
The impacts of human activities on runoff are reflected in land use and land cover changes. Land use and land cover change is a gradual process, and the impacts on runoff also accumulate gradually. We can decrease the uncertainty of quantitative predictions by analyzing the LUCC changes in the Wei River basin in 1980, 1990, 2000, 2005 and 2007, and then checking whether the results are reasonable. The main type of land cover in the Wei River basin is cultivated land, which covers more than 50 % of the total area, followed by woodland and grassland.
By analyzing the changing areas of cultivated land and woodland and grassland in the Wei River basin in 1980, 1990, 2000, 2005 and 2007, it can be concluded that the year 1990 is the turning point in cultivated land area, since the area decreases during the 1980–1990 period, and then begins to increase again after 1990. The year 1990 is also the
turn-ing point in the area of woodland and grassland area, but the corresponding trends are opposite to those of the cultivated area. Because the area of cultivated land and woodland and grassland reaches 90 %, and considering the turning points of the three types of land, the year 1990 can be regarded as a more general turning point in surface characteristics (Song et al., 2012). This decreases the uncertainty regarding 1990 as the runoff change point.
Major sources of uncertainty in the simulation associ-ated with the climate elasticity may arise from the input data, classification of the stages, and the parameter in the Zhang (2001) formula. Precipitation data used in the models are from seven rain gauges and meteorological stations in and around the study catchment. The flow data are measured dur-ing the 1958–2008 period from the Hua County hydrological station, which is located at the downstream end of the basin, but may not sufficiently represent the whole basin. Even though the breakpoint test is found to be reasonable, there remain some uncertainties, which may be caused by the test method and artifacts when reading the results in the chart. The parameter which is very sensitive in the Zhang (2001) formula is calibrated according to the land cover and land use conditions.
Furthermore, it is essential to point out that climate change and human activities are supposed to be two mutually inde-pendent variables when separating their impacts on runoff; however, we note that land use and land cover can be influ-enced by both climate change and by human activities.
In this studyR is divided into Robs andRH because the water intake directly from rivers is a significant amount in almost all rivers in China. However, in the original Budyko-type elasticity, this part is not considered directly and the main formulae are1R=εPdPP +εE0
dE0
E0 and1R=1RC+
1RH. Then that framework is extended by including the di-rect influence from water intake to adapt to catchments with intense water consumption and intake, and the main for-mula is1R=εPdPP +εE0
dE0
E0 +εH
dRH
RH . We believe this is
5 Conclusions
Decreasing runoff in many rivers in China has been reported in recent years, and the Wei River basin is one of the most serious cases. This paper aims at developing a new approach to quantifying the impact of climate variations and human activities on this decreasing runoff in the Wei River basin. The man-made changes here include land use, vegetation, and other land surface conditions, while climate change and climate variability are reflected in precipitation and potential evapotranspiration. This study uses the Mann–Kendall test to assess the temporal trends in precipitation, potential evapo-transpiration and runoff, and also analyzes the point of abrupt change. On this basis, the original climate elasticity method and improved climate elasticity method are used to analyze the quantitative hydrological effects of climate change and human activities; these findings are then compared to exist-ing results from the hydrological simulation method. This study shows the following:
In the last 50 years, the runoff from the Wei River basin has obviously decreased, but the precipitation and potential evap-otranspiration have shown no clear trend. Therefore it can be seen that climate factors have not obviously contributed to the runoff decrease.
From 1958 to 2008, the runoff in the Wei River basin shows an abrupt change in 1990, effectively dividing the total runoff into natural runoff processes and runoff pro-cesses affected by human activities. At the same time, this change shows that human activities have significant effects on runoff.
Human activities resulted in a shift in land use and land cover in 1990, and the type of land use and land cover has a great influence on runoff. This illustrates that human activi-ties, especially those causing land use and land cover change, are the main reason for the runoff decrease.
The original climate elasticity method shows that the con-tributions of climate change and human activities to runoff decrease are 37–40 % and 60–63 %, respectively, but the im-proved climate elasticity method indicated that the contribu-tions of climate change and human activities to runoff de-crease are 22–29 % and 71–78 %, respectively. The result of the improved climate elasticity method is closer to those re-sults based on comprehensive hydrological models, thereby demonstrating that human activities are the main reason for the runoff decrease in the Wei River basin.
Acknowledgements. This work was partially supported by the National Natural Science Foundation of China (41271003, 41371043, 50939006), Key Project for the Strategic Science Plan in IGSNRR, Chinese Academy of Sciences (2012ZD003), and the Open Research Fund of State Key Laboratory of Simulation and Regulation of Water Cycle in River Basin (China Institute of Water Resources and Hydropower Research) (IWHR-SKL-201311).
Edited by: F. Tian
References
Bao, Z. X., Zhang, J. Y., Wang, G. Q., Fu, G. B., He, R. M., Yan, X. L., Jin, J. L., Liu, Y. L., and Zhang, A. J.: Attribution for de-creasing runoff of the Haihe River baisn, northern China: Climate variability or human activities?, J. Hydrol., 460–461, 117–129, 2012.
Chen, J. X., Xia, J., Zhao, C. S., Zhang, S. F., Fu, G. B., and Ning, L. K.: The mechanism and scenarios of how mean annual runoff varies with climate change in Asian monsoon areas, J. Hydrol., 517, 595–606, doi:10.1016/j.jhydrol.2014.05.075, 2014 Chiew, F. H. S.: Estimation of rainfall elasticity of streamflow in
Australia, Hydrol. Sci. J., 51, 613–625, 2006.
Dooge, J. C. I., Bruen, M., and Parmentier, B.: A simple model for estimating the sensitivity of runoff to long-term changes in precipitation without a change in vegetation, Adv. Water Resour., 23, 153–163, 1999.
Fu, G., Charles S. P., and Chiew, F. H. S.: A two-parameter climate elasticity of runoff index to assess climate change effects on annual runoff, Water Resour. Res., 43, W11419, doi:10.1029/2007WR005890, 2007.
Gao, P., Geissen, V., Ritsema, C. J., Mu, X.-M., and Wang, F.: Im-pact of climate change and anthropogenic activities on stream flow and sediment discharge in the Wei River basin, China, Hy-drol. Earth Syst. Sci., 17, 961–972, doi:10.5194/hess-17-961-2013, 2013.
Gentine, P., D’Odorico, P., Lintner, B. R., Sivandran, G., and Salvucci, G.: Interdependence of climate, soil, and vegetation as constrained by the Budyko curve, Geophys. Res. Lett., 39, L19404, doi:10.1029/2012GL053492, 2012.
Govinda, R. P.: Effect of climate change on stream flows in the Ma-hanadi river basin, India, Water Int., 20, 205–212, 1995. Guo, H., Hu, Q., and Jiang, T.: Annual and seasonal runoff
re-sponses to climate and land-cover changes in the Poyang Lake basin, China, J. Hydrol., 355, 106–122, 2008.
Hargreaves, G. H. and Samani, Z. A.: Estimating of potential evap-otranspiration, J. Irrig. Drain. Divdide, Proceedings of the Amer-ican Society of Civil Engineers, 108, 223–230, 1982.
He, H. M., Zhang, Q. F., Zhou, J., Fei, J., and Xie, X. P.: Coupling climate change with hydrological dynamic in Qinling Mountains, China, Clim. Change, 94, 409–427, 2009.
Hu, S. S., Zheng, H. X., Liu, C. M., Yu, J. J., and Wang, Z. G.: As-sessing the Impacts of Climate Variability and Human Activities on Streamflow in the Water Source Area of Baiyangdian Lake, Acta Geogr. Sinica, 67, 62–70, 2012.
IPCC: Climate Change 2013: The Physical Science Basis, avail-able at: http://www.buildingclimatesolutions.org/view/article/ 524b2c2f0cf264abcd86106a (last access: 20 December 2013), 2013.
Kendall, M. G.: Rank Correlation Measures, Charles Griffin, Lon-don, 1975.
Legesse, D., Vallet-Coulomb, C., and Gasse, F.:Hydrological re-sponse of a catchment to climate and land use changes in Trop-ical Africa: case study South Central Ethiopia, J. Hydrol., 275, 67–85, 2003.
Ma, H., Yang, D. W., Tan, S. K., Gao, B., and Hu, Q. F. :Impact of climate variability and human activity on streamflow decrease in Miyun Reservoir catchment, J. Hydrol., 389, 317–324, 2010. Ma, Z. M., Kang, S. Z., Zhang, L., Tong, L., and Su, X. L.: Analysis
of impacts of climate change and human activity on runoff for a river basin in arid region of northwest China, J. Hydrol., 352, 239–249, 2008.
Mann, H. B.: Nonparametric tests against trend. Econometrica, J. Econometric Soc., 13, 245–259, 1945.
Milly, P. C. D. and Dunne, K. A.: Macro-scale water fluxes 2. Water and energy supply control of their inter-annual variability,Water Resour. Res., 38, 241–249, doi:10.1029/2001WR000760, 2002. Milly, P. C. D., Dunne, K. A., and Vecchia, A. V.: Global pattern
of trends in runoff and water availability in a changing climate, Nature, 438, 347–350, 2005.
Nash, L. L. and Gleick, P. H.: Sensitivity of streamflow in the Colorado basin to climatic changes, J. Hydrol., 125, 221–241, doi:10.1016/0022-1694(91)90030-L, 1991.
Piao, S. L., Friedlingstein, P., Ciais, P., de Noblet-Ducoudre, N., Labat, D., and Zaehle, S.: Changes in climate and land use have a larger direct impact than rising CO2on global river runoff trends, Proc. Natl. Acad. Sci, 104, 15242–15247, 2007.
Pike, J. G.: The estimation of annual run-off from meteorological data in a tropical climate, J. Hydrol., 2, 116–123, 1964. Qiu, G. Y., Yin, J., and Shu, G.: Impact of climate and land-use
changes on water security for agriculture in Northern China, J. Integrat. Agr., 11, 144–150, 2012.
Revelle, R. R. and Waggoner, P. E.: Effects of a carbon dioxidein-duced climatic change on water supplies in the western United States, in: Changing Climate, 419–432, Natl. Acad., Washing-ton, D.C., 1983.
Risbey, J. S. and Entekhabi, D.: Observed Sacramento basin stream-flow response to precipitation and temperature changes and its relevance to climate impact studies, J. Hydrol., 184, 209–223, doi:10.1016/0022-1694(95)02984-2, 1996.
Sankarasubramanian, A., Vogel, R. M., and Limbrunner, J. F.: Cli-mate elasticity of runoff in the United States, Water Resour. Res., 37, 1771–1781, doi:10.1029/2000WR900330, 2001.
Schaake, J. C. and Waggoner, P. E.: From climate to flow, Climate change and US water resources, 177–206, 1990.
Song, J. X., Xu, Z. X., Liu, C. M., and Li, H. E.: Ecological and environmental instream flow requirements for the Wei River – the largest tributary of the Yellow River, Hydrol. Process., 21, 1066–1073, 2007.
Song, W. N., Zhan, C. S., Li, J. Y., Xu, Z. X., and Wang, H. X.: Re-mote Sensing Analysis on the Spatial-temporal Characteristics of LUCC in the Guanzhong Plain Region of the Wei River Basin in the Past 30 years, China Land Sci., 2, 56–62, 2012 (in Chinese).
Sun, F., Roderick, M. L., and Farquhar, G. D.: Changes in the variability of global land precipitation, Geophys, Res. Lett., 39, L19402, doi:10.1029/2012GL053369, 2012.
Sun, Y., Tian, F. Q., Hu, H. P., and Yang, L.: Attributing streamflow decrease to variations in climate conditions and catchment prop-erties across the Upper Han River basin, China, J. Hydrol., 508, 170–180, 2014.
Tang, Y., Tang, Q., Tian, F., Zhang, Z., and Liu, G.: Responses of natural runoff to recent climatic variations in the Yellow River basin, China, Hydrol. Earth Syst. Sci., 17, 4471–4480, doi:10.5194/hess-17-4471-2013, 2013.
Turc, L.: Le bilan d’eau des sols. Relations entre les precipita-tions,l’evaporation et l’ecoulement, Ann. Agronomy, 5, 491– 596, 1954.
Vogel, R. M. and Fennessey, N. M.: Flow-duration curves. I: New interpretation and confidences intervals, J. Water Resour. Plann. Manage., 120, 485–504, 1994.
Vogel, R. M., Wilson, I., and Daly, C.: Regional regression models of annual streamflow for the United States, J. Ir-rig. Drain. Eng., 125, 148–157, doi:10.1061/(ASCE)0733-9437(1999)125:3(148), 1999.
Wang, G. S., Xia, J., and Chen, J.: Quantification of effects of climate variations and human activities on runoff by a monthly water balance model: a case study of the Chaobai River basin in northern China, Water Resour. Res., 45, W00A11, doi:10.1029/2007WR006768, 2009.
Zhan, C., Zeng, S., Jiang, S., Wang, H., and Ye, W.: An Integrated Approach for Partitioning the Effect of Climate Change and Hu-man Activities on Surface Runoff, Water Resour. Manage., 28, 3843–3858, 2014.
Zhang, J. Y. and Wang, G. Q.: Research on climate change impact on hydrology and water resources[M], 2007 (in Chinese). Zhang, L., Dawes, W. R., and Walker, G. R.: Response of mean
an-nual evapotranspiration to vegetation changes at catchment scale, Water Resour. Res. 37, 701–708, 2001.
Zhang, X. P., Zhang, L., Zhao, J., Rustomji, P., and Hairsine, P.: Response of streamflow to changes in climate and land use/cover in the Loess Plateau, China, Water Resour. Res., 44, W00A07, doi:10.1029/2007WR006711, 2008.