Hydrol. Earth Syst. Sci., 17, 961–972, 2013 www.hydrol-earth-syst-sci.net/17/961/2013/ doi:10.5194/hess-17-961-2013
© Author(s) 2013. CC Attribution 3.0 License.
Geoscientiic
Geoscientiic
Hydrology and
Earth System
Sciences
Open Access
Impact of climate change and anthropogenic activities on stream
flow and sediment discharge in the Wei River basin, China
P. Gao1,4,5, V. Geissen2,4, C. J. Ritsema3,4, X.-M. Mu1,5, and F. Wang1,5
1State Key Laboratory of Soil Erosion and Dryland Farming on the Loess Plateau, Institute of Soil and Water Conservation of Northwest A & F University, 712100 Yangling, Shaanxi, China
2Land Dynamic Group, University of Wageningen, P.O. Box 47, 6700 AA Wageningen, the Netherlands 3Land Degradation and Development Group, University of Wageningen, P.O. Box 47,
6700 AA Wageningen, the Netherlands
4Alterra, Wageningen University and Research Center, P.O. Box 47, 6700 AA Wageningen, the Netherlands 5Institute of Soil and Water Conservation of Chinese Academy of Sciences and Ministry of Water Resources, 712100 Yangling, Shaanxi, China
Correspondence to:X.-M. Mu ([email protected])
Received: 14 March 2012 – Published in Hydrol. Earth Syst. Sci. Discuss.: 27 March 2012 Revised: 27 December 2012 – Accepted: 18 February 2013 – Published: 5 March 2013
Abstract.Reduced stream flow and increased sediment dis-charge are a major concern in the Yellow River basin of China, which supplies water for agriculture, industry and the growing populations located along the river. Similar con-cerns exist in the Wei River basin, which is the largest trib-utary of the Yellow River basin and comprises the highly eroded Loess Plateau. Better understanding of the drivers of stream flow and sediment discharge dynamics in the Wei River basin is needed for development of effective man-agement strategies for the region and entire Yellow River basin. In this regard we analysed long-term trends for wa-ter and sediment discharge during the flood season in the Wei River basin, China. Stream flow and sediment discharge data for 1932 to 2008 from existing hydrological stations located in two subcatchments and at two points in the Wei River were analysed. Precipitation and air temperature data were analysed from corresponding meteorological stations. We identified change-points or transition years for the trends by the Pettitt method and, using double mass curves, we di-agnosed whether they were caused by precipitation changes, human intervention, or both. We found significant decreas-ing trends for stream flow and sediment discharge durdecreas-ing the flood season in both subcatchments and in the Wei River it-self. Change-point analyses further revealed that transition years existed and that rapid decline in stream flow began in 1968 (P <0.01), and that sediment discharge began in 1981
(P <0.01) in the main river. In the two subcatchments, the transition years were 1985 (P <0.01) and 1994 (P <0.05) for water discharge, and 1978 and 1979 for sediment dis-charge (P <0.05), respectively. The impact of precipitation or human activity on the reduction amount after the transi-tion years was estimated by double mass curves of precip-itation vs. stream flow (sediment). For reductions in stream flow and sediment discharge, the contribution rate of human activity was found to be 82.80 and 95.56 %, respectively, and was significantly stronger than the contribution rate of pre-cipitation. This evidence clearly suggests that, in the absence of significant decreases in precipitation, strategies for man-aging the region need to focus on human activities to control erosion without restricting stream flow.
1 Introduction
including the construction of terraces, dams and reservoirs, conversion of croplands to grasslands and woodlands, and vegetation restoration (Lee, 1984; Yu, 2006). As a result both sediment discharge and water flow have been significantly reduced. Meanwhile, the precipitation did not significantly decrease – not only in distinctive sub-basins but in the entire Yellow River basin (Ren, 2006; Yu, 2006; Fu et al., 2007; Mu et al., 2007; H. J. Wang et al., 2007; Gao, 2010). Although several existing studies verify that total amounts of stream flow and sediment discharge have decreased significantly in the Yellow River, scientific consensus on the magnitudes of the decreases and the quantitative effect of each driving fac-tor (nature vs. human) has not yet been reached (Huang and Zhang, 2004; Mu et al., 2007; H. J. Wang et al., 2007). Fu et al. (2007) stated that climate variability had a significant impact on stream flow in the Yellow River and that stream flow was sensitive to both precipitation and temperature in the basin. H. J. Wang et al. (2007) and Gao et al. (2011) found that a decrease in precipitation is responsible for only 30 % of the decrease in stream flow and 20 % of the sediment discharge reduction, while the remaining 70 and 80 % are as-cribed to human activities in the Yellow River basin. Better understanding of the relative impact of these driving factors, i.e. climate variation and human activity, on the hydrological regime and sediment dynamics in this region is needed for development of effective conservation strategies not only in distinctive sub-basins but also the entire Yellow River basin. Most of the runoff in the Loess Plateau is generated by ex-cess rain, which occurs during the many short-duration, high-intensity rainstorms in the flood season (June to September). Several studies indicate that a few intensive rainstorms in this time of the year produce most of the runoff and sedi-ment. The sediment discharge in the flood season accounted for nearly 90 % of the total sediment for the year in the Wei River (Chen, 1996; Zhu et al., 2008). Therefore, in this study, we used data from the flood season to analyse the impact of climate change and anthropogenic activities on changes in stream flow and sediment discharge over the last 70 yr. We (a) identified trends and change-points for stream flow and sediment discharge in the flood season in two major sub-catchments and the middle and downstream areas of the Wei River; (b) analysed the impacts of precipitation and/or hu-man activities on the changes; and (c) estimated the rela-tive effects of these main driving factors on both stream flow and sediment discharge by comparing two contrasting peri-ods before and after the transition years. The findings of this study contribute valuable information for evaluation and im-plementation of long-term sustainable regional planning and land management.
2 Study area and data sets
2.1 Study area
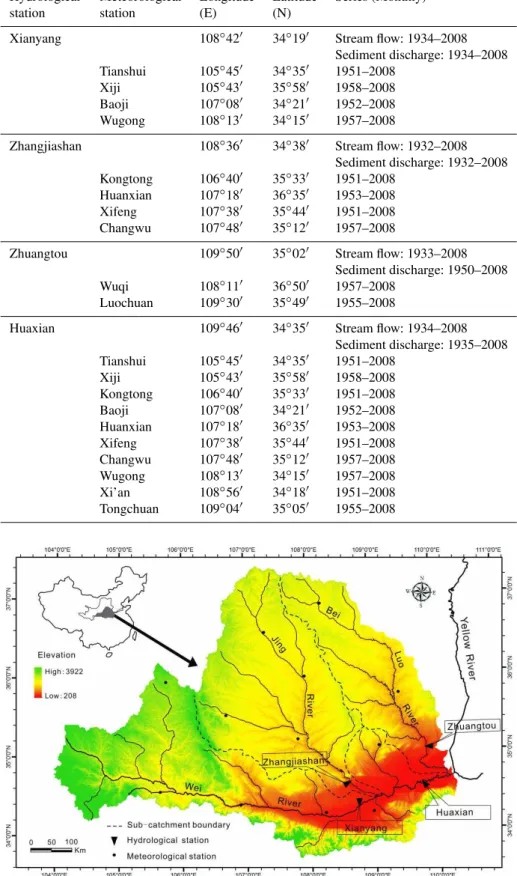
The Wei River is the largest tributary of the Yellow River. It originates north of Niaosu Mountain in Gansu Province, flows about 800 km through Gansu and Shaanxi Province, across the Loess Plateau, and eventually into the Yellow River at Tongguan County. The whole basin is 135 000 km2 in size. The two largest tributaries of the Wei River are the Jing River and Beiluo River which are also often consid-ered to be major tributaries of the Yellow River. Traditionally this area is known as the Jing-Luo-Wei Region. We therefore included the two subcatchments containing these rivers, the Jing River subcatchment (45 421 km2) and Beiluo River sub-catchment (26 905 km2) as well as the Wei River main stream in this study (Fig. 1).
2.2 Data sets
A data set compiled from 12 meteorological stations with long-term monthly precipitation data and annual air temper-ature data (1951–2008) in the Wei River basin was analysed (Fig. 1 and Table 1). This data was provided by The Na-tional Meteorological Information Centre (NMIC). Stream flow and sediment discharge data came from four hydrologi-cal stations within the Wei River basin, two key stations (Xi-anyang and Huaxian), located midway and downstream of the Wei River mainstream, and two stations in the Jing and Beiluo subcatchments (Zhangjiashan and Zhuangtou) (Fig. 1 and Table 1). Monthly stream flow and sediment discharge data at the four stations from 1932 to 2008 were obtained from the Chinese River stream flow and Sediment Commu-niques, the Ministry of Water Resources of PRC (People’s Republic of China) (MWR). We also got the 1980 and 2005 land use data for the study region. The land use data was pro-vided by the National Science and Technology Infrastructure Center, Data-Sharing Network of China Earth System Sci-ence (www.geodata.cn). ArcGIS was used to process the land use data. All measured data used in this study are of good quality and were checked for quality control by correspond-ing agencies.
3 Analysis methods
3.1 Selection of the flood season for data analysis
Table 1.The location and data series of the hydrologic and corresponding meteorological stations.
Hydrological Meteorological Longitude Latitude Series (Monthly) station station (E) (N)
Xianyang 108◦42′ 34◦19′ Stream flow: 1934–2008
Sediment discharge: 1934–2008 Tianshui 105◦45′ 34◦35′ 1951–2008
Xiji 105◦43′ 35◦58′ 1958–2008
Baoji 107◦08′ 34◦21′ 1952–2008 Wugong 108◦13′ 34◦15′ 1957–2008
Zhangjiashan 108◦36′ 34◦38′ Stream flow: 1932–2008 Sediment discharge: 1932–2008 Kongtong 106◦40′ 35◦33′ 1951–2008
Huanxian 107◦18′ 36◦35′ 1953–2008
Xifeng 107◦38′ 35◦44′ 1951–2008
Changwu 107◦48′ 35◦12′ 1957–2008
Zhuangtou 109◦50′ 35◦02′ Stream flow: 1933–2008
Sediment discharge: 1950–2008 Wuqi 108◦11′ 36◦50′ 1957–2008
Luochuan 109◦30′ 35◦49′ 1955–2008
Huaxian 109◦46′ 34◦35′ Stream flow: 1934–2008
Sediment discharge: 1935–2008 Tianshui 105◦45′ 34◦35′ 1951–2008
Xiji 105◦43′ 35◦58′ 1958–2008 Kongtong 106◦40′ 35◦33′ 1951–2008
Baoji 107◦08′ 34◦21′ 1952–2008
Huanxian 107◦18′ 36◦35′ 1953–2008
Xifeng 107◦38′ 35◦44′ 1951–2008
Changwu 107◦48′ 35◦12′ 1957–2008
Wugong 108◦13′ 34◦15′ 1957–2008
Xi’an 108◦56′ 34◦18′ 1951–2008 Tongchuan 109◦04′ 35◦05′ 1955–2008
3.2 Analysis of developments over time
Based on the results of Sect. 3.1, we analysed the develop-ment of precipitation, stream flow and sedidevelop-ment discharge in the flood seasons from 1932 to 2008 (discharge) and from 1951 to 2008 (precipitation), respectively, by the following methods.
3.2.1 Trend test to detect changes in time
To analyse the trends for precipitation, air temperature, stream flow and sediment discharge (Table 1) we used the rank-based, non-parametric Mann–Kendall statistical test (Mann, 1945; Kendall, 1975). This is commonly used for trend detection due to its robustness for non-normally dis-tributed and censored data, which are frequently encoun-tered in hydroclimatic time series (e.g. Hirsch et al., 1982; Burn and Elnur, 2002; Yue et al., 2003; Yue and Pilon, 2004; Gao et al., 2010). In this work the trend-free pre-whitening (TFPW) method of Yue et al. (2003) was used to remove any significant linear trend from the raw time series and se-rial correlation. AZstatistic was obtained from the Mann– Kendall test on the whitened series from TFPW method. A negative value of Z indicates a downward trend, and vice versa.
3.2.2 Change-point analysis to detect the transition year
We used the non-parametric approach developed by Pet-titt (1979) to detect change-points in the air temperature, stream flow, and sediment discharge time series, as well as for the precipitation data. This method detects a significant change in the mean of a time series when the exact time of the change is unknown. The test uses a version of the Mann– Whitney statistic Ut,N, that tests whether two sample sets
x1, ...xt andxt+1, ...xNare from the same population. The
test statisticUt,N is given by
Ut,N =Ut−1,N + N
X
j=1
s g n Xt −Xj
for t=2, ..., N (1)
and
if Xt −Xj>0, s g n Xt −Xj=1
if Xt −Xj=0, s g n Xt −Xj=0
if Xt −Xj<0, s g n Xt −Xj= −1
. (2)
The test statistic counts the number of times a member of the first sample exceeds a member of the second sample. The null hypothesis of the Pettitt’s test is the absence of a change-point. The test statisticKNand the associated probability (P)
used in the test are given as
KN =max1≤t≤N
Ut,N
, (3)
P ∼=2 exp n
−6(KN)2/
N3+N2o. (4)
3.2.3 Double mass curve to detect impact of precipitation and human activity
Double mass curve is a simple, visual and practical method, and it is widely used in the study of the consistency and long-term trend test of hydro-meteorological data. This method was first used to analyse the consistency of precipitation data in the Susquehanna watershed, United States, by Mer-riam (1937), and Searcy et al. (1960) made a theoretical ex-planation of it. The theory of the double mass curve is based on the fact that a plot of the two cumulative quantities dur-ing the same period exhibits a straight line so long as the proportionality between the two remains unchanged, and the slope of the line represents the proportionality. This method can smooth a time series and suppress random elements in the series, and thus show the main trends of the time series. Over the last 30 yr, the effects of soil and water conserva-tion measures and land use/cover changes on stream flow and sediment have been analysed using the double mass curve method, with good results (Mu et al., 2010). In this study, double mass curves of precipitation vs. stream flow and pre-cipitation vs. sediment discharge were plotted for two differ-ent periods (before and after change-point year) to estimate changes in regression slope (proportionality). In addition, the double mass curves were also used to quantify the overall ef-ficiency of soil conservation measures before and after transi-tion years, which was estimated by the change-point analysis To estimate the relative impact of precipitation and/or hu-man activity on the reduction of total stream flow and sedi-ment discharge for the period after the transition years, the information on these two factors and precipitation before the transition years were used to establish regression equa-tions, and to further extrapolate the cumulative stream flow and sediment discharge to 2008. Calculated cumulative wa-ter flow (Rc) and sediment discharge (Sc) were based on the assumption that environmental conditions, including human impacts in the basin, in the period before the transition years remained unchanged in the period after the transition years. The difference between calculated and observed stream flow and sediment discharge for 2008 is considered to be the cu-mulative amount which is impacted by human activities.
Table 2.The transition matrix of land use change and total area of different land use in 2005 and 1980 in the Wei River basin (land use in km2).
1980/ Forestland Grassland Dry Irrigated Residential Water Vegetation Total
2005 farmland land cover<5 % in 2005
Forestland 19 909 481 270 9.25 0.00 0.50 36.7 20 706 Grassland 357 49 974 701 21.5 1.00 8.25 2.50 51 065 Dry farmland 21.0 453 45 004 5.00 0.50 26.7 1.75 45 512 Irrigated land 4.75 78.7 28.2 14 629 0.75 40.7 0.75 14 783 Residential 23.0 17.0 373 181 1304 1.50 0.25 1899 Water 5.00 25.2 49.5 12.2 0.00 823 0.00 915 Vegetation cover<5 % 0.75 0.75 2.75 0.00 0.00 0.00 138 142 Total in 1980 20 321 51 029 46 428 14 857 1306 901 180 135 022
Bold – no changes in 1980 and 2005; normal – land use changes in 1980 and 2005.
4 Results and discussion
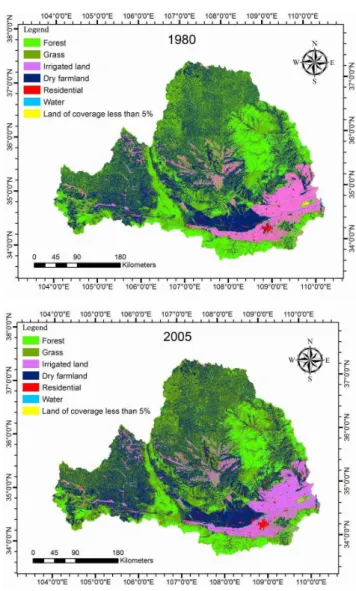
4.1 Land use changes in Wei River basin
No significant land use changes took place in the Wei River catchment in 1980 and 2005 (Table 2 and Fig. 2). The total area has a size of 135 022 km2. Comparing land use in 1980 and 2005, there was a net increase of 592 km2in residential areas (45 % of the total area for this land use in 1980), fol-lowed by forestland (385 km2, 1.90 %), grassland (36 km2, 0.07 %) and water and wetland (14 km2, 1.58 %). In contrast, the area of dry farmland, irrigated land and desert decreased markedly. Dry farmland decreased 916 km2 (1.97 % of the total area for this land use in 1980), followed by irrigated land (74 km2, 0.50 %) and land with less than 5 % vegetation cover (37 km2, 21 %).
4.2 Seasonal distribution of precipitation, stream flow and sediment discharge
The distribution of monthly precipitation, stream flow and sediment discharge is extremely uneven and mainly concen-trated in the flood season (June–September) (Table 3). Pre-cipitation in the flood season accounted for more than 60 % of the total precipitation for the year. Stream flow from June to September accounted for more than 50 % of total flow vol-ume. And the sediment discharge in this period accounted for nearly 90 %. Therefore, the analysis of trends and change-points were based on data from June–September.
4.3 Long-term trends and change-point year for precipitation, stream flow and sediment discharge in the flood season
There was no significant trend for precipitation at the Huax-ian, Zhangjiashan and Zhuangtou stations from 1951 to 2009. However, at Xianyang station, precipitation decreased significantly (p <0.05). Stream flow and sediment discharge
–
– – –
≤
Fig. 3.Observed precipitation, stream flow and sediment discharge in the flood season (June–September) at:(a)Xianyang – Wei River middle station,(b)Zhangjiashan – Jing River,(c)Zhuangtou – Beiluo River,(d)Huaxian – Wei River downstream hydrological stations in the Wei River basin. The horizontal solid lines present the mean values for the flood season, the horizontal dashed lines indicate the trend line, the vertical dashed lines indicate the transition years, theZstatistic was obtained from the Mann–Kendall test (∗∗:p <0.01,∗:p <0.05, ns: not significant atp≤0.05).
on the other hand decreased significantly at all four stations from 1932 to 2008 (Fig. 3).
For stream flow, 1968 (P <0.01) was the change-point year for the mainstream (Xianyang and Huaxian) sta-tions, and 1985 (P <0.01) and 1994 (P <0.05) were the
transition years for the Zhangjiashan and Zhuangtou stations, respectively.
Table 3.Distribution of monthly precipitation, stream flow and sediment in the Wei River basin (P= mean precipitation,R= mean stream flow,S= mean sediment discharge).
Item Jan Feb Mar Apr May Jun Jul Aug Sep Oct Nov Dec Year Jun–Sep
Xianyang P(mm) 5.2 7.8 19.5 39.4 55.5 65.8 98.6 99.0 93.4 50.4 16.2 3.9 554.6 356.9 Percentage 0.9 % 1.4 % 3.5 % 7.1 % 10.0 % 11.9 % 17.8 % 17.9 % 16.8 % 9.1 % 2.9 % 0.7 % 100 % 64.3 %
R(108m3) 1.3 1.2 1.6 2.6 3.5 3.0 5.8 6.0 8.7 6.6 3.1 1.6 45.0 23.6 Percentage 2.8 % 2.6 % 3.5 % 5.7 % 7.8 % 6.6 % 13.0 % 13.4 % 19.3 % 14.6 % 6.9 % 3.6 % 100 % 52.4 %
S(106t) 0.1 0.1 0.6 2.2 5.1 10.1 35.3 42.3 21.9 6.3 0.8 0.1 124.9 109.5 Percentage 0.1 % 0.1 % 0.5 % 1.8 % 4.1 % 8.1 % 28.3 % 33.9 % 17.5 % 5.1 % 0.6 % 0.1 % 100 % 87.7 %
Huaxian P(mm) 5.3 7.7 19.0 37.0 52.7 62.0 103.6 98.7 87.7 47.8 16.8 4.2 542.6 352.1 Percentage 1.0 % 1.4 % 3.5 % 6.8 % 9.7 % 11.4 % 19.1 % 18.2 % 16.2 % 8.8 % 3.1 % 0.8 % 100 % 64.9 %
R(108m3) 1.9 2.0 2.7 4.1 5.5 4.6 10.1 11.1 14.1 10.9 5.2 2.6 74.8 39.9 Percentage 2.6 % 2.6 % 3.6 % 5.5 % 7.4 % 6.1 % 13.5 % 14.8 % 18.8 % 14.5 % 7.0 % 3.4 % 100 % 53.3 %
S(106t) 0.2 0.2 0.8 3.5 9.9 19.5 114.2 133.6 53.9 12.2 1.6 0.3 350.0 321.3 Percentage 0.0 % 0.1 % 0.2 % 1.0 % 2.8 % 5.6 % 32.6 % 38.2 % 15.4 % 3.5 % 0.5 % 0.1 % 100 % 91.8 %
Zhangjiashan P(mm) 4.6 6.4 16.4 32.6 48.9 58.8 106.3 100.1 80.0 41.5 14.0 3.4 512.9 345.2 Percentage 0.9 % 1.2 % 3.2 % 6.4 % 9.5 % 11.5 % 20.7 % 19.5 % 15.6 % 8.1 % 2.7 % 0.7 % 100 % 67.3 %
R(108m3) 0.4 0.6 0.9 0.7 0.9 0.9 2.7 3.4 2.5 1.7 1.0 0.6 16.4 9.6 Percentage 2.6 % 3.5 % 5.6 % 4.4 % 5.4 % 5.7 % 16.7 % 20.8 % 15.2 % 10.4 % 6.1 % 3.4 % 100 % 58.5 %
S(106t) 0.0 0.0 0.4 1.1 6.3 13.7 86.3 98.9 23.5 2.4 0.3 0.0 232.9 222.4 Percentage 0.0 % 0.0 % 0.2 % 0.5 % 2.7 % 5.9 % 37.1 % 42.4 % 10.1 % 1.0 % 0.1 % 0.0 % 100 % 95.5 %
Zhuangtou P(mm) 4.8 7.2 18.0 32.2 45.1 61.4 114.1 113.5 82.6 40.1 14.9 3.9 537.7 371.6 Percentage 0.9 % 1.3 % 3.3 % 6.0 % 8.4 % 11.4 % 21.2 % 21.1 % 15.4 % 7.5 % 2.8 % 0.7 % 100 % 69.1 %
R(108m3) 0.3 0.3 0.5 0.5 0.4 0.4 1.1 1.5 1.1 0.8 0.5 0.3 7.8 4.1 Percentage 3.2 % 4.0 % 6.9 % 6.0 % 5.7 % 5.7 % 14.4 % 18.9 % 13.7 % 10.6 % 6.9 % 4.0 % 100 % 52.8 %
S(106t) 0.0 0.0 0.1 0.2 0.8 3.8 29.0 33.5 7.5 0.8 0.0 0.0 75.7 73.8 Percentage 0.0 % 0.0 % 0.1 % 0.3 % 1.1 % 5.1 % 38.3 % 44.2 % 9.9 % 1.1 % 0.0 % 0.0 % 100 % 97.4 %
were 1978 (Zhangjiashan station) (P <0.05) and 1979 (Zhuangtou) (P <0.05), respectively.
The trends and change-points for sediment discharge were very similar at all four stations and the transition years all ranged between 1978 and 1981. This indicates that the change in sediment discharge was similar throughout the whole basin. It also implies that the impact of external factors on the sediment discharge is consistent throughout the whole basin. However for stream flow, the change-point years are very different at the four stations. The transition year (1968) in the main river is 17 and 26 yr earlier than the transi-tion years in the sub-basins (1985 and 1994 for the Jing and Beiluo rivers, respectively). Soil and water conservation measures (mainly focused on planting trees and grass) and agricultural irrigation were major human activities before the 1980s. Vegetation cut down the soil erosion effectively and reduced the sediment in the river. However, the influence of vegetation on runoff is much smaller than the sediment in-terception. Agricultural irrigation plays a major role in the stream flow reduction. The area around the main stream of the Wei River is the main grain-producing area for agricul-ture. More water diversion/extraction for large-scale irriga-tion in this area has caused the stream flow reducirriga-tion in the main stream of Wei River since the 1960s. By contrast, the demand for and use of water in the subcatchment areas was lower and therefore there was a slower stream flow response. After the mid-1980s, the soil and water conservation engi-neering measures played a very important role in the stream flow reduction. These results also indicate that the impacts of
human activity on sediment discharge and on stream flow are different.
4.4 The changes of the air temperature
There was a significant increasing trend for temperature in the Wei River basin from 1951 to 2008 (P <0.01), and 1993 (P <0.01) was the change-point year (Fig. 4). Previous stud-ies have shown that the impact of temperature on the stream flow is uncertain. In some studies, the stream flow increased with increasing temperature (Fan et al., 2011); but in some other watersheds the stream flow decreased with increasing temperature (Cai and Cowan, 2008; Tang et al., 2012). In this study, the stream flow decreased with increasing temperature. In general, the air temperature change will affect evapotran-spiration. According to the previous studies, in the middle reaches of the Yellow River, for every 1◦
rise in air temper-ature, watershed evapotranspiration will increase by 5–7 % (G. Q. Wang et al., 2007). In this study, the air temperature has risen by about 1◦
from 1951 to 2008, so, the evapotran-spiration increased by 5–7 % in the Wei River basin.
4.5 Double mass curves of precipitation–stream flow and precipitation–sediment
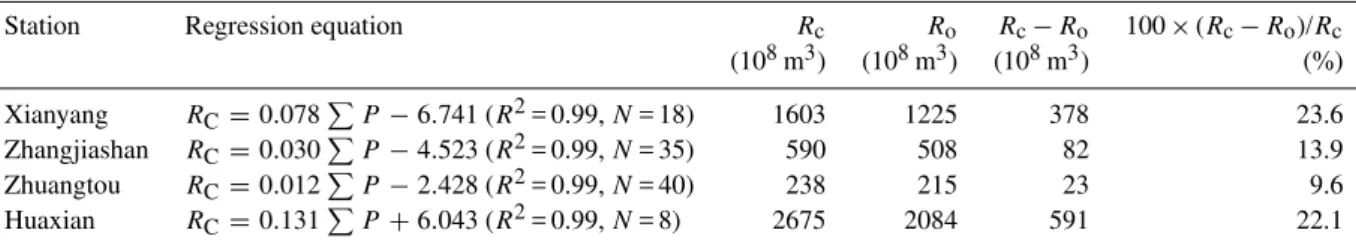
Table 4. Cumulative stream flow (Rc) calculated by the linear regression equations before the transition years, observed cumulative
stream flow (Ro) and reduction of cumulative stream flow (Rc−Ro, 108m3%) after transition years in the Wei River basin (N= years, P= precipitation).
Station Regression equation Rc Ro Rc−Ro 100×(Rc−Ro)/Rc
(108m3) (108m3) (108m3) (%)
Xianyang RC=0.078PP −6.741 (R2= 0.99,N= 18) 1603 1225 378 23.6
Zhangjiashan RC=0.030PP −4.523 (R2= 0.99,N= 35) 590 508 82 13.9
Zhuangtou RC=0.012P
P −2.428 (R2= 0.99,N= 40) 238 215 23 9.6 Huaxian RC=0.131PP +6.043 (R2= 0.99,N= 8) 2675 2084 591 22.1
Table 5.Cumulative sediment discharge (Sc) calculated by the linear regression equations before the transition years, observed cumulative
sediment discharge (So) and reduction of cumulative sediment discharge (Sc−So, 108t %) after transition years in the Wei River basin
(N= years,P= precipitation).
Station Regression equation Sc So Sc−So 100×(Sc−So)/Sc
(108t) (108t) (108t) (%)
Xianyang SC=0.004PP −2.672 (R2= 0.99,N= 31) 86.3 56.4 29.9 34.6
Zhangjiashan SC=0.008PP −2.459 (R2= 0.99,N= 31) 148 121 27 18.4
Zhuangtou SC=0.003PP −0.682 (R2= 0.99,N= 25) 51.5 40.1 11.4 22.2
Huaxian SC=0.011PP −4.578 (R2= 0.99,N= 31) 220 171 49 22.1
<
Fig. 4.Observed annual average temperature in the Wei River basin. The horizontal solid lines present the mean values for the flood sea-son, the horizontal dashed lines indicate the trend line, theZ statis-tic was obtained from the Mann–Kendall test (∗∗:p <0.01).
than before for both stream flow and sediment discharge in the basin (Fig. 5). Compared with the calculated cumula-tive stream flow (Rc), observed cumulative stream flow (Ro) was reduced by 23.6, 13.9, 9.6 and 22.1 % at the Xianyang, Zhangjiashan, Zhuangtou and Huaxian stations, respectively (Table 4). The corresponding reduction for sediment dis-charge was 34.6, 18.4, 22.2, and 22.1 % at the four stations (Table 5).
It should be noted that the relative reductions in cumulative sediment discharge were greater than the relative reductions in cumulative stream flow. This may be caused by the fact
that (a) reduced flow has much smaller sediment transport capacity and therefore increases chances for sediment depo-sition in the riverbed, and (b) most conservation measures, such as check dams, reservoirs, and conversion of croplands to grasslands, are more efficient in trapping sediment than water. All these factors seem more efficient in reducing sed-iment in drier years (Gao et al., 2009).
4.6 Impacts of precipitation and human intervention on stream flow and sediment discharge
We calculated the annual stream flow and sediment discharge for the period after the transition years using the regres-sion equations established from the double mass curve of precipitation–stream flow and precipitation–sediment before the transition years. As previously noted, the difference be-tween the calculated values before and after transition is the impact of precipitation changes. However, the difference be-tween the calculated values and measured values in the post transition period is the result of human activities. The results are shown in Tables 6 and 7.
– –
Fig. 5.Double mass curves of precipitation–stream flow and precipitation–sediment at:(a)Xianyang,(b)Zhanjiashan,(c)Zhuangtou and
(d)Huaxian, in the Wei River basin. The straight lines are the regression lines for the cumulative data before and after change-point years.
higher than the contribution rate of precipitation (4.44 %). The analysis showed that human activities played a major role in both stream flow and sediment discharge reduction in the Wei River basin.
Many different human activities have had an influence on stream flow and sediment discharge in the Wei River. Land use did not change significantly between 1980 and 2005, which indicates that other human activities played the im-portant roles on the reduction in stream flow and sediment yield, which can be outlined as follows.
First, increased demand for water resources in the Wei River due to economic development. The Wei River flows through the Guanzhong–Tianshui Economic Zone and this region is the fastest growing economic region in Gansu and Shaanxi Provinces. With the rapid economic development, water extraction and diversion has increased dramatically for agricultural irrigation and urban and industrial use. The aver-age annual water extraction and diversion was 5.0×10⁸m3 in the 1950s, and it has grown to 19.7×10⁸m3in the 1990s,
accounting for 46 % of the average annual stream flow at the Huaxian station in the Wei River basin (Wang et al., 2008).
Table 6.The impact of precipitation and human intervention on stream flow decline after the change-point year at four stations in the Wei River basin (108m3a−1).
Station Period Rao Rco 1SR Impact of Impact of human
precipitation intervention Xianyang Before 1968 30.73 30.65
After 1968 16.81 26.30 13.92 (45.30 %) 4.44 (31.86 %) 9.49 (68.14 %) Huaxian Before 1968 48.92 49.32
After 1968 30.09 44.68 18.83 (38.49 %) 4.24 (22.54 %) 14.59 (77.46 %) Zhangjiashan Before 1985 10.21 10.34
After 1985 6.55 9.92 3.66 (35.89 %) 0.30 (8.09 %) 3.37 (91.91 %) Zhuangtou Before 1994 4.48 4.43
After 1994 2.58 4.36 1.90 (42.54 %) 0.12 (5.86 %) 1.78 (93.68 %)
Rao: observed annual average stream flow;Rco: calculated annual average stream flow;1SR: reduction in observed stream flow comparing with the period before the change-point year.
Table 7.The impact of precipitation and human intervention on sediment discharge decline after the change-point year at four stations in the Wei River basin (108t a−1).
Station Period Sao Sco 1SS Impact of Impact of human
precipitation intervention Xianyang Before 1981 1.45 1.51
After 1981 0.43 1.40 1.02 (70.38 %) 0.05 (4.62 %) 0.97 (95.38 %) Huaxian Before 1981 3.71 3.83
After 1981 2.09 3.65 1.63 (68.77 %) 0.06 (3.86 %) 1.56 (96.14 %) Zhangjiashan Before 1978 2.55 2.54
After 1978 1.64 2.52 0.91 (35.80 %) 0.03 (3.44 %) 0.88 (96.56 %) Zhuangtou Before 1979 0.96 0.97
After 1979 0.55 0.94 0.41 (42.22 %) 0.02 (5.86 %) 0.38 (94.14 %)
Sao: observed annual average sediment discharge;Sco: calculated annual average sediment discharge;1SS: reduction in observed sediment discharge comparing with the period before the change-point year.
reservoirs, the “rainwater collection project” implemented in the Wei River has also contributed to stream flow and sed-iment discharge reduction since 1996. It was reported that 2 million small cisterns were built to collect storm water to provide drinking water for nearly 5 million people and irri-gation for 3×10³km2in the dry season. Nearly 6×10⁶m3 of precipitation water has been collected each year, includ-ing the rainfall of precipitation events that did not produce runoff (Su et al., 2007), thereby reducing the amount of rain-water reaching the rivers.
Finally, soil and water conservation programs. The Loess Plateau is one of the worst soil erosion regions in the world, and the Wei River runs right through it. As noted, the Wei River is the largest tributary of the Yellow River, in terms of both stream flow and sediment discharge. The total area of soil erosion was 106 700 km2(including 39 700 km2around the Jing River and 21 540 km2around the Beiluo River), ac-counting for 79.2 % of the Wei River basin. Since the 1950s, a number of conservation measures have been implemented
5 Conclusions
The overall results of our analysis show that human activi-ties, such as economic development, soil and water conser-vation, and water projects, appear to be the important factors affecting the significant decrease in annual stream flow and sediment discharge in the Wei River basin that has occurred in recent decades. Further investigation of intervention and management strategies to control erosion without restricting stream flow will be of value to long-term sustainable man-agement of the Wei River basin and the central Yellow River basin.
Acknowledgements. The authors would like to thank the editor and two reviewers for their helpful comments, which improved the quality of the final manuscript. This paper is financially supported by Joint Scientific Thematic Research Programme (NWO-JSTP-84200003), West Light Foundation of The Chinese Academy of Sciences, External Cooperation Program of the Chinese Academy of Sciences (Grant No. GJHZ1018), and National Natural Science Foundation of China (NSFC No. 41171420). We also appreciate Demie Moore’s contribution to this paper.
Edited by: N. Basu
References
Burn, D. H. and Elnur, M. A.: Detection of hydrologic trends and variability, J. Hydrol., 255, 107–122, 2002.
Cai, W. and Cowan, T.: Evidence of impacts from rising temperature on inflows to the Murray–Darling Basin, Geophys. Res. Lett., 35, L07701, doi:10.1029/2008GL033390, 2008.
Chen, X. D.: The Yellow River Hydrology, The Yellow River Water Conservancy Press, Zhengzhou, China, 521 pp., 1996.
Fan, Y. T., Chen, Y. N., Li, W. T., Wang, H. J., and Li, X. G.: Impacts of temperature and precipitation on runoff in the Tarim River dur-ing the past 50 years, J. Arid Land, 3, 220–230, 2011.
Fu, G. B., Charles, S. P., Viney, N. R., Chen, S., and Wu, J. Q.: Impacts of climate variability on stream-flow in the Yellow River, Hydrol. Process., 21, 3431–3439, 2007.
Gao, P.: Streamflow and sediment discharge change trend and its response to human activities in the Middle Reaches of the Yellow River, PhD thesis, Graduate University of the Chinese Academy of Sciences, Yangling, China, 2010.
Gao, P., Mu, X. M., Li, R., and Wang, W.: Trend and driving force analyses of streamflow and sediment discharge in Wuding River, J. Sediment Res., 5, 22–28, 2009.
Gao, P., Zhang, X. C., Mu, X. M., Wang, F., Li, R., and Zhang, X. P.: Trend and change-point analyses of stream flow and sed-iment discharge in Yellow River mainstream during 1950–2005, Hydrolog. Sci. J., 55, 275–285, 2010.
Gao, P., Mu, X.-M., Wang, F., and Li, R.: Changes in streamflow and sediment discharge and the response to human activities in the middle reaches of the Yellow River, Hydrol. Earth Syst. Sci., 15, 1–10, doi:10.5194/hess-15-1-2011, 2011.
Hirsch, R. M., Slack, J. R., and Smith, R. A.: Techniques of trend analysis for monthly water quality data, Water Resour. Res., 18, 107–121, 1982.
Huang, M. B. and Zhang, L.: Hydrological responses to conserva-tion practices in a catchment of the Loess Plateau, China, Hydrol. Process., 18(10), 1885–1898, 2004.
Kendall, M. G.: Rank Correlation Measures, Charles Griffin, Lon-don, UK, 202 pp., 1975.
Lee, H. T.: Soil conservation in China’s Loess Plateau, J. Soil Water Conserv., 39, 306–307, 1984.
Li, W. X., Zhang, C. P., Jiang, N. Q., and Wang, P.: Variation of water level at Tongguan station and its impact on sediment de-position in the lower reach of the Wei River, J. Sediment Res., 3, 24–29, 2003.
Mann, H. B.: Nonparametric tests against trend, Econometrica, 13, 245–259, 1945.
Merriam, C. F.: A comprehensive study of the rainfall on the susquehanna valley, Trans. Am. Geophys. Union, 18, 471–476, 1937.
Mu, X. M., Zhang, L., McVicar, T. R., Chille, B., and Gau, P.: Analysis of the impact of conservation measures on stream flow regime in catchments of the Loess Plateau, China, Hydrol. Pro-cess., 21, 2124–2134, 2007.
Mu, X. M., Zhang, X. Q., Gao, P., and Wang, F.: Theory of double mass curves and its applications in hydrology and meteorology, J. China Hydrol., 30, 47–51, 2010.
Pettitt, A. N.: A non-parametric approach to the change-point prob-lem, Appl. Stat., 28, 126–135, 1979.
Ren, M. E.: Sediment discharge of the Yellow River, China: past, present and future, Adv. Earth Sci., 21, 551-563, 2006.
Searcy, J. K., Hardisoni, C. H., and Langbein, W. B.: Double mass curves, Geological Survey Water Supply Paper 1541-B, US Ge-ological Survey, Washington, DC, 1960.
Shaanxi Province Department of water resources: Statistical data of water conservancy in Shaanxi province in 2000, Shaanxi Province, Department of Water Resources, Xi’an, China, 148– 150, 2000.
Su, X. l., Kang, S. Z., Wei, X. M. Xing, D. W., and Cao, D. W.: Impact of climate change and human activity on the runoff of Wei River basin to the Yellow River, Journal of Northwest A & F University (Nat. Sci. Ed.), 35, 153–159, 2007.
Tang, C. L., Crosby, B. T., Wheaton, J. M., and Piechota, T. C.: Assessing streamflow sensitivity to temperature increases in the Salmon River Basin, Idaho, Global Planet. Change, 88–89, 32– 44, 2012.
Wang, G. Q., Wu, B. S., and Wang, Z. Y.: Sedimentation problems and management strategies of Sanmenxia Reser-voir, Yellow River, China, Water Resour. Res., 41, W09417, doi:10.1029/2004WR003919, 2005.
Wang, G. Q., Zhang, J. Y., He, R. M., and Jing, X. A.: Trends of temperature change in middle of Yellow River and its impact to the evaporation potential, J. Water Resour. Water Eng., 18, 32– 36, 2007.
Wang, S. X., Wei, H. Y., and Wang, Z. Y.: Trend and change-point analyses of stream flow in Wei River, Yellow River, 30, 26–27, 2008.
Yu, L. S.: The Huanghe (Yellow) River: recent changes and its coun-termeasures, Cont. Shelf Res., 26, 2281–2298, 2006.
Yue, S. and Pilon, P.: A comparison of the power of the t test, Mann– Kendall and bootstrap tests for trend detection, Hydrolog. Sci. J., 49, 21–37, 2004.
Yue, S., Pilon, P., and Phinney, B.: Canadian stream flow trend de-tection: impacts of serial and cross-correlation, Hydrolog. Sci. J., 48, 51–63, 2003.