BGD
12, 5259–5291, 2015Detection and attribution of global
change effects
R. Aguilera et al.
Title Page
Abstract Introduction
Conclusions References
Tables Figures
◭ ◮
◭ ◮
Back Close
Full Screen / Esc
Printer-friendly Version
Interactive Discussion
Discussion
P
a
per
|
Discussion
P
a
per
|
Discussion
P
a
per
|
Discussion
P
a
per
|
Biogeosciences Discuss., 12, 5259–5291, 2015 www.biogeosciences-discuss.net/12/5259/2015/ doi:10.5194/bgd-12-5259-2015
© Author(s) 2015. CC Attribution 3.0 License.
This discussion paper is/has been under review for the journal Biogeosciences (BG). Please refer to the corresponding final paper in BG if available.
Detection and attribution of global change
e
ff
ects on river nutrient dynamics in a
large Mediterranean basin
R. Aguilera1, R. Marcé1, and S. Sabater1,2 1
Catalan Institute for Water Research (ICRA), Scientific and Technological Park of the University of Girona, Emili Grahit 101, 17003 Girona, Spain
2
Institute of Aquatic Ecology, University of Girona, Faculty of Sciences, Campus Montivili, 17071 Girona, Spain
Received: 19 January 2015 – Accepted: 21 March 2015 – Published: 2 April 2015
Correspondence to: R. Aguilera ([email protected])
BGD
12, 5259–5291, 2015Detection and attribution of global
change effects
R. Aguilera et al.
Title Page
Abstract Introduction
Conclusions References
Tables Figures
◭ ◮
◭ ◮
Back Close
Full Screen / Esc
Printer-friendly Version
Interactive Discussion
Discussion
P
a
per
|
Discussion
P
a
per
|
Discussion
P
a
per
|
Discussion
P
a
per
|
Abstract
Attributing changes in river water quality to specific factors is challenging because mul-tiple factors act at different temporal and spatial scales, and it often requires examining long-term series of continuous data. But data consistency is sometimes hindered by the lack of observations of relevant water quality variables and the low and uneven
5
sampling frequency that characterize many water quality monitoring schemes. Nitrate and dissolved phosphate concentration time-series (1980–2011) from 50 sampling sta-tions across a large Mediterranean river basin were analyzed to disentangle the role of hydrology, land-use practices, and global climatic phenomena on the observed nu-trient patterns, with the final aim of understanding how the different aspects of global
10
change affected nutrient dynamics in the basin. Dynamic Factor Analysis (DFA) pro-vided the methodological framework to extract underlying common patterns in nutrient time-series with missing observations. Using complementary methods such as fre-quency and trend analyses, we sought to further characterize the common patterns and identify the drivers behind their variability across time and space. Seasonal and
15
other cyclic patterns were identified, as well as trends of increase or decrease of nutri-ent concnutri-entration in particular areas of the basin. Overall, the impact of global change, which includes both climate change and anthropogenic impacts, on the dynamics of nitrate concentration across the study basin was found to be a multifaceted process including regional and global factors, such as climatic oscillations and agricultural
ir-20
BGD
12, 5259–5291, 2015Detection and attribution of global
change effects
R. Aguilera et al.
Title Page
Abstract Introduction
Conclusions References
Tables Figures
◭ ◮
◭ ◮
Back Close
Full Screen / Esc
Printer-friendly Version
Interactive Discussion
Discussion
P
a
per
|
Discussion
P
a
per
|
Discussion
P
a
per
|
Discussion
P
a
per
|
1 Introduction
The Earth system is intrinsically dynamic but the intensity and rate of recent environ-mental changes are overall unprecedented (Meybeck, 2003; García-Ruiz et al., 2011). Land-use change and management practices, pollution, human demography shifts, and climate change are components of global environmental change (Rosenzweig
5
et al., 2008), understood as the synergy between climate change and direct action of human activities on the territory (U.S. Global Change Research Act, 1990). Fresh-waters are at the forefront of the phenomena associated to global change (Vörösmarty et al., 2010), and impacts on water resources availability as well as on their quality are extensive (Parmesan and Yohe, 2003; Milly et al., 2005; Grimm et al., 2008; Rabalais
10
et al., 2009; Gallart et al., 2011).
A fundamental concern is to understand the spatial patterns of nutrient concentration and loading in rivers, their variation during the last decades, and whether these are pro-moted by the increasing human activities (Grizzetti et al., 2011), or may be associated to climate change (Marcé et al., 2010). This is particularly relevant in Mediterranean
15
regions where the imbalance between available water resources and increased de-mands has become a growing problem (Milly et al., 2005; Bovolo et al., 2011), and where streams and rivers bear concurrent additional pressures such as damming, wa-ter extraction, and urbanization (Sabawa-ter and Tockner, 2010). In Spain, for instance, the construction rate of large dams peaked during the 1960s and 1970s, whereas human
20
population density and urban area in the Mediterranean region increased during the 1990s (Cooper et al., 2013). Furthermore, nutrient export in Mediterranean rivers con-tributes to eutrophication because of the co-existence of naturally-occurring low flows and high water demand (Caille, 2009).
However, it is challenging to attribute changes in nutrient concentration dynamics
25
BGD
12, 5259–5291, 2015Detection and attribution of global
change effects
R. Aguilera et al.
Title Page
Abstract Introduction
Conclusions References
Tables Figures
◭ ◮
◭ ◮
Back Close
Full Screen / Esc
Printer-friendly Version
Interactive Discussion
Discussion
P
a
per
|
Discussion
P
a
per
|
Discussion
P
a
per
|
Discussion
P
a
per
|
quality. Such detailed analysis, which aims to extract the key properties enclosed in time-series, is essential to obtain insight of the physical, biological, or socioeconomi-cal events that originally shaped these time-series (Ghil et al., 2002). It is realistic to consider that temporal trends and spatial patterns reveal emerging environmental prob-lems (Lane et al., 1994; Lovett et al., 2007; Marcé et al., 2010; Estrada et al., 2013).
5
Data consistency can be however affected by the lack of observations of relevant water quality variables and the low or uneven sampling frequency, which are common char-acteristics of many water quality monitoring schemes worldwide. These impede the appropriate analysis of the time-series available from long-term monitoring, eventually affecting management decisions on the minimization of effects of global change, and
10
particularly in Mediterranean regions, where there is a dearth of knowledge compared to other temperate regions (Benítez-Gilabert et al., 2010).
The vast majority of studies of global change impact based on the analysis of long-term data use time-series methods like the Mann–Kendall and the Seasonal Kendall analyses for trend detection (Chang, 2008; Bouza-Deaño et al., 2008; Argerich et al.,
15
2013); wavelet analysis for temporal patterns (Kang and Lin, 2007); and combinations of statistical models such as univariate and multivariate regressions (Tilman et al., 2001); and analysis of variance and variography (i.e., spatial dependence measured as a function of the distance and direction separating two locations; Bernal et al., 2013). However, methods like spectral analysis are limited to characterizing the spectral
den-20
sity to detect any periodicities in the data and do not necessarily allow the identification of common patterns embedded in a collection of time-series (Zuur et al., 2003). Fur-thermore, most of these methods do not easily accommodate missing observations, which are extremely abundant in most public environmental databases. These limita-tions make the analysis of water quality datasets in large regions difficult and
cumber-25
BGD
12, 5259–5291, 2015Detection and attribution of global
change effects
R. Aguilera et al.
Title Page
Abstract Introduction
Conclusions References
Tables Figures
◭ ◮
◭ ◮
Back Close
Full Screen / Esc
Printer-friendly Version
Interactive Discussion
Discussion
P
a
per
|
Discussion
P
a
per
|
Discussion
P
a
per
|
Discussion
P
a
per
|
using methodologies that explicitly consider the inextricable link between temporal and spatial patterns of change and that are able to accommodate missing values.
We use a combination of Dynamic Factor Analysis (DFA), classical time-series meth-ods, and spatial regression models to extract underlying common patterns in a set of time-series and to depict their relationships with local and global scale phenomena.
5
We apply the above to a set of river nutrient concentration time-series within a Mediter-ranean basin in order to identify temporal and spatial patterns at the basin-wide scale, and to understand how global change shapes these patterns. Both nitrate and dis-solved phosphate dynamics were analyzed in order to disentangle the role of hydrol-ogy, land-use practices, and climate phenomena on the observed patterns, with the
10
final aim of understanding how the different aspects of global change may affect nutri-ent variability (and hence water quality) in the basin.
2 Study area
The Ebro River is one of the main tributaries of the Mediterranean Sea. The mean annual runoff at the outlet is 13 408 hm3. The basin covers a highly heterogeneous
15
area of ca. 85 500 km2, which extends from the southern-facing side of the Cantabrian range and Pyrenees and the northern-facing side of the Iberian Massif until the river reaches the Mediterranean Sea (Sabater et al., 2009). The geographical setting of the Ebro River determines a large range of climatic conditions (Sabater et al., 2009). Mean annual precipitation varies from over 2000 mm in the Pyrenees to less than 400 mm in
20
the arid interior. Overall, silicic materials are located in the uppermost altitudes while calcareous materials occur at lower elevations (Lassaletta et al., 2009). The water biogeochemical characteristics are highly influenced by anthropogenic activities. The main effects are those due to water discharge regulation (i.e., the construction of large reservoirs) and agriculture (determining increases in nitrate concentration) (Romaní
25
BGD
12, 5259–5291, 2015Detection and attribution of global
change effects
R. Aguilera et al.
Title Page
Abstract Introduction
Conclusions References
Tables Figures
◭ ◮
◭ ◮
Back Close
Full Screen / Esc
Printer-friendly Version
Interactive Discussion
Discussion
P
a
per
|
Discussion
P
a
per
|
Discussion
P
a
per
|
Discussion
P
a
per
|
during dry annual periods, when irrigation is widespread. The basin started a sanitation plan during the 90s that progressively covered most of the local inputs.
3 Materials and methods
3.1 Time-series data
Existing nitrate and phosphate concentration as well as water discharge data of the
5
Ebro River Basin were collected from public databases (Ebro Basin Authority (CHE)). The frequency of sampling was monthly. We selected 50 monitoring points distributed all across the basin that showed the longest time-series, consisting in 31 year-long (1980–2011) monthly data. Thus, these time-series had a maximum length of 372 data points, although most of the stations contained observation gaps. Some unreasonable
10
values were manually removed considering expected ranges of values for each nutri-ent. Discharge time-series were available in 37 of the sampling sites.
3.2 Detection and attribution of global change effects: methodological steps
The first step in defining global change effects on nutrient time-series was to detect common patterns (Sect. 3.3) in the 50 nutrient time series (nitrate or phosphate) using
15
DFA (Zuur et al., 2003). Once the common patterns for nitrate and phosphate were identified, we described the significant cycles and trends present in those patterns with classical frequency (Sect. 3.4) and trend (Sect. 3.5) analyses. Subsequently, the potential dependence on hydrological variability was sought by exploring any significant association between patterns and water discharge time-series (Sect. 3.6). We finally
20
BGD
12, 5259–5291, 2015Detection and attribution of global
change effects
R. Aguilera et al.
Title Page
Abstract Introduction
Conclusions References
Tables Figures
◭ ◮
◭ ◮
Back Close
Full Screen / Esc
Printer-friendly Version
Interactive Discussion
Discussion
P
a
per
|
Discussion
P
a
per
|
Discussion
P
a
per
|
Discussion
P
a
per
|
3.3 Extraction of common nutrient concentration patterns
Dynamic Factor Analysis (DFA; Zuur et al., 2003) is a dimension-reduction method that estimates underlying common patterns in a set of time-series. It is based in the so-called state-space model, which treats each observed time-series as a linear com-bination of multiple state processes (Holmes et al., 2012). A considerable advantage
5
of the state-space approach is the ease with which missing observations can be dealt with. The main disadvantage of DFA is that it can be computationally expensive.
DFA decomposes the observed time-series from all sampling points included in the analysis into common patterns and their associated error terms (Holmes et al., 2012). The resulting patterns are in turn related to factor loadings, which indicate the weight
10
that each pattern has at every monitoring point included in the analysis. In other words, DFA models the different time-series as a linear combination of common temporal patterns, in a similar way a Principal Component Analysis reduces ann-dimensional problem into a few manageable axes. Both the identified common patterns and their relevance at each sampling point (i.e., the factor loadings) were subsequently
ana-15
lyzed using additional time-series and regression techniques. DFA was applied to our database by means of the MARSS v3.4 R-package (Holmes et al., 2013).
We also used DFA to enhance the signal to noise ratio of the measured streamflow time-series which in turn facilitated the identification of characteristic oscillations and potential relationships between streamflow and other variables. After DFA, we
recon-20
structed the streamflow time-series at each sampling point using the best linear com-bination of the common patterns identified during DFA. This procedure is equivalent to other signal to noise ratio enhancement methods, like reconstruction using Singular Spectrum Analysis (Ghil et al., 2002), with the difference that our approach enhances the features shared by the different time-series.
BGD
12, 5259–5291, 2015Detection and attribution of global
change effects
R. Aguilera et al.
Title Page
Abstract Introduction
Conclusions References
Tables Figures
◭ ◮
◭ ◮
Back Close
Full Screen / Esc
Printer-friendly Version
Interactive Discussion
Discussion
P
a
per
|
Discussion
P
a
per
|
Discussion
P
a
per
|
Discussion
P
a
per
|
3.4 Identification of significant oscillations in the common nutrient concentration patterns
We analyzed all significant frequencies present in the common patterns identified by DFA using frequency analysis. We specifically aimed to identify frequencies that could be linked to seasonal cycles (6 and 12 months period) and climatic interannual
oscilla-5
tions. We chose the Multitaper Method (MTM) due to its reduced variance of spectral estimates compared to classical methods (Ghil et al., 2002). Frequencies significantly different from noise at thep <0.05 level were identified using theF test for spectral fre-quencies. MTM was applied using the Multitaper R-Package (Rahim and Burr, 2013).
3.5 Identification of significant temporal trends in the common nutrient 10
concentration patterns
Since the common patterns are allowed to be stochastic in DFA, they can also con-tain significant trends that are not necessarily a straight line (Zuur et al., 2007). We therefore sought to identify the significant trends present in individual patterns and to characterize such trends as increasing or decreasing over time. We used the
imple-15
mentation of the Yue–Pilon’s (Yue et al., 2002) prewhitening approach included in the zyp R-package (Rahim and Burr, 2013) to determine the trends in data that are seri-ally correlated. The method computes both the Kendall’s tau statistic and the Kendall’s
pvalue.
3.6 Relationships between streamflow and the common nutrient concentration 20
patterns
The relationships between streamflow and nitrate and phosphate concentration pat-terns from the DFA analysis were assessed with the Maximal Information Coefficient (MIC) method (Reshef et al., 2011), which belongs to a larger family of statistics called Maximal Information-based Nonparametric Exploration (MINE; http://www.exploredata.
BGD
12, 5259–5291, 2015Detection and attribution of global
change effects
R. Aguilera et al.
Title Page
Abstract Introduction
Conclusions References
Tables Figures
◭ ◮
◭ ◮
Back Close
Full Screen / Esc
Printer-friendly Version
Interactive Discussion
Discussion
P
a
per
|
Discussion
P
a
per
|
Discussion
P
a
per
|
Discussion
P
a
per
|
net/). MIC captures a wide range of associations which are not restricted to be linear, and without the need to define a model a priori. MIC provides a score that roughly corre-sponds to the coefficient of determination of the data relative to the regression function, and a significance level. In our case, we calculated MIC scores and significance levels for each paired combination of common nutrient concentration patterns and the DFA
5
reconstructed streamflow series measured at each sampling station. We used these filtered streamflow time-series instead of the original ones due to the continuity of the resulting filtered series and in order to enhance the signal to noise ratio.
3.7 Attribution of drivers for spatio-temporal variabilility of the common nutrient concentration patterns
10
Factor loadings are the multiplication factors that determine the linear combination of the common patterns to produce a best-fit nutrient concentration time-series (Zuur et al., 2003). Factor loadings can take positive or negative values when specific time-series behave in an opposite way to that described by the extracted pattern. Therefore, the geographical distribution of factor loading values across monitoring points inform
15
about the spatial development of the processes responsible for the extracted patterns. To evaluate the relationship between the relevance (i.e., factor loading) of the ex-tracted patterns at each sampling point and the environmental change drivers, we se-lected a set of potential explanatory variables that were spatially distributed. These included meteorological variables (mean annual air temperature and precipitation),
20
reservoir capacity and location, wastewater treatment plants (WWTP) discharge and location, specific streamflow (runoff index), mean river nutrient concentration in the sampling point, land use distribution, and five variables related to nitrogen loads and their sources obtained by (Lassaletta et al., 2012): application of synthetic fertilizers, application of manure, inputs by biological fixation, total exported N, and point sources.
25
BGD
12, 5259–5291, 2015Detection and attribution of global
change effects
R. Aguilera et al.
Title Page
Abstract Introduction
Conclusions References
Tables Figures
◭ ◮
◭ ◮
Back Close
Full Screen / Esc
Printer-friendly Version
Interactive Discussion
Discussion
P
a
per
|
Discussion
P
a
per
|
Discussion
P
a
per
|
Discussion
P
a
per
|
The potential explanatory variables were related to factor loadings measured at each sampling site by the Generalized Least Squares (GLS) regression model (Pinheiro and Bates, 2000). The use of generalized least squares for regression modeling is advis-able when neighboring values of the response variadvis-able tend to be spatially correlated. In our case, we assumed a spatial error structure, the Gaussian structure being the
5
most appropriate among the (six) available options based on Akaike Information Cri-terion (AIC) values. A combination of forward and backward selection was used to identify the significant explanatory variables, using the AIC criterion to identify the best model. We fitted different GLS models for sampling stations showing opposite signs of the factor loading for a given Pattern (e.g., stations showing positive and negative
10
factor loadings for Pattern 1 of nitrate concentration were treated separately). The ratio-nale of this procedure is that many fundamental features of the patterns (phase of the time-series, relationships with streamflow and other variables, direction of the trends) change when the pattern is flipped due to a change of the factor loading sign, potentially implying different generating mechanisms. The GLS models were fitted using the nlme
15
R-Package (Pinheiro et al., 2012). In order to assess the model fit and the variance explained, we calculated a Generalized R-Squared based on (Cox and Snell, 1989) using the r.squaredLR function included in the MuMIn R-Package (Barton, 2014).
3.8 Spatial aggregation of common nutrient concentration patterns and explanatory variables
20
We assessed the clustering of the spatial distribution of nutrient concentration patterns and the significant explanatory variables found in GLS regression models. We used the clustering analysis to portray homogeneous regions in terms of the presence of concrete nutrient concentration patterns and their likely drivers. Our final aim was to highlight the most relevant cause-effect mechanisms that define vulnerable regions
25
as-BGD
12, 5259–5291, 2015Detection and attribution of global
change effects
R. Aguilera et al.
Title Page
Abstract Introduction
Conclusions References
Tables Figures
◭ ◮
◭ ◮
Back Close
Full Screen / Esc
Printer-friendly Version
Interactive Discussion
Discussion
P
a
per
|
Discussion
P
a
per
|
Discussion
P
a
per
|
Discussion
P
a
per
|
sess the most effective grouping. The method looks for a solution where all the fea-tures (in our case, the value of all factor loadings and significant explanatory variables found during GLS modeling) within each group are as similar as possible, and all the groups themselves are as different as possible. Thus, it is not necessary to define the number of desired cluster beforehand. We applied thek-means algorithm without any
5
spatial constraints. Although explicit spatial relationships actually exist between sam-pling points along a river network, our aim was to identify clusters exclusively based on the information contained in the factor loadings and explanatory variables.
4 Results
4.1 Common nutrient concentration patterns in the basin 10
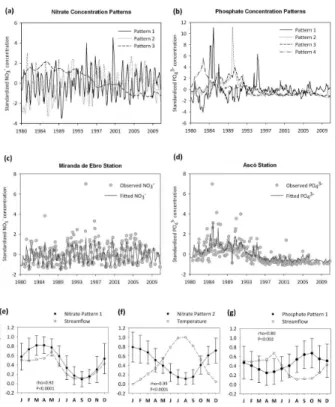
The DFA analysis for nitrate concentration extracted 3 common patterns (Fig. 1a), where the order of the extracted patterns has no implication on the importance or weight of a particular pattern. Patterns 1 and 2 identified in nitrate time-series had a marked seasonal component appreciated visually (Fig. 1a) and further confirmed by the significant 12 month cycles found in the frequency analysis (Table 1). The seasonal
15
evolution of Pattern 1 was clearly associated with the seasonal streamflow pattern (Fig. 1e), suggesting that it was hydrology-driven. The MINE analysis also detected significant associations between Pattern 1 of nitrate concentration and the DFA re-constructed streamflow series in almost all sites across the basin (Table 1). Nitrate concentration increased with streamflow (sites showing positive factor loadings), and
20
was affected by a dilution dynamics (negative factor loadings). In contrast, Pattern 2 was strongly associated with the seasonal evolution of the mean air temperature in the basin (Fig. 1f), suggesting its connection to phenological processes (lower values during the growing season).
Pattern 1 of nitrate concentration was also associated to a ca. 2.6 year periodicity
25
BGD
12, 5259–5291, 2015Detection and attribution of global
change effects
R. Aguilera et al.
Title Page
Abstract Introduction
Conclusions References
Tables Figures
◭ ◮
◭ ◮
Back Close
Full Screen / Esc
Printer-friendly Version
Interactive Discussion
Discussion
P
a
per
|
Discussion
P
a
per
|
Discussion
P
a
per
|
Discussion
P
a
per
|
period (Table 1). Pattern 3 also included a significant decreasing trend (Table 1). The signs associated to DFA factor loadings of Pattern 3 indicated that 20 of the 50 stations were in fact following the opposite trend.
DFA extracted four common patterns from the 50 dissolved phosphate concentra-tion time-series included in the analysis (Fig. 1b). The 1990s represented a shift-time
5
point for phosphate patterns. In all four patterns, a sharp decrease in the phosphate concentration occurred in the early 1990s, and shifted to a steady behavior till the end of the study period, but the four patterns differed in peak timing before the 1990s. De-spite the overall decrease, only Pattern 2 had a highly significant trend while trend in Pattern 4 was only marginally significant (Table 1). Pattern 1 had a marked seasonal
10
cycle, potentially driven by streamflow (suggested by the significant relationship be-tween the seasonal evolution of the pattern and streamflow; Fig. 1b). However, the MINE algorithm detected just 2 significant associations between this pattern and the DFA reconstructed streamflow time-series from the sampling sites (Table 1). Pattern 3 showed cycles of ca. 4.3 and 1.6 yr (Table 1).
15
The frequency analysis of the 37 DFA reconstructed streamflow series revealed several characteristic oscillations. Apart from the strong seasonal signal, there were significant oscillations at 1.5, 2.2, 3.2, 4.2, and 9 years in several sampling stations. Periods from 1.5 to 4.2 years were highly coherent with the oscillations found in the common patterns of nitrate and phosphate concentration (Table 1), suggesting that
20
multi-year oscillations in nutrients concentration were related to streamflow variability. Interestingly, nitrate and phosphate patterns showing at least one significant oscillation with period longer than one year also showed many significant MINE associations with streamflow across sites (Table 1). No significant trend was detected in the streamflow series.
BGD
12, 5259–5291, 2015Detection and attribution of global
change effects
R. Aguilera et al.
Title Page
Abstract Introduction
Conclusions References
Tables Figures
◭ ◮
◭ ◮
Back Close
Full Screen / Esc
Printer-friendly Version
Interactive Discussion
Discussion
P
a
per
|
Discussion
P
a
per
|
Discussion
P
a
per
|
Discussion
P
a
per
|
4.2 Factors explaining the distribution of the different nutrient concentration patterns
The GLS regression models for the distribution of factor loadings for each Pattern iden-tified several significant explanatory variables (Tables 2 and 3). Since nitrate concentra-tion Patterns 1 and 2 showed contrasted positive and negative factor loadings across
5
sites, we considered different models for sites showing positive and negative factor loadings. The distribution of positive factor loadings for Pattern 1 strongly related to the total area of water (mainly reservoirs). The higher the total area occupied by water upstream, the higher the weight of Pattern 1.
Other associations were also significant, although their prediction weights on the
10
model were less important: a negative relationship with mean annual air temperature upstream from the sampling point; a positive relationship with dryland farming area around the sampling point; and a negative association with the industrial areas up-stream from the sampling point (Table 2). Negative factor loadings of Pattern 1 were related to the presence of irrigated agricultural lands and to the mean annual
precipita-15
tion received upstream. The reservoir water capacity upstream the sampling point had a small and marginally significant effect.
Factor loadings for Pattern 2 of nitrate were strongly associated to sites with irrigated agricultural areas upstream from the sampling point. The distribution of Pattern 2 was also weakly related to the annual mean precipitation and the presence of irrigated
20
lands. Finally, the distribution of factor loading values for Pattern 3 was spatially asso-ciated to industrial areas. The main difference between models for negative and posi-tive factor loadings for this pattern was dictated by the relevance of distinct sources of nitrogen being used in the area, namely, synthetic fertilizers and manure (Table 2).
Globally, the explanatory power of the GLS models for the distribution of phosphate
25
patterns was much lower than for nitrate concentration models (Table 3). Pseudo-R2
ex-BGD
12, 5259–5291, 2015Detection and attribution of global
change effects
R. Aguilera et al.
Title Page
Abstract Introduction
Conclusions References
Tables Figures
◭ ◮
◭ ◮
Back Close
Full Screen / Esc
Printer-friendly Version
Interactive Discussion
Discussion
P
a
per
|
Discussion
P
a
per
|
Discussion
P
a
per
|
Discussion
P
a
per
|
plained by a complex combination of synthetic fertilizer load and industrial area up-stream from the sampling point, the runoff index associated to it, and the mean river phosphate concentration in the site. Overall, the distribution of the phosphate patterns was hardly explained by the set of explanatory variables considered in this study, and was mainly explained by the presence of industrial areas upstream of the sampling
5
points (Table 3).
4.3 The joint spatial distribution of the nutrient concentration patterns and explanatory factors
The clustering analysis for the spatial distribution of the nitrate patterns and the signifi-cant explanatory variables found 4 aggregations among the 50 sampling sites (Fig. 3a).
10
Cluster 1 contained sampling points located mainly in downstream sections of major tributaries of the Ebro River (particularly along the Segre River); Cluster 2 included points in upstream locations of tributaries and in the main Ebro; Cluster 3 comprised points located even more upstream; and Cluster 4 collected the downstream sites of the main stem of the Ebro River. These clusters were characterized by significant diff
er-15
ences in the absolute values of the factor loadings for Pattern 1 (Fig. 3b, non parametric Wilcoxon test for mean comparison,p=0.011), and Pattern 2 (p=0.017). Cluster 1 showed the largest relevance of Pattern 1, Cluster 4 for Pattern 2, and Cluster 3 for Pattern 3. Therefore the most fundamental regional difference in the dynamics of ni-trate concentration in the basin was a switch from a streamflow-dominated dynamics
20
in Cluster 1 to a phenology-dominated of Cluster 4. The preeminence of Pattern 3 in Cluster 3 was also a significant spatial pattern extracted from the clustering analysis. These differences between clustering groups were coincident with significant diff er-ences for many explanatory variables, particularly the extension of irrigated agriculture (p <0.0001), the presence of reservoirs upstream the sampling point (p <0.0001), and
25
BGD
12, 5259–5291, 2015Detection and attribution of global
change effects
R. Aguilera et al.
Title Page
Abstract Introduction
Conclusions References
Tables Figures
◭ ◮
◭ ◮
Back Close
Full Screen / Esc
Printer-friendly Version
Interactive Discussion
Discussion
P
a
per
|
Discussion
P
a
per
|
Discussion
P
a
per
|
Discussion
P
a
per
|
Contrastingly, the clustering analysis for the phosphate concentration resulted in a poor regionalization with only 2 different aggregations (Fig. 4a), one including just 5 sampling points. There were no obvious spatial clusters beyond Cluster 2, which included points with higher values for Pattern 4 (p=0.006). This coincided with very high phosphate concentrations (p=0.002) and extensive industrial areas (p=0.001)
5
related to the sampling points. The poor regionalization in the phosphate case stressed again the apparently idiosyncratic behavior of phosphate concentration across sam-pling sites.
5 Discussion
5.1 The nature of nutrient concentration patterns in the Ebro basin 10
The analysis of the impacts of global change on freshwater ecosystems requires the use of appropriate tools to identify the main regional trends and modes present in hy-drological and water quality variables. Results of this study show that the combination of DFA, traditional time-series analysis, and regression methods is a convenient ap-proach and several features of the time series shared by many sampling points across
15
the Ebro basin can be detected.
The analysis of the nutrient concentration time-series detected the existence of sea-sonal patterns related to hydrology. Although the common hydrological relation with nu-trient dynamics (Donner et al., 2002) may hide the detection of other seasonal cycles not related to streamflow, our analysis also detected seasonality that was unrelated to
20
hydrology. While Pattern 1 of nitrate concentration was related to streamflow, the ni-trate dynamics in the basin was also related to the phenological cycles of the adjacent terrestrial ecosystems or other water bodies upstream (Pattern 2). The actual mech-anism behind the association between nitrate concentration and air temperature may be complex, and in fact it may differ at different sampling points, since air temperature
25
BGD
12, 5259–5291, 2015Detection and attribution of global
change effects
R. Aguilera et al.
Title Page
Abstract Introduction
Conclusions References
Tables Figures
◭ ◮
◭ ◮
Back Close
Full Screen / Esc
Printer-friendly Version
Interactive Discussion
Discussion
P
a
per
|
Discussion
P
a
per
|
Discussion
P
a
per
|
Discussion
P
a
per
|
by freshwater primary producers during summer (Carpenter and Dunham, 1985) and the seasonal evolution of leaf fall and decomposition (González et al., 2012) could have taken a major role. However, other factors may contribute to lower concentra-tions, like the seasonal cycle of denitrification in the adjacent terrestrial ecosystems and upstream water bodies during summer months (Tatariw et al., 2013).
5
Nutrient concentrations showed multiple associations with streamflow spanning from the seasonal to the interannual scale. One of the most prominent features of nitrate concentration time-series was the existence of a switching relationship with streamflow (expressed by the changing sign of factor loadings for Pattern 1). This implies a funda-mental change of the dynamics of nitrate concentration and suggests a major change
10
in the sources of nitrogen to freshwaters. The positive relationship between nutrient concentration and streamflow suggest the preponderance of diffusive inputs from the terrestrial ecosystems and non-irrigated agricultural fields, whereas the negative rela-tionship pointed to a dilution mechanism typical of locations having point sources. The GLS models further identified the land fraction occupied by irrigated agriculture as the
15
main factor associated to the presence of negative factors loadings for Pattern 1 of nitrate concentration. Summer irrigation is a common agricultural practice in Mediter-ranean areas that can disrupt the relationship with the natural flow regime as well as the nitrate dynamics. This has been already observed in the Ebro basin where the intra-annual N export differed among rainfed and irrigated crops, the former following
20
the flow regime, the latter modifying it (Lassaletta et al., 2012). In addition, irrigation has the capability of altering local and regional precipitation behavior through changes in soil moisture and heat budgets (Boucher et al., 2004), particularly in downstream areas (Huber et al., 2014). However, none of these regional climate effects has been confirmed in the Ebro basin.
25
BGD
12, 5259–5291, 2015Detection and attribution of global
change effects
R. Aguilera et al.
Title Page
Abstract Introduction
Conclusions References
Tables Figures
◭ ◮
◭ ◮
Back Close
Full Screen / Esc
Printer-friendly Version
Interactive Discussion
Discussion
P
a
per
|
Discussion
P
a
per
|
Discussion
P
a
per
|
Discussion
P
a
per
|
The supra-annual frequencies detected in the nitrate and phosphate concentration patterns in the Ebro point out to associations with climatic oscillations identified in the Mediterranean region. The North Atlantic Oscillation (NAO) has multiple modes starting at 1.4 years, while the El Niño–Southern Oscillation (ENSO) has modes between 2.4 and 5.2 years (Rodó et al., 1997). Both the nutrient patterns and the streamflow series
5
showed oscillations coherent with those from the ENSO and NAO, which are known to modify, through teleconnections, the magnitude and frequency of precipitation in a heterogeneous manner (Rodó et al., 1997). The impact of ENSO on nitrate river concentrations is, in fact, not uncommon in areas under indirect ENSO effects, such as the SE United States (Keener et al., 2010). Moreover, the associations of ENSO
10
with streamflow modifications (Marcé et al., 2010) and nitrate concentration dynam-ics (Vegas-Vilarrúbia et al., 2012) in the Iberian Peninsula have been unambiguously stated. Indeed, all nutrient concentration patterns showing significant supra-annual fre-quencies also showed significant relationships with streamflow in many sites across the basin. In our view this indicates that the effect of atmospheric teleconnections on nitrate
15
and phosphate concentrations was driven by modifications in the streamflow. Since streamflow relies on both precipitation and evapotranspiration, extreme events such as droughts and heat waves promoted by global atmospheric teleconnections can have significant effects on river water quality in the basin. Indeed, the relationship between the partially predictable global climate modes and the occurrence and frequency of
ex-20
treme events is a very active topic in the literature (Coumou and Rahmstorf, 2012), and their links with water quality crisis episodes should be further investigated, especially in the Mediterranean region, where climate extreme events are predicted to increase (García-Ruiz et al., 2011).
5.2 Nutrient trends and local management practices 25
BGD
12, 5259–5291, 2015Detection and attribution of global
change effects
R. Aguilera et al.
Title Page
Abstract Introduction
Conclusions References
Tables Figures
◭ ◮
◭ ◮
Back Close
Full Screen / Esc
Printer-friendly Version
Interactive Discussion
Discussion
P
a
per
|
Discussion
P
a
per
|
Discussion
P
a
per
|
Discussion
P
a
per
|
application of agricultural practices that, in the last three decades, can be associated with a more rational fertilizer application (Lassaletta et al., 2012). Also, the implemen-tation of sewage treatment schemes in the basin can be partly invoked to justify this decrease (Romaní et al., 2010). The dominant role of nitrate concentration trends in the more upstream locations of the basin (mostly included in Cluster 3) suggest that
5
the impact of human activities upstream sampling points were higher in streams, and that these water courses were the most vulnerable to increasing trends. On the other hand, decreasing trends also dominated the time-series in some of the sampling points included in Cluster 3, suggesting that upstream locations are also prone to improve-ment due to remediation measures and best manageimprove-ment practices. Particularly, our
10
analysis suggests that the application of synthetic fertilizers precluded the existence of a decreasing trend in some areas of the basin, but the application of manure as a fer-tilizer actively promoted increasing nitrate concentration trends. While during the last decades manure application has dramatically grown in some specific areas (Terrado et al., 2010), there has been a more rational application of synthetic fertilizers in the
15
basin (Lassaletta et al., 2012).
The overall decrease of phosphate concentration in the Ebro basin since the early 1990s was highlighted by all four extracted patterns. This decreasing trend coincides with the improvement of urban sewage treatment in the most important cities of the Ebro basin (Ibáñez et al., 2008), since most patterns of phosphate dynamics
de-20
rive from point sources. The reduction of phosphate fertilizers in the agriculture could have also resulted in the reduction of phosphate loads exported to rivers and streams (Bouza-Deaño et al., 2008). A similar pattern has been observed in the Loire River (France), where the wastewater treatment plants and the concurrent ban on phospho-rus content in washing powders (Floury et al., 2012) were highly effective. Severe
re-25
asso-BGD
12, 5259–5291, 2015Detection and attribution of global
change effects
R. Aguilera et al.
Title Page
Abstract Introduction
Conclusions References
Tables Figures
◭ ◮
◭ ◮
Back Close
Full Screen / Esc
Printer-friendly Version
Interactive Discussion
Discussion
P
a
per
|
Discussion
P
a
per
|
Discussion
P
a
per
|
Discussion
P
a
per
|
ciated to the different anthropogenic activities that have co-existed in the basin during the study period, but no climatic factor seemed to play any relevant role in shaping decreasing or increasing trends of nutrient concentration.
6 Conclusions
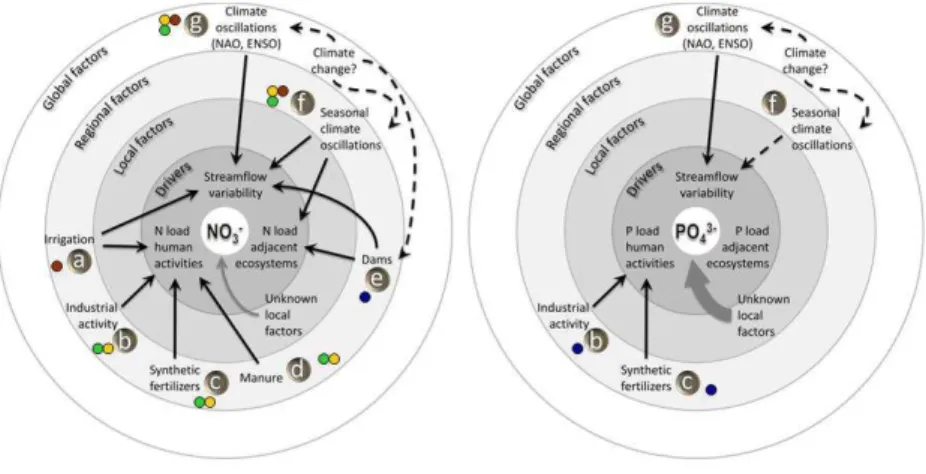
Our results imply that the impact of global change on the dynamics of nitrate
concen-5
tration across the Ebro basin is a multifaceted process that includes regional and global factors while impacts on phosphate concentration depend more on local impacts and less on large-scale factors (Fig. 5).
In the case of nitrate, our analyses have identified the presence of irrigated agricul-ture and its corresponding fertilization management practices (synthetic fertilizers or
10
manure), the presence of industrial activities in the basin, and damming as the main global change factors. Other climatic processes linked to streamflow variability were also identified, but the impact of climate changes on these processes is uncertain and could not be disentangled in this study. These factors shape a complex dynamics in-cluding temporal trends, and interannual and seasonal cycles, with either strong or
15
vanishing relationships with streamflow, and links with phenological processes in ter-restrial ecosystems and reservoirs. Interestingly, the impact of identified factors on this rich dynamics was not homogenous across the basin, but clustered in 4 regions not entirely coherent from a geographic perspective (Fig. 3).
In contrast, phosphate concentration showed a more idiosyncratic behavior. The only
20
relevant global change mechanism acting at large scales is the presence of industrial activities and the application of synthetic fertilizers, which defines higher phosphate concentrations in Cluster 2. The explanatory power of our models was low in the case of phosphate concentration dynamics, meaning that most variability was accounted by factors not considered in our models. Although these factors may include some relevant
25
BGD
12, 5259–5291, 2015Detection and attribution of global
change effects
R. Aguilera et al.
Title Page
Abstract Introduction
Conclusions References
Tables Figures
◭ ◮
◭ ◮
Back Close
Full Screen / Esc
Printer-friendly Version
Interactive Discussion
Discussion
P
a
per
|
Discussion
P
a
per
|
Discussion
P
a
per
|
Discussion
P
a
per
|
local factors, such as the different timing of implementation of wastewater treatment technologies.
Overall, our analysis shows that nitrate concentration dynamics is more responsive to regional and global factors, while global change impacts on phosphate concentration dynamics operate at the small scales of point sources. Anthropogenic land uses seem
5
to play the most relevant role, and appropriate fertilization management may aid in stabilizing temporal trends, thus avoiding future nitrate concentration increases.
The relevance of the inter-annual signals in our nutrient concentration series suggest that any impact of climate change on the intensity and timing of global climate phenom-ena driving inter-annual streamflow oscillations can also exert a significant impact on
10
river nutrient dynamics. This would be expressed more likely in variations of the preva-lence of extreme events in streamflow that would impact nutrient dynamics. This may add to a multi-stressor situation typical from freshwaters in Mediterranean countries, guaranteeing future research on this topic.
Acknowledgements. This work was supported by Spanish Ministry of Economy and
Com-15
petitiveness through the project SCARCE (Consolider-Ingenio 2010 CSD2009-00065) and by a Doctoral Grant (FI-DGR 2012) from the Catalan Government.
References
Argerich, A., Johnson, S. L., Sebestyen, S. D., Rhoades, C. C., Greathouse, E., Knoepp, J. D., Adams, M. B., Likens, G. E., Campbell, J. L., McDowell, W. H., Scatena, F. N., and Ice, G. G.: 20
Trends in stream nitrogen concentrations for forested reference catchments across the USA, Environ. Res. Lett., 8, 1–8, 2013.
Barton, K.: MuMIn: multi-model inference, R-Package, CRAN, Vienna, 2014.
Benítez-Gilabert, M., Alvarez-Cobelas, M., and Angeler, D. G.: Effects of climatic change on stream water quality in Spain, Climatic Change, 103, 339–352, 2010.
25
BGD
12, 5259–5291, 2015Detection and attribution of global
change effects
R. Aguilera et al.
Title Page
Abstract Introduction
Conclusions References
Tables Figures
◭ ◮
◭ ◮
Back Close
Full Screen / Esc
Printer-friendly Version
Interactive Discussion
Discussion
P
a
per
|
Discussion
P
a
per
|
Discussion
P
a
per
|
Discussion
P
a
per
|
Boithias, L., Acuña, V., Vergoñós, L., Ziv, G., Marcé, R., and Sabater, S.: Assessment of the wa-ter supply: demand ratios in a Mediwa-terranean basin under different global change scenarios and mitigation alternatives, Sci. Total Environ., 470–471, 567–577, 2014.
Boucher, O., Myhre, G., and Myhre, A.: Direct human influence of irrigation on atmospheric water vapour and climate, Clim. Dynam., 22, 597–603, 2004.
5
Bouza-Deaño, R., Ternero-Rodríguez, M., and Fernández-Espinosa, A. J.: Trend study and assessment of surface water quality in the Ebro River (Spain), J. Hydrol., 361, 227–239, 2008.
Bovolo, C. I., Blenkinsop, S., Majone, B., Zambrano-Bigiarini, M., Fowler, H. J., Bellin, A., Bur-ton, A., Barceló, D., Grathwohl, P., and Barth, J. A. C.: Climate change, water resources and 10
pollution in the Ebro Basin: towards an integrated approach, in: The Ebro River Basin, edited by: Barceló, D. and Petrovic, M., Springer-Verlag, Berlin Heidelberg, 295–329, 2011.
Caille, F., Riera, J. L., and Rosell-Melé, A.: Modelling nitrogen and phosphorus loads in a Mediterranean river catchment (La Tordera, NE Spain), Hydrol. Earth Syst. Sci., 16, 2417– 2435, doi:10.5194/hess-16-2417-2012, 2012.
15
Carpenter, E. J. and Dunham, S.: Nitrogenous nutrient uptake, primary production, and species composition of phytoplankton in the Carmans River Estuary, Long Island, New York, Limnol. Oceanogr., 30, 513–526, 1985.
Chang, H.: Spatial analysis of water quality trends in the Han River basin, South Korea, Water Res., 42, 3285–3304, 2008.
20
Cooper, S. D., Lake, P. S., Sabater, S., Melack, J. M., and Sabo, J. L.: The effects of land use changes on streams and rivers in mediterranean climates, Hydrobiologia, 719, 383–425, 2013.
Coumou, D. and Rahmstorf, S.: A decade of weather extremes, Nat. Clim. Change, 2, 491–496, 2012.
25
Cox, D. R. and Snell, E. J.: The analysis of binary data, Chapman and Hall, London, 1989. Donner, S. D., Coe, M. T., Lenters, J. D., Twine, T. E., and Foley, J. A.: Modeling the impact of
hydrological changes on nitrate transport in the Mississippi River Basin from 1955 to 1994, Global Biogeochem. Cy., 16, 1–18, 2002.
Estrada, F., Perron, P., Gay-García, C., and Martínez-López, B.: A time-series analysis of the 30
BGD
12, 5259–5291, 2015Detection and attribution of global
change effects
R. Aguilera et al.
Title Page
Abstract Introduction
Conclusions References
Tables Figures
◭ ◮
◭ ◮
Back Close
Full Screen / Esc
Printer-friendly Version
Interactive Discussion
Discussion
P
a
per
|
Discussion
P
a
per
|
Discussion
P
a
per
|
Discussion
P
a
per
|
Floury, M., Delattre, C., Ormerod, S. J., and Souchon, Y.: Global vs. local change effects on a large European river, Sci. Total Environ., 441, 220–229, 2012.
Gallart, F., Delgado, J., Beatson, S. J. V., Posner, H., Llorens, P., and Marcé, R.: Analysing the effect of global change on the historical trends of water resources in the headwaters of the Llobregat and Ter river basins (Catalonia, Spain), Phys. Chem. Earth, 36, 655–661, 2011. 5
García-Ruiz, J. M., López-Moreno, J. I., Vicente-Serrano, S. M., Lasanta-Martínez, T., and Be-guería, S.: Mediterranean water resources in a global change scenario, Earth-Sci. Rev., 105, 121–139, 2011.
Ghil, M., Allen, M. R., Dettinger, M. D., Ide, K., Kondrashov, D., Mann, M. E., Robertson, A. W., Saunders, A., Tian, Y., Varadi, F., and Yiou, P.: Advanced spectral methods for climatic time 10
series, Rev. Geophys., 40, 1–41, 2002.
Grimm, N. B., Faeth, S. H., Golubiewski, N. E., Redman, C. L., Wu, J., Bai, X., and Briggs, J. M.: Global change and the ecology of cities, Science, 319, 756–760, 2008.
Grizzetti, B., Bouraoui, F., and Aloe, A.: Changes of nitrogen and phosphorus loads to European seas, Glob. Change Biol., 18, 769–782, 2011.
15
Holmes, E. E., Ward, E. J., and Wills, K.: MARSS: multivariate autoregressive state-space models for analyzing time-series data, R Journal, 4, 11–19, 2012.
Holmes, E. E., Ward, E. J., and Wills, K.: MARSS: multivariate autoregressive state-space modeling, R-Package version 3.4, CRAN, Vienna, 2013.
Huber, D. B., Mechem, D. B., and Brunsell, N. A.: The effects of great plains irrigation on the 20
surface energy balance, regional circulation, and precipitation, Climate, 2, 103–128, 2014. Ibáñez, C., Prat, N., Duran, C., Pardos, M., Munné, A., Andreu, R., Caiola, N., Cid, N.,
Ham-pel, H., Sánchez, R., and Trobajo, R.: Changes in dissolved nutrients in the lower Ebro river: causes and consequences, Limnetica, 27, 131–142, 2008.
Kang, S. and Lin, H.: Wavelet analysis of hydrological and water quality signals in an agricultural 25
watershed, J. Hydrol., 338, 1–14, 2007.
Keener, V. W., Feyereisen, G. W., Lall, U., Jones, J. W., Bosch, D. D., and Lowrance, R.: El-Niño/Southern Oscillation (ENSO) influences on monthly NO3 load and concentration, stream flow and precipitation in the Little River Watershed, Tifton, Georgia (GA), J. Hydrol., 381, 352–363, 2010.
30
BGD
12, 5259–5291, 2015Detection and attribution of global
change effects
R. Aguilera et al.
Title Page
Abstract Introduction
Conclusions References
Tables Figures
◭ ◮
◭ ◮
Back Close
Full Screen / Esc
Printer-friendly Version
Interactive Discussion
Discussion
P
a
per
|
Discussion
P
a
per
|
Discussion
P
a
per
|
Discussion
P
a
per
|
Lane, L. J., Nichols, M. H., and Osborn, H. B.: Time series analyses of global change data, Environ. Pollut., 83, 63–68, 1994.
Lassaletta, L., García-Gómez, H., Gimeno, B. S., and Rovira, J. V.: Agriculture-induced increase in nitrate concentrations in stream waters of a large Mediterranean catchment over 25 years (1981–2005), Sci. Total Environ., 407, 6034–6043, 2009.
5
Lassaletta, L., Romero, E., Billen, G., Garnier, J., García-Gómez, H., and Rovira, J. V.: Spa-tialized N budgets in a large agricultural Mediterranean watershed: high loading and low transfer, Biogeosciences, 9, 57–70, doi:10.5194/bg-9-57-2012, 2012.
Lovett, G. M., Burns, D. A., Driscoll, C. T., Jenkins, J. C., Mitchell, M. J., Rustad, L., Shan-ley, J. B., Likens, G. E., and Haeuber, R.: Who needs environmental monitoring?, Front. 10
Ecol. Environ., 5, 253–260, 2007.
Ludwig, W., Dumont, E., Meybeck, M., and Heussner, S.: River discharges of water and nutri-ents to the Mediterranean and Black Sea: major drivers for ecosystem changes during past and future decades?, Prog. Oceanogr., 80, 199–217, 2009.
Marcé, R., Rodríguez-Arias, M. A., García, J. C., and Armengol, J.: El Niño Southern Oscillation 15
and climate trends impact reservoir water quality, Glob. Change Biol., 16, 2857–2865, 2010. Meybeck, M.: Global analysis of river systems: from Earth system controls to Anthropocene
syndromes, Phil. Trans. R. Soc. Lond. B, 358, 1935–1955, 2003.
Milly, P. C. D., Dunne, K. A., and Vecchia, A. V.: Global pattern of trends in streamflow and water availability in a changing climate, Nature, 438, 347–350, 2005.
20
Parmesan, C. and Yohe, G.: A globally coherent fingerprint of climate change impacts across natural systems, Nature, 421, 37–42, 2003.
Pinheiro, J. C. and Bates, D. M.: Mixed effects models in S and S-PLUS, Springer, New York, 2000.
Pinheiro, J. C., Bates, D. M., Debroy, S., Sarkar, D., and R Development Core Team: Nlme: lin-25
ear and nonlinear mixed effects models, R-Package version 3.1-105, CRAN, Vienna, 2012. Rabalais, N. N., Turner, R. E., Díaz, R. J., and Justic, D.: Global change and eutrophication of
coastal waters, ICES J. Mar. Sci., 66, 1528–1537, 2009.
Rahim, K. and Burr, W.: Multitaper: multitaper spectral analysis tools, R-Package version 1.0-8, CRAN, Vienna, 2013.
30
BGD
12, 5259–5291, 2015Detection and attribution of global
change effects
R. Aguilera et al.
Title Page
Abstract Introduction
Conclusions References
Tables Figures
◭ ◮
◭ ◮
Back Close
Full Screen / Esc
Printer-friendly Version
Interactive Discussion
Discussion
P
a
per
|
Discussion
P
a
per
|
Discussion
P
a
per
|
Discussion
P
a
per
|
Rodó, X., Baert, E., and Comín, F. A.: Variations in seasonal rainfall in Southern Europe during the present century: relationships with the North Atlantic Oscillation and the El Niño-Southern Oscillation, Clim. Dynam., 13, 275–284, 1997.
Romaní, A. M., Sabater, S., and Muñoz, I.: The physical framework and historic human influ-ences in the Ebro River, in: The Ebro River Basin, edited by: Barceló, D. and Petrovic, M., 5
Springer-Verlag, Berlin Heidelberg, 1–20, 2010.
Rosenzweig, C., Karoly, D., Vicarelli, M., Neofotis, P., Wu, Q., Casassa, G., Menzel, A., Root, T. L., Estrella, N., Seguin, B., Tryjanowski, P., Liu, C., Rawlins, S., and Imenson, A.: Attributing physical and biological impacts to anthropogenic climate change, Nature, 453, 353–357, 2008.
10
Sabater, S. and Tockner, K.: Effects of hydrologic alterations on the ecological quality of river ecosystems, in: Water Scarcity in the Mediterranean: Prospectives Under Global Change, edited by: Sabater, S. and Barceló, D., Springer-Verlag, Berlin Heidelberg, 15–39, 2010. Sabater, S., Feio, M. J., Graça, M. A. S., Muñoz, I., and Romaní, A.: The Iberian Rivers, in:
Rivers of Europe, edited by: Tockner, K., Robinson, C., and Uhlinger, U., Academic Press, 15
London-Burlington-San Diego 113–149, 2009.
Tatariw, C., Chapman, E. L., Sponseller, R. A., Mortazavi, B., and Edmonds, J. W.: Denitrifica-tion in a large river: consideraDenitrifica-tion of geomorphic controls on microbial activity and community structure, Ecology, 94, 2249–2262, 2013.
Terrado, M., Barceló, D., and Tauler, R.: Multivariate curve resolution of organic pollution pat-20
terns in the Ebro River surface water–groundwater–sediment–soil system, Anal. Chim. Acta, 657, 19–27, 2010.
Tilman, D., Fargione, J., Wolff, B., D’Antonio, C., Dobson, A., Howarth, R., Schindler, D., Schlensinger, W. H., Simberloff, D., and Swackhamer, D.: Forecasting agriculturally driven global environmental change, Science, 292, 281–284, 2001.
25
U.S. Global Change Research Act: Public Law 101-606(11/16/90) 104 Stat. 3096-3104, United States Congress, Washington DC, 1990.
Vegas-Vilarrúbia, T., Sigró, J., and Giralt, S.: Connection between El Niño-Southern Oscillation events and river nitrate concentrations in a Mediterranean river, Sci. Total Environ., 426, 446–453, 2012.
30
BGD
12, 5259–5291, 2015Detection and attribution of global
change effects
R. Aguilera et al.
Title Page
Abstract Introduction
Conclusions References
Tables Figures
◭ ◮
◭ ◮
Back Close
Full Screen / Esc
Printer-friendly Version
Interactive Discussion
Discussion
P
a
per
|
Discussion
P
a
per
|
Discussion
P
a
per
|
Discussion
P
a
per
|
Yue, S., Pilon, P., Phinney, B., and Cavadias, G.: The influence of autocorrelation on the ability to detect trend in hydrological series, Hydrol. Process., 16, 1807–1829, 2002.
BGD
12, 5259–5291, 2015Detection and attribution of global
change effects
R. Aguilera et al.
Title Page
Abstract Introduction
Conclusions References
Tables Figures
◭ ◮
◭ ◮
Back Close
Full Screen / Esc
Printer-friendly Version
Interactive Discussion
Discussion
P
a
per
|
Discussion
P
a
per
|
Discussion
P
a
per
|
Discussion
P
a
per
|
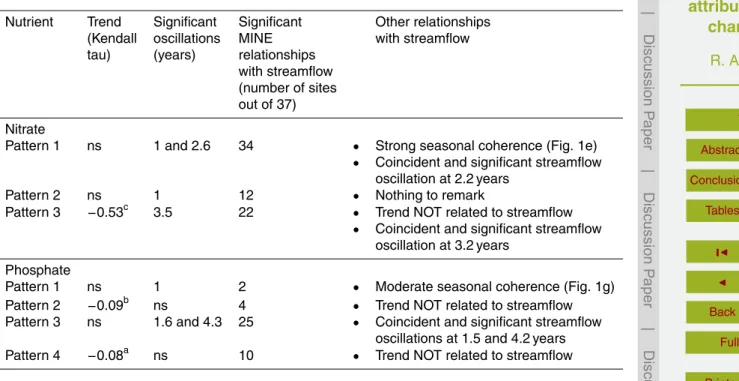
Table 1.Characterization of the temporal variability and relationships with streamflow of nutrient patterns detected with DFA in the Ebro basin.
Nutrient Trend Significant Significant Other relationships (Kendall oscillations MINE with streamflow tau) (years) relationships
with streamflow (number of sites out of 37)
Nitrate
Pattern 1 ns 1 and 2.6 34 • Strong seasonal coherence (Fig. 1e) • Coincident and significant streamflow
oscillation at 2.2 years
Pattern 2 ns 1 12 • Nothing to remark
Pattern 3 −0.53c 3.5 22 • Trend NOT related to streamflow • Coincident and significant streamflow
oscillation at 3.2 years
Phosphate
Pattern 1 ns 1 2 • Moderate seasonal coherence (Fig. 1g) Pattern 2 −0.09b ns 4 • Trend NOT related to streamflow Pattern 3 ns 1.6 and 4.3 25 • Coincident and significant streamflow
oscillations at 1.5 and 4.2 years Pattern 4 −0.08a ns 10 • Trend NOT related to streamflow
BGD
12, 5259–5291, 2015Detection and attribution of global
change effects
R. Aguilera et al.
Title Page
Abstract Introduction
Conclusions References
Tables Figures
◭ ◮
◭ ◮
Back Close
Full Screen / Esc
Printer-friendly Version
Interactive Discussion
Discussion
P
a
per
|
Discussion
P
a
per
|
Discussion
P
a
per
|
Discussion
P
a
per
|
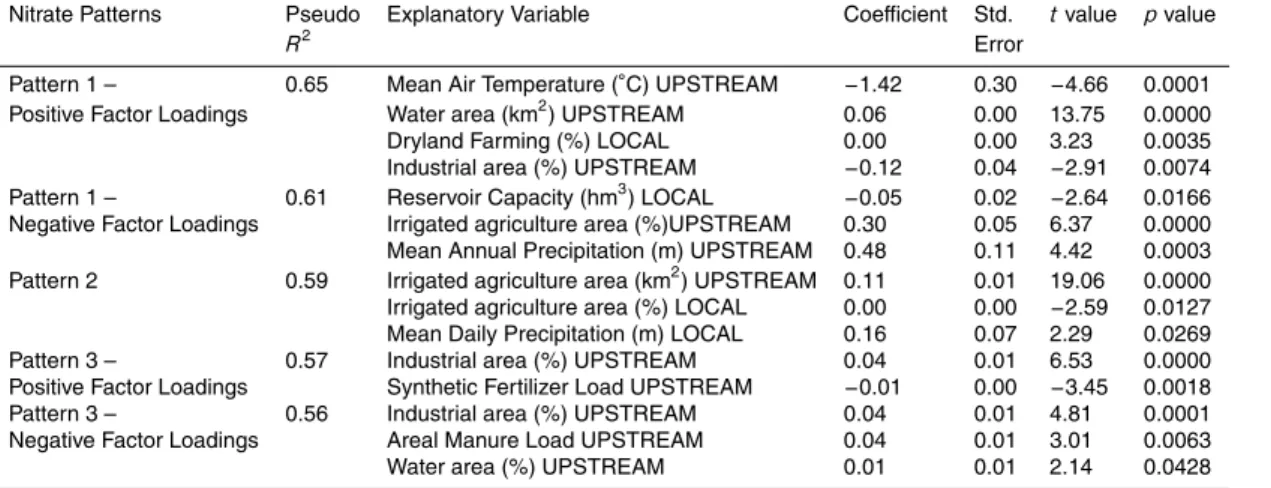
Table 2.GLS resulting potential drivers involved in the spatiotemporal variability of nitrate pat-terns in the Ebro basin.
Nitrate Patterns Pseudo Explanatory Variable Coefficient Std. tvalue pvalue
R2 Error
Pattern 1 – 0.65 Mean Air Temperature (◦C) UPSTREAM
−1.42 0.30 −4.66 0.0001
Positive Factor Loadings Water area (km2) UPSTREAM 0.06 0.00 13.75 0.0000 Dryland Farming (%) LOCAL 0.00 0.00 3.23 0.0035 Industrial area (%) UPSTREAM −0.12 0.04 −2.91 0.0074
Pattern 1 – 0.61 Reservoir Capacity (hm3) LOCAL −0.05 0.02 −2.64 0.0166
Negative Factor Loadings Irrigated agriculture area (%)UPSTREAM 0.30 0.05 6.37 0.0000 Mean Annual Precipitation (m) UPSTREAM 0.48 0.11 4.42 0.0003 Pattern 2 0.59 Irrigated agriculture area (km2) UPSTREAM 0.11 0.01 19.06 0.0000 Irrigated agriculture area (%) LOCAL 0.00 0.00 −2.59 0.0127
Mean Daily Precipitation (m) LOCAL 0.16 0.07 2.29 0.0269 Pattern 3 – 0.57 Industrial area (%) UPSTREAM 0.04 0.01 6.53 0.0000 Positive Factor Loadings Synthetic Fertilizer Load UPSTREAM −0.01 0.00 −3.45 0.0018
BGD
12, 5259–5291, 2015Detection and attribution of global
change effects
R. Aguilera et al.
Title Page
Abstract Introduction
Conclusions References
Tables Figures
◭ ◮
◭ ◮
Back Close
Full Screen / Esc
Printer-friendly Version
Interactive Discussion
Discussion
P
a
per
|
Discussion
P
a
per
|
Discussion
P
a
per
|
Discussion
P
a
per
|
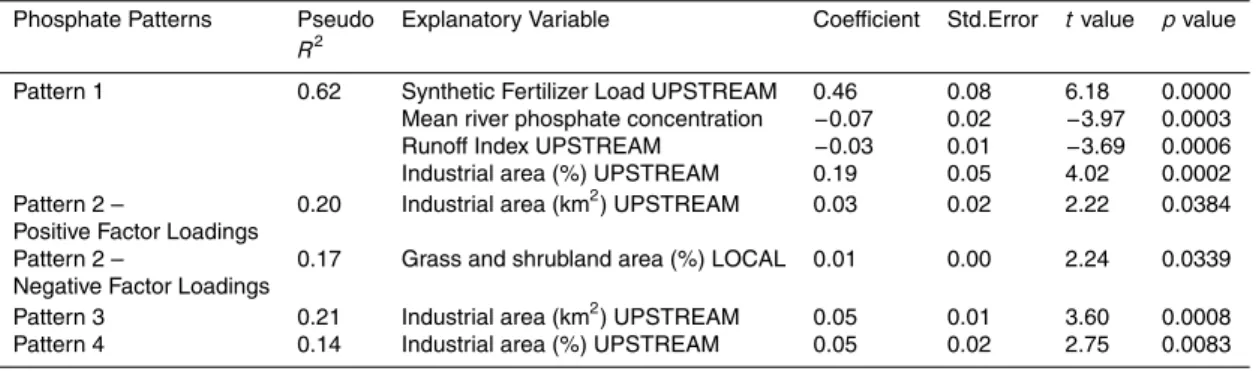
Table 3.GLS resulting potential drivers explaining the spatiotemporal variability of phosphate patterns in the Ebro basin.
Phosphate Patterns Pseudo Explanatory Variable Coefficient Std.Error tvalue pvalue
R2
Pattern 1 0.62 Synthetic Fertilizer Load UPSTREAM 0.46 0.08 6.18 0.0000 Mean river phosphate concentration −0.07 0.02 −3.97 0.0003
RunoffIndex UPSTREAM −0.03 0.01 −3.69 0.0006
Industrial area (%) UPSTREAM 0.19 0.05 4.02 0.0002 Pattern 2 – 0.20 Industrial area (km2) UPSTREAM 0.03 0.02 2.22 0.0384 Positive Factor Loadings
Pattern 2 – 0.17 Grass and shrubland area (%) LOCAL 0.01 0.00 2.24 0.0339 Negative Factor Loadings
BGD
12, 5259–5291, 2015Detection and attribution of global
change effects
R. Aguilera et al.
Title Page
Abstract Introduction
Conclusions References
Tables Figures
◭ ◮
◭ ◮
Back Close
Full Screen / Esc
Printer-friendly Version
Interactive Discussion
Discussion
P
a
per
|
Discussion
P
a
per
|
Discussion
P
a
per
|
Discussion
P
a
per
|
0 40 80 160 240 320
Kilometers
BGD
12, 5259–5291, 2015Detection and attribution of global
change effects
R. Aguilera et al.
Title Page
Abstract Introduction
Conclusions References
Tables Figures
◭ ◮
◭ ◮
Back Close
Full Screen / Esc
Printer-friendly Version
Interactive Discussion
Discussion
P
a
per
|
Discussion
P
a
per
|
Discussion
P
a
per
|
Discussion
P
a
per
|