www.atmos-chem-phys.net/10/12233/2010/ doi:10.5194/acp-10-12233-2010
© Author(s) 2010. CC Attribution 3.0 License.
Chemistry
and Physics
Technical Note: Formal blind intercomparison of HO
2
measurements in the atmosphere simulation chamber SAPHIR
during the HOxComp campaign
H. Fuchs1, T. Brauers1, H.-P. Dorn1, H. Harder2, R. H¨aseler1, A. Hofzumahaus1, F. Holland1, Y. Kanaya3, Y. Kajii4, D. Kubistin2, S. Lou1,5, M. Martinez2, K. Miyamoto4, S. Nishida4, M. Rudolf2, E. Schlosser1,*, A. Wahner1,
A. Yoshino4, and U. Schurath6
1Forschungszentrum J¨ulich, Institut f¨ur Energie- und Klimaforschung: Troposph¨are (IEK-8), 52428 J¨ulich, Germany 2Max Planck Institute for Chemistry, Atmospheric Chemistry Dept., 55020 Mainz, Germany
3Frontier Research Center for Global Change (currently Research Institute for Global Change), Japan Agency for
Marine-Earth Science and Technology, Yokohama 236-0001, Japan
4Tokyo Metropolitan University, Department of Applied Chemistry, Tokyo 192-0397, Japan 5Shanghai Jiatong University, School of Environmental Science and Technology, Shanghai, China 6Karlsruhe Institute of Technology (KIT), IMK-AAF, 76021 Karlsruhe, Germany
*now at: Karlsruhe Institute of Technology (KIT), IMK-AAF, 76021 Karlsruhe, Germany
Received: 2 September 2010 – Published in Atmos. Chem. Phys. Discuss.: 6 September 2010 Revised: 26 November 2010 – Accepted: 8 December 2010 – Published: 23 December 2010
Abstract. Hydroperoxy radical (HO2) concentrations were
measured during the formal blind intercomparison campaign HOxComp carried out in J¨ulich, Germany, in 2005. Three in-struments detected HO2via chemical conversion to hydroxyl
radicals (OH) and subsequent detection of the sum of OH and HO2 by laser induced fluorescence (LIF). All instruments
were based on the same detection and calibration scheme. Because measurements by a MIESR instrument failed during the campaign, no absolute reference measurement was avail-able, so that the accuracy of individual instruments could not be addressed. Instruments sampled ambient air for three days and were attached to the atmosphere simulation chamber SAPHIR during the second part of the campaign. Six experi-ments of one day each were conducted in SAPHIR, where air masses are homogeneously mixed, in order to investigate the performance of instruments and to determine potential inter-ferences of measurements under well-controlled conditions. Linear correlation coefficients (R2) between measurements of the LIF instruments are generally high and range from 0.82 to 0.98. However, the agreement between measure-ments is variable. The regression analysis of the entire data set of measurements in SAPHIR yields slopes between 0.69
Correspondence to:T. Brauers ([email protected])
to 1.26 and intercepts are smaller than typical atmospheric daytime concentrations (less than 1 pptv). The quality of fit parameters improves significantly, when data are grouped into data subsets of similar water vapor concentrations. Be-cause measurements of LIF instruments were corrected for a well-characterized water dependence of their sensitivities, this indicates that an unknown factor related to water vapor affected measurements in SAPHIR. Measurements in ambi-ent air are also well-correlated, but regression parameters dif-fer from results obtained from SAPHIR experiments. This could have been caused by differences in HO2concentrations
in the sampled air at the slightly different locations of instru-ments.
1 Introduction
Hydroperoxy radicals (HO2) play an important role in the
photochemical degradation of atmospheric trace gases and in the formation of secondary air pollutants. They are produced in the radical recycling of the hydroxyl radical (OH), the ma-jor atmospheric oxidant, via the reaction of OH with CO and organic compounds (e.g., Finlayson-Pitts and Pitts Jr., 2000). Direct sources of HO2 radicals are the photolysis
the ozonolysis of alkenes (e.g., Geyer et al., 2003; Kanaya et al., 2007). In NOx-rich environments, peroxy radicals
react predominantly with NO reforming OH and producing NO2. This reaction and the following photolysis of NO2
con-stitute also fundamental steps in the photochemical forma-tion of tropospheric ozone in polluted air. In very clean air at low NO, however, HO2has the potential to destroy ozone.
The measurement of HO2concentration is challenging for
several reasons. (1) Atmospheric concentrations are small (some ten parts per trillion per volume, pptv, e.g. Monks, 2005; Kanaya et al., 2007; Lelieveld et al., 2008; Hofzuma-haus et al., 2009), so that a high detection sensitivity is re-quired to achieve a good signal-to-noise ratio at a reason-able time resolution. (2) Their high reactivity may cause loss of HO2in the inlet system of instruments (e.g. Mihele and
Hastie, 1998). (3) Calibration of instruments is difficult, be-cause a radical source producing an accurately known radical concentration is required.
Four different techniques have been developed that are applied for atmospheric HO2 detection (Heard and Pilling,
2003): (1) Peroxy Radical Chemical Amplifier (PERCA), (2) Peroxy Radical Chemical Ionization Mass Spectrometry (ROxMax/PerCIMS), (3) Laser Induced Fluorescence (LIF), and (4) Matrix Isolation Electron Spin Resonance Spec-troscopy (MIESR).
PERCA and PerCIMS/ROxMas use chemical amplifica-tion by repetitive recycling of HO2in a chemical chain
reac-tion to produce an amount of a product species that is well measurable. PERCA instruments produce NO2, which is
detected by a luminol-chemiluminescence reaction, whereas PerCIMS/ROxMas techniques detect H2SO4 by chemical
ionization mass spectrometry. LIF systems convert HO2 to
OH radicals by adding excess NO to the sampled air. OH radicals are then detected via resonant laser-induced fluo-rescence at 308 nm. MIESR traps radicals in an ice matrix formed by D2O on a cold finger at a temperature of 77 K.
The sample is analyzed by means of electron spin resonance spectroscopy (ESR) in the laboratory. The MIESR technique is the only one of the four techniques, which does not require calibration.
The experimental difficulties and the large experimental effort of atmospheric HO2detection limit the number of
in-struments used in field experiments. There have been only three attempts to intercompare instruments and all included two instruments only. Thus, the quality and comparability of measurements from different instruments is not well-known. Measurements by LIF and MIESR were compared during the BERLIOZ field campaign (Platt et al., 2002; Mihelcic et al., 2003) and agreed to 3%. The linear correlation coef-ficient, R2, was 0.88. In another, more recent study, HO2
concentrations were compared between a PerCIMS and an LIF instrument in two phases: (1) by mutual exchange of calibration sources, (2) by ambient air measurements (Ren et al., 2003). In the calibration intercomparison, very good agreement was found within 2% for PerCIMS sampling from
the LIF calibration source and within 4% for LIF sampling from the PerCIMS calibration source. Both calibration tech-niques were based on the production of OH by water photol-ysis at 185 nm (see below). Good agreement was also shown in a side-by-side intercomparison of ambient HO2
concen-trations, which agreed to 4% and exhibited a linear correla-tion coefficient ofR2=0.85. Recently, however, Ren et al. (2008) reported a change of the calibration factor of the LIF instrument. This may possibly require revision of the com-parison results. The latest comcom-parison of instruments was conducted between an LIF instrument (ROxLIF), which is also capable of detecting the sum of organic peroxy radi-cals (RO2), and MIESR during two experiments in the
at-mosphere simulation chamber SAPHIR in J¨ulich, Germany, after the HOxComp campaign in 2007 (Fuchs et al., 2009). Measurements agreed on average to 2%.
The HOxComp campaign in J¨ulich, Germany, from 9 to 23 July 2005 was an effort supported by the EU pro-gram ACCENT to bring together a larger number of instru-ments, which are capable of detecting OH and HO2
rad-icals, in order to intercompare measurements in a formal blind manner. Four LIF instruments were successfully de-ployed during this campaign: (1) the instrument of the Fron-tier Research Center for Global Change, Yokohama, Japan, (FRCGC-LIF), (2) two instruments from the Forschungszen-trum J¨ulich, Germany, one for deployment in field campaigns that took part only during the ambient air sampling period (FZJ-LIF-ambient) and one that is permanently attached to the SAPHIR chamber (FZJ-LIF-SAPHIR), (3) the instru-ment of the Max-Planck Institute for Chemistry in Mainz, Germany (MPI-LIF). Another LIF instrument from the Uni-versity of Leeds took part in the campaign, but could not per-form measurements, because of a failure of the laser system. The MIESR instrument from the Forschungszentrum J¨ulich took samples during the campaign, but data were rejected (see below for details). Various instruments measured con-centrations of other trace gases such as ozone, nitrogen ox-ides and volatile organic compounds (VOCs) (see Schlosser et al. (2009) for details). Three days of ambient air sampling were followed by six experiments in the SAPHIR chamber.
The intercomparison of data was done in a formal blind way. Experimental details were known to the referee only and data exchange between the participating groups was not allowed until data were finalized 8 weeks after the campaign. Preliminary data were given to the referee on a daily basis. Questionable data points were marked in the data set. They are excluded from the analysis here. Data of the FZJ-LIF were changed after the data submission deadline, because a systematic error in the calculation of the flow in the calibra-tion source was discovered (see Schlosser et al. (2009) for details). The correction increased HO2concentrations for the
2 Instruments
2.1 Matrix Isolation and Electron Spin Resonance Spectroscopy (MIESR)
For the detection of HO2radicals by the MIESR technique,
radicals are collected during the experiment and samples are analyzed later in the laboratory. A detailed description of the instrument and the analysis procedure can be found in Mihelcic et al. (1985, 1990). Concentrations of HO2, RO2,
CH3C(O)O2, NO3 and NO2can be measured. This
instru-ment took samples of ambient air and was also attached to the SAPHIR chamber for two of the experiments. Although HO2 concentration data were submitted to the referee after
the campaign, data were withdrawn later, because they were most likely corrupted by an instrumental problem. This was recognized, when NO2concentrations by MIESR were
com-pared to NO2concentrations measured by a
chemilumines-cence detector (CLD). This showed an irregular behavior of the MIESR instrument. Differences between NO2
concen-trations were much larger than expected from earlier com-parisons between MIESR and CLD. A similar random rela-tionship between data was found when HO2concentrations
measured by MIESR and all LIF instruments were compared. Again, differences were much larger than observed in previ-ous and later campaign (Platt et al., 2002; Fuchs et al., 2009). Both together indicate that measurements by MIESR were corrupted. The reason for the failure of the analysis of the MIESR samples is not clear. However, the data do not allow a reasonable comparison of HO2measurements and were
re-jected.
2.2 Laser-Induced Fluorescence (LIF)
The LIF method for HO2 detection takes advantage of the
chemical conversion of HO2 to OH radicals, which can be
detected by LIF (Heard and Pilling, 2003). Therefore, LIF instruments for ambient OH detection usually are also ca-pable of detecting HO2. All LIF instruments deployed in
this campaign are similar with respect to their general con-cept of detection, but differ in technical details described in Kanaya et al. (2001); Kanaya and Akimoto (2006); Holland et al. (2003); Martinez et al. (2010) for FRCGC-LIF, FZJ-LIF and MPI-LIF, respectively. In the following, common prop-erties of FZJ-LIF-ambient and FZJ-LIF-SAPHIR are labeled as properties of FZJ-LIF. Properties of the LIF-instruments are summarized in Table 1 and briefly described in the fol-lowing.
All instruments sample air through an inlet pin hole into a low pressure fluorescence cell. The diameter of the pin hole, which also determines the flow rate into the cell, dif-fers between the instruments FRCGC-LIF and MPI-LIF (di-ameter: 1.0 mm, flow rate: 7 slm) and FZJ-LIF (diame-ter: 0.4 mm, flow rate: 1 slm). The distance between the inlet pin hole and detection volume varies between 23 cm
(FRCGC-LIF), 10 cm (FZJ-LIF), and 33 cm (MPI-LIF). OH radicals are excited at a single rovibronic line of the OH A26+(ν′0)←X25(ν”=0)transition by narrow-bandwidth
radiation at 308 nm. All instruments use a pulsed, fre-quency doubled Nd:YAG laser (DPSS) to pump a tunable dye laser, whose wavelength is again frequency doubled, in order to produce the 308 nm radiation. The gas volume in the fluorescence cell is exchanged between two consecutive laser shots to avoid self-generation of OH by ozone photol-ysis (laser repetition rates: FRCGC-LIF: 10 kHz, FZJ-LIF: 8.5 kHz, MPI-LIF: 3 kHz). The laser beam in the FZJ-LIF and FRCGC-LIF instruments passes the fluorescence cell one time whereas a multi-pass White cell system is used in the MPI-LIF instrument.
After laser excitation, the instruments measure the reso-nant OH fluorescence (307–311 nm) by time-delayed gated photon counting (time delay 70 to 160 ns, duration 300 to 500 ns). The measured signals also contain contributions from laser excited stray light, from a laser independent dark signal of the detector, and background from solar radiation entering the measurement cell through the inlet orifice. In the FZJ-LIF and FRCGC-LIF instruments, the solar back-ground is quantified after each laser pulse in a second time gate after laser excited signals have decayed to zero. The solar background is then subtracted from the signal. In or-der to keep the correction small, FRCGC-LIF placed a black aluminum disk coated with halocarbon wax above the noz-zle to shade the inlet against direct sunlight during daytime ambient air sampling (distance 8 cm). In all instruments the laser excitation wavelength is periodically tuned from the OH absorption line to off-resonant wavelengths, in order to mea-sure the laser stray light and dark signal of the detector. In the MPI-LIF instrument, this signal is also used to account for the signal from solar radiation. The laser wavelength is locked to the OH absorption line by observing the signal of a reference cell, in which artificial OH is produced either by a hot filament or by water photolysis at 185 nm.
The conversion of HO2to OH is accomplished by adding
excess NO to the sampled gas. During this campaign all in-struments used pure NO supplied by Linde (purity 99.5%). In the FRCGC-LIF instrument, the NO flow is periodically switched on and off allowing for alternating detection of OH and the sum of OH and HO2 in the same fluorescence cell.
3 sccm pure NO is injected through a loop (diameter 10 mm) of Teflon tubing with small pinholes downstream of the in-let nozzle (NO mixing ratio 0.04% in the sampled air). The distance between the NO injector loop and the OH detec-tion volume is approximately 21 cm. The other instruments have two detection cells for simultaneous detection of OH and HO2. Both LIF-FZJ instruments have two fluorescence
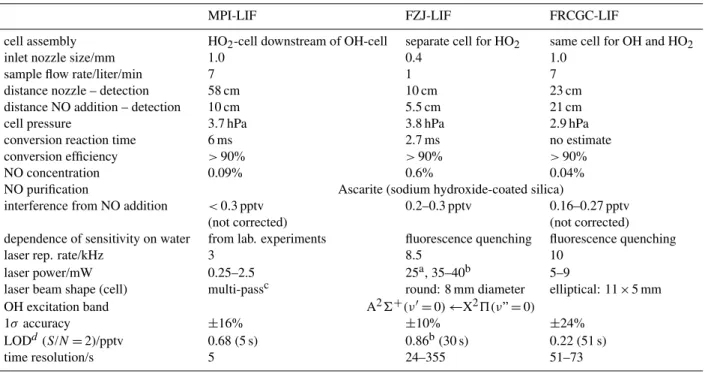
Table 1.Properties of the LIF instruments regarding the HO2detection.
MPI-LIF FZJ-LIF FRCGC-LIF
cell assembly HO2-cell downstream of OH-cell separate cell for HO2 same cell for OH and HO2
inlet nozzle size/mm 1.0 0.4 1.0
sample flow rate/liter/min 7 1 7
distance nozzle – detection 58 cm 10 cm 23 cm
distance NO addition – detection 10 cm 5.5 cm 21 cm
cell pressure 3.7 hPa 3.8 hPa 2.9 hPa
conversion reaction time 6 ms 2.7 ms no estimate
conversion efficiency >90% >90% >90%
NO concentration 0.09% 0.6% 0.04%
NO purification Ascarite (sodium hydroxide-coated silica)
interference from NO addition <0.3 pptv 0.2–0.3 pptv 0.16–0.27 pptv
(not corrected) (not corrected)
dependence of sensitivity on water from lab. experiments fluorescence quenching fluorescence quenching
laser rep. rate/kHz 3 8.5 10
laser power/mW 0.25–2.5 25a, 35–40b 5–9
laser beam shape (cell) multi-passc round: 8 mm diameter elliptical: 11×5 mm OH excitation band A26+(ν′=0)←X25(ν”=0)
1σ accuracy ±16% ±10% ±24%
LODd(S/N=2)/pptv 0.68 (5 s) 0.86b(30 s) 0.22 (51 s)
time resolution/s 5 24–355 51–73
aFZJ-LIF-ambient,bFZJ-LIF-SAPHIR,cmulti-pass system in the cell,dfrom analysis of SAPHIR experiment on 22 July.
gives a reaction time of approximately 2.7 ms for the con-version of HO2. During the period between 18:00 10 July
(all times in UTC) and 18:00 11 July the HO2 cell of the
LIF-FZJ was equipped with an additional conversion reactor upstream of the HO2detection cell, in order to detect
alter-nately HO2 and the sum of HO2 and RO2 as described in
Fuchs et al. (2008). Regarding HO2detection, the main
dif-ferences compared to the previous detection scheme are: (1) a 83 cm long conversion reactor with a residence time of 0.6 s at reduced pressure of 25 hPa is placed upstream of the fluo-rescence cell. (2) Sampled gas is expanded from the conver-sion reactor into the low pressure fluorescence cell at 3.5 hPa through a 4 mm diameter nozzle. (3) Excess CO (mixing ra-tio in the sampled air: 0.17%) is added downstream of the inlet of the conversion reactor. A different approach com-pared to FRCGC-LIF and FZJ-LIF is applied in the MPI-LIF instrument, where a second fluorescence cell is placed 10 cm downstream of the cell in which OH is detected, in order to measure HOxconcentrations. 6 sccm NO is injected through
a loop of perforated tubing placed between both cells, giv-ing a mixgiv-ing ratio of 0.09% in the sampled air. The distance between NO injection and fluorescence detection is approxi-mately 10 cm corresponding to a reaction time of 6 ms.
A small background signal is generally observed, when NO is added to the sampled gas presumably caused by reac-tions of impurities in the NO gas that produce artificial OH. The interference is minimized in all instruments by purifying the NO gas with Ascarite (sodium hydroxide-coated silica)
prior addition in the cell. The value of the background signal is less than 0.3 pptv for the MPI-LIF instrument, between 0.2 and 0.3 pptv for the FZJ-LIF instruments and between 0.16 to 0.27 pptv for the FRCGC-LIF instrument. Only measure-ments by FZJ-LIF were corrected for this small interference. Measurements by other instruments remained uncorrected, because it was not clear, if this offset was constantly present for all measurements.
It is known that ozone can cause an interference in LIF measurements by its photolysis at 308 nm and subsequent re-action of the excited oxygen atom (O1D) with water vapor to form OH radicals. Since the sampled gas in the detection volume is exchanged between two subsequent laser shots, this effect is minimized. A small background may be still present. Measurements by FZJ-LIF-ambient were corrected for this interference (0.07 pptv per 50 ppbv O3, determined
for [H2O]=0.8%), much smaller than HO2 concentrations
encountered during this campaign. All other instruments as-sumed that this potential interference was negligible.
The calibration of all LIF instruments is accomplished by producing OH and HO2radicals by water photolysis at
at 185 nm results in the production of equal concentrations of OH and HO2. The radical concentration sampled by the
instruments depends on the water concentration, the intensity of the 185 nm radiation, duration of irradiation and potential loss of radicals before the air is sampled by the instruments. The water concentration is monitored during calibrations.
Four calibration measurements are taken, in order to cal-culate the HO2sensitivity of FRCGC-LIF. NO in the
fluo-rescence cell and CO in the calibration source is switched on and off for the different calibration modes (see (Kanaya et al., 2001) for details). Light intensity and duration of irradiation is determined by ozone actinometry. This is done by direct measurement of the ozone concentration in the centerline of the radical source, when the calibration source is not on top of the fluorescence cell for FRCGC-LIF.
For calibrating the HO2 sensitivity of FZJ-LIF, OH is
quantitatively converted to HO2by adding excess CO to the
calibration gas in the radical sources, so that the sensitivity is given by one measurement. Like for FRCGC-LIF ozone acti-nometry gives a measurement of the irradiation parameters of the 185 nm light. However, this is accomplished indirectly by observing the light intensity measured by a phototube, which was calibrated against the ozone production, so that changes in the radical production could be detected during calibration measurements.
The calibration factor for the HO2sensitivity of MPI-LIF
is calculated from the difference between two calibration measurements, when (1) only OH is detected (NO in the cell turned off) and (2) the sum of OH and HO2is measured (NO
in the cell turned on) instrument. The radical source of MPI-LIF instrument was characterized by N2O actinometry
be-fore and after the campaign and was found to having been stable for this period.
All instruments applied averaged calibration factors cer-tain periods of the campaign. MPI-LIF applied one fac-tor for ambient air sampling and one for SAPHIR experi-ments, which was 30% larger. FRCGC-LIF applied approx-imately the same calibration factor for ambient air measure-ments and SAPHIR experimeasure-ments, with the exception of the first SAPHIR experiments when the calibration factor was 10% smaller. One calibration factor was applied for the FZJ-LIF-SAPHIR instrument and one for the two configurations of FZJ-LIF-ambient.
The accuracy of HO2measurements is determined by the
uncertainty in the calibration (Table 1). Although the cali-bration scheme is similar for all instruments, accuracies are nearly independent, because the major contribution to the un-certainty is from the determination of specific parameters of the radical sources (mainly the irradiation parameters of the 185 nm light). This is accomplished with different methods as described above.
3 Experiments
The campaign was divided into two parts. During the first three days (9–11 July), the instruments were placed on the paved area between the institute building and the SAPHIR chamber at the Forschungszentrum J¨ulich, Germany, in or-der to compare measurements from ambient air sampling. The distance between instruments was approximately 3.2 m (MPI-LIF and FRCGC-LIF) and 4.5 m (FRCGC-LIF and FZJ-LIF-ambient). The sampling height was 3.5 m for all in-struments. Trace gas concentrations of NO, NO2, HONO,
O3, H2O, HCHO, VOCs and photolysis frequencies were
monitored on site as indicated in Fig. 1.
The area is characterized by small buildings, grassland and trees. It is surrounded by forest, agricultural areas and main roads. Trees, bushes and buildings were nearby the instru-ments. Meteorological conditions were similar throughout the three days of measurements with northerly winds and moderate summer temperatures with a maximum of 28◦C. There was ground fog in the morning and scattered clouds in the afternoon on the first day. The sky was nearly cloud free on the second and third day until a rainstorm evolved in the afternoon of the third day.
The instruments were attached to the SAPHIR chamber for six experiments (17–19, 21–23 July), each of which lasted one day. The chamber is in operation since 2001 and has been described in more detail elsewhere (e.g. Bohn et al., 2005; Rohrer et al., 2005; Wegener et al., 2007). The cham-ber was successfully used in a numcham-ber of intercomparison ex-periments. These experiments proved that the chamber can serve as a homogeneous source for e.g. OVOCs (Apel et al., 2008), OH (Schlosser et al., 2007, 2009) and NO2 (Fuchs
et al., 2010).
The chamber consists of a double wall Teflon film (FEP) of cylindrical shape (length 18 m, diameter 5 m, volume 270 m3). The chamber is maintained at ambient temperature and a small overpressure is applied. A louvre-system can be opened, in order to expose the chamber to natural sunlight, which is well transmitted by the FEP film (transmission of 85% for UV-VIS). The chamber can be filled with ultra pure synthetic air (Linde, purity 99.9999%), or with polluted am-bient air. In both cases, trace gases can be added in known quantities. Turbulent mixing takes place when the chamber is exposed to sunlight. In addition, a fan can be operated, in or-der to ensure rapid mixing for example in the dark chamber. OH and HO2radicals are formed in the chamber by the
pho-tolysis of nitrous acid (HONO) and formaldehyde (HCHO), respectively, both of which are presumably produced by pho-tolytic surface reactions on the Teflon film (Rohrer et al., 2005). Since HONO and HCHO are long-lived species (ap-proximately 15 min for HONO and 1 h for HCHO) compared to the mixing time in the chamber (few minutes), spatial gra-dients of HOx radicals are not expected from these radical
Fig. 1. Location of instruments during the HOxCOMP campaign during ambient air sampling (labels in large photograph) and in-strument inlets during SAPHIR experiments (arrows pointing to positions in the small photograph). Containers of MPI-LIF and FRCGC-LIF were moved underneath the chamber for SAPHIR ex-periments. HO2data in this work were delivered by FRCGC-LIF, MPI-LIF and FZJ-LIF. Numbers indicate positions of instrument inlets measuring: (1) NOx, O3, HCHO, VOC, H2O, CO (red sign:
ambient measurements, green sign: SAPHIR measurements); (2) temperature, relative humidity, HONO; (3) ultrasonic anemometer; (4) filter-radiometer; (5) O3.
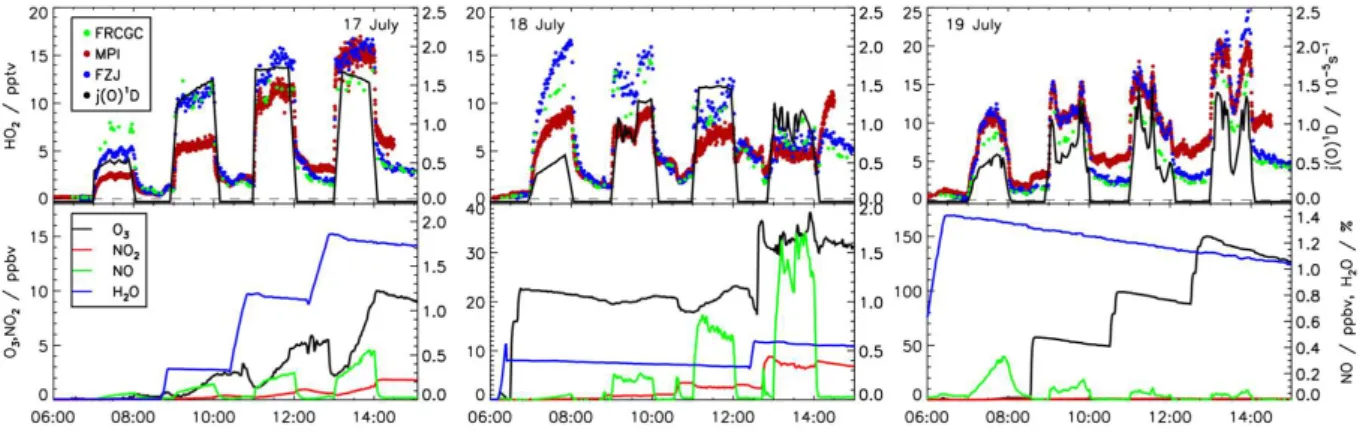
Chemical conditions during the experiments are summa-rized in Table 2. The chamber was prepared for daily experi-ments by flushing out all trace gases. First, Milli-Q water was evaporated and added to the purge flow to adjust the humidity in the chamber on all days with the exception of the first ex-periment, when measurements started with sampling dry air. The roof of the chamber was periodically opened and closed for approximately one hour each during the first three experi-ments (Fig. 3). Concentrations of water vapor (17 July), NOx
(18 July) and O3(19 July), respectively, were increased
step-wise, in order to investigate the influence of these compounds on the performance of the instruments. The fan was operated during the injection of trace gases, which took place during the dark periods of experiments. In addition, CO (mixing ra-tio up to 0.8 ppmv) was added to the chamber air on 18 July at the beginning of the experiment. Ambient air was filled into the chamber before the chamber roof was opened for one ex-periment (21 July, Fig. 4). On this day CO was injected into the chamber at 11:00 (CO mixing ratio 500 ppmv), in order to convert OH to HO2quantitatively. The ozonolysis of alkenes
(1-pentene, trans-butene) were investigated in the dark cham-ber on 22 July. This experiment allowed to produce approx-imately constant HO2concentrations, which were adjusted
by a stepwise increase of alkene concentrations during the experiment. The oxidation of a mix of VOCs (5 ppbv ben-zene, 3 ppbv 1-hexene, 2.5 ppbv m-xylene, 3 ppbv n-octane,
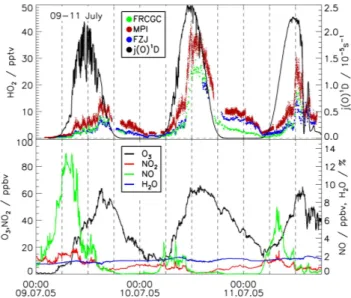
Fig. 2. Time series of HO2mixing ratios during ambient air sam-pling from all instruments at their original time resolution together with the photolysis ratej (O1D)(black line upper panels). In ad-dition, mixing ratios of O3(UV absorption photometer), NO2and
NO (chemiluminescence detector), and water vapor (dewpoint hy-grometer) are shown in the lower panels.
3 ppbv n-pentane, and 1 ppbv isoprene) was investigated in the sunlit chamber during the last experiment (23 July).
4 Results
4.1 Diurnal profiles
During the ambient air sampling period, HO2mixing ratios
exhibited a typical diurnal profile (Fig. 2). In the morn-ing, HO2concentrations were small, when NO mixing ratios
were high, caused by local emissions from traffic within the Forschungszentrum and nearby roads. NO enhances the re-cycling of OH via reaction of HO2leading to the formation of
ozone. HO2followed the diurnal profile of the radiation
dur-ing the rest of the day with maximum HO2mixing ratios of
Table 2. Chemical conditions during the experiments of the HOxComp campaign. SAPHIR experiments on 17–19 and 22–23 July were performed in zero air with added reactants. All mixing ratios are maximum values reached during the experiments.
date NO NO2 O3 CO H2O j (O1D) experiment
ppbv ppbv ppbv ppmv hPa 10−5s−1
ambient 9–11 13 20 65 0.3 21 2.5 ambient air sampling
SAPHIR 17 0.56 2.8 28 0.02 20 1.7 stepwise increase of H2O
18 1.7 8 50 0.8a 12 1.5 stepwise increase of NOx
19 0.34 4 150 0.02 15 1.5 stepwise increase of O3
21 5 14 47 500b 14 1.5 ambient air in the chamber
22 c b 100 0.02 30 d ozonolysis of alkenese
23 0.25 1 45 0.02 11.5 1.4 oxidation of various hydrocarbonsf
aAddition at 06:22,baddition at 11:00, was 150 ppbv before,cno NO
xaddition,ddark chamberr,e1-pentene, trans-butene,fbenzene, 1-hexene, m-xylene, n-octane, n-pentane,
isoprene.
Fig. 3.Same as Fig. 2 for the first three SAPHIR chamber experiments.
midnight. During both nights of the first part of the campaign instruments showed decreasing HO2mixing ratios over the
course of the night. Mixing ratios (up to 4 to 10 pptv) were well above the detection limits of LIF instruments. This indi-cates that non-photolytic sources of HO2such as ozonolysis
could have played a role in the night.
During nearly all chamber experiments, HOx was
pri-marily produced by photolysis reactions. Precursors were HONO and HCHO, which were formed in the illuminated chamber, and ozone, which was added to the chamber air and which was photochemically produced over the course of the experiments (Figs. 3, 4). Because of the production of HOxby photolytical reactions, HO2increased rapidly, when
the chamber roof was opened. Radical loss reactions led to a fast decrease of HO2 once the chamber roof was closed.
During periods, when the chamber was exposed to sunlight, HO2 was well correlated with the pattern of the photolysis
rates. In general, the HO2concentration was enhanced by
trace gases that produce HO2 such as ozone and water
va-por (e.g. 17 and 19 July) and reduced by those which remove HO2such as NO (e.g. 18 July).
Only during the ozonolysis experiment on 22 July HO2
was not formed primarily by photolytic reactions, but by the ozonolysis of 1-pentene (07:30–12:00) and trans-butene (af-ter 12:10). Here, the HO2concentration was determined by
the balance between production in ozonolysis reactions and radical loss reactions. During the first part of the experiment, the consumption of ozone and 1-pentene was small on a time scale of an hour, so that nearly constant levels of HO2were
achieved (Fig. 4). HO2concentrations were varied by a
step-wise increase of the alkene concentration. At 12:10 four ad-ditional injections of trans-2-butene led to the complete con-sumption of ozone. HO2mixing ratios up to 240 pptv were
reached, which decreased after each injection due to the de-creasing ozone concentration.
4.2 HOxmeasurements
Fig. 4.Same as Fig. 2 for the last three SAPHIR experiments. In addition, mixing ratios of organic compounds are shown. The scaling of axis showing HO2mixing ratios changes during the experiment on 22 July, because HO2mixing ratios were rapidly increased to values,
which are ten times higher than encountered during the rest of the campaign. On 21 July the CO mixing ratio was increased to 500 ppmv at 11:00 (not shown here). On 22 July dashed lines in the lower panel show calculated mixing ratios of 1-pentene and trans-butene. The time series is calculated from the times of the addition of alkenes and their dilution and absolute levels are scaled to measurements by GC-FID (dots).
FZJ-LIF-ambient instrument measured during the ambient air sampling period (760 data points). The FZJ-LIF-SAPHIR instrument, which was operated during SAPHIR experi-ments, provided 2582 data points. The different number of total data points were mainly due to differences in the tem-poral resolution of measurements. FRCGC-LIF measured al-ternately OH and HO2 for 73 s each during the ambient air
sampling and the first two SAPHIR chamber experiments. The integration time was shortened to 51 s on 19 July for the rest of the campaign. Short periods between the two mea-surements were used to measure the background signal and to scan and to lock the wavelength, so that the time resolu-tion was further reduced. The integraresolu-tion time of the FZJ-LIF instrument was varied to improve the detection limit during periods when HO2and OH concentrations were small. The
time resolution ranged between 47 and 355 s (mean 100 s) for ambient air sampling and 24 and 74 s (mean 36 s) for SAPHIR experiments. The time resolution of data from the MPI-LIF instrument was 10 s during the whole campaign.
All LIF instruments ran continuously with two exceptions: (1) FCGCG-LIF was not operated during the first night of ambient air sampling and (2) data from the FZJ-LIF-ambient instrument were invalid between 09:10 and 14:25 on 10 July because of an instrumental failure. Furthermore, data from SAPHIR experiments were also excluded from the analysis for all instruments, when a high flow of zero air was used as carrier gas to add water vapor to the chamber air. During these periods inhomogeneity of trace gas concentrations in the chamber could have occurred.
The data are averaged to a 1 min time grid for correla-tion and regression analysis, when the instrument provides a higher time resolution. For each averaged data point the standard deviation and the error from the error propagation of the single values are compared and the larger of both is assigned as an error bar. Figures 6 and 7 show all 1 min HO2
concentrations that are included in the following analysis for ambient sampling and SAPHIR experiments, respectively.
Part of the data from the SAPHIR experiment on 22 July are treated separately in the analysis, because the HO2
mix-ing ratio was increased to very high values (approximately 200 pptv) exceeding all concentrations encountered during the other experiments. The correlation and regression analy-sis is sensitive to the dynamic range of the data set and there-fore this small data subset would dominate the results. In order to avoid that the analysis of the complete data set is bi-ased by potential artifacts in the data during this short period, these data are treated separately. As seen in Fig. 6 deviations between ambient HO2concentrations are significantly larger
during the second night than observed during the day. There-fore, correlation and regression analysis of ambient data are performed separately for daytime and nighttime data.
4.3 Precision of measurements
The statistical measurement errors specified by each group are checked against the observed measurement precision when the HO2 concentration was nearly constant. This
Fig. 5. Frequency distribution of the residuum of a linear fit of measurements on 22 July (1 h periods when HO2 decreased
ap-proximately linearly). The frequency distribution was fitted to a normal distribution (black line). The width agrees with the mean of measurement errors (red line) within the precision of the fit for all instruments.
(between 1 and 25 pptv), when HO2 shows only slow
changes during several 30 min time intervals. A linear fit is applied to the data at their original time resolution. No drift or systematic deviation from a linear function is observed in the fit residual. Accordingly, the standard deviation of the fit residual gives an estimate of the variability of measurements and is compared to the mean of error bars.
Figure 5 shows the frequency distribution of the residual, which is well described by a gaussian error distribution. The width of the gaussian function agrees with the mean of mea-surement errors (indicated by the red lines in Fig. 5) for each
Fig. 6. Time series of HO2mixing ratios during ambient air
sam-pling. Data were averaged to a 1 min time resolution, if the original data set provided a higher time resolution.
Table 3. Linear correlation coefficientR2between data measured by different LIF instruments. Results are shown for measurements in ambient air and in chamber experiments (SAPHIR). Numbers in brackets are the number of valid data points (1 min average). Data after noon on 22 July were excluded (see text for details).
date FRCGC-MPI MPI-FZJ FZJ-FRCGC
ambient daytime 9–11 July 0.97 (334) 0.92 (506) 0.98 (81) ambient nighttime 9–11 July 0.93 (138) 0.92 (222) 0.70 (35)
SAPHIR 17 July 0.62 (85) 0.84 (355) 0.89 (79) 18 July 0.76 (92) 0.75 (413) 0.91 (82) 19 July 0.94 (109) 0.92 (406) 0.97 (99) 21 July 0.96 (123) 0.97 (295) 0.98 (87) 22 July 0.99 (101) 0.99 (328) 0.99 (101) 23 July 0.98 (115) 0.99 (404) 0.99 (125)
SAPHIR 17–23 July 0.82 (625) 0.92 (2201) 0.93 (573) SAPHIRsub 17-23 July 0.97 (386) 0.98 (1347) 0.98 (362)
SAPHIRsub: H2O>0.6% (all experiments) and O3<30 ppbv in the dark (18, 19, 21, 23 July).
instrument. This means that error bars of all instruments give a realistic estimate of the measurements precision on a time scale of 30 min.
4.4 Statistical analysis
The linear correlation between measurements of the different LIF instruments is generally high (Table 3 and Figs. 8, 9). During ambient air sampling all LIF instruments show sim-ilar diurnal and nocturnal profiles (Fig. 6) demonstrated by linear correlation coefficients,R2, within the range of 0.70 and 0.98. Similar values are reached for the combined data set of all SAPHIR experiments with 0.82 and 0.93. How-ever, values of linear correlation coefficients are more vari-able from day-to-day, ranging between 0.99 for all instru-ments on 22 July and 0.62 for MPI-LIF and FRCGC-LIF on 17 July. TheR2 values are higher (0.96–0.99) during the last three experiment days (21–23 July) when significant amounts of VOC were present in the chamber. Not only is the similarity of the single diurnal profiles better for these ex-periments, but also the absolute agreement of the three LIF instruments (Fig. 9).
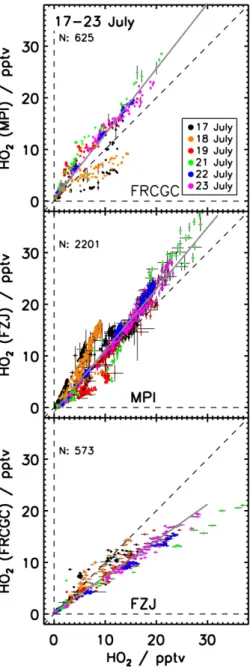
The scatter plots in Fig. 8 (ambient air) and Fig. 9 (SAPHIR) emphasize the general high correlation between the data of the LIF instruments, but also show that the data pairs of the instruments cannot be described by a single linear relationship for all days. It is evident that the overall spread of data is not completely represented by the assigned statisti-cal error bars, but systematic effects seem also to play a role. It is also noteworthy that the scatter plots of individual days are more compact than that of the entire data set.
The data of the three instruments can be further compared by a linear regression analysis. The resulting fit parameters are given in Table 4 and the fit functions are plotted in Figs. 8 and 9 (gray solid lines). Here, the fit procedure from Press
et al. (1992) (FitExy procedure) is used, which accounts for errors in both coordinates. This makes the result invariant of the choice of reference, so that an exchange of the dependent and independent variable gives the inverse result (not shown in Table 4). The large ratios of the sum of squared residuum values and the number of data points, demonstrate that statis-tical errors of data do not cover the deviations from a linear relationship. For this reason, meaningful errors of the fit pa-rameters cannot be derived by error propagation. However, as shown above, error bars are adequate on a time scale of at least 30 min. Thus, other effects on a longer time scale must have influenced the measurements (see below). Regression parameters can give a hint for systematic differences between calibration factors of instruments.
The linear regression of daytime ambient air data results in slopes of 1.46 for FRCGC-LIF versus MPI-LIF, 0.59 for MPI-LIF versus FZJ-LIF and 1.19 for FZJ-LIF versus FRCGC-LIF. Larger deviations between measurements of FZJ-LIF and FRCGC-LIF instruments occur only during the second night, when FZJ-LIF and MPI-LIF instruments mea-sured HO2mixing ratios up to 10 pptv, whereas FRCGC-LIF
measurements show only 3 pptv (Fig. 6). FRCGC-LIF was only operated during the second night. These data behaved systematically different from the daytime data (see color dis-tinction in Fig. 8) and data from both nights together were therefore treated separately (Tables 3 and 4). Linear regres-sion results in slopes of 2.95 for FRCGC-LIF versus MPI-LIF, 0.75 for MPI-LIF versus FZJ-LIF and 0.46 for FZJ-LIF versus FRCGC-LIF. During the second night the FZJ-LIF was operated with the additional ROx converter. Although
during the following day FZJ-LIF the pattern of relationship between the instruments were again similar to the days be-fore, nighttime measurements by FZJ-LIF may have been af-fected by the ROxconverter. For data from SAPHIR
Fig. 8. Correlation of HO2mixing ratios in ambient air on 9–11
July (1 min average). The dashed line is the 1:1 line. The solid lines result of linear fits to the daytime data, only. The scatter of the entire data sets is larger than expected from the precision of single data points.
MPI-LIF), 1.19 (MPI-LIF versus FZJ-LIF) and 0.69 (FZJ-LIF versus FRCGC-(FZJ-LIF). Overall, the slopes of the regres-sion lines indicate that the calibrations of the instruments were different by factors between 1.2 to 1.7 in ambient air (daytime) and SAPHIR, and by factors 2–3 in ambient air at night. These factors can only partly be explained by the combined 1σ accuracies of the calibrations (Table 1).
Exceptionally high HO2 concentrations were produced
during the second half of the ozonolysis experiment on 22 July by the addition of large concentrations of various
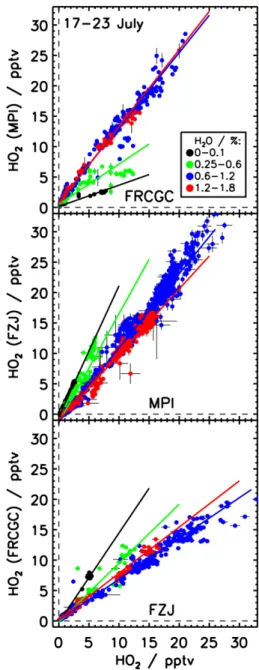
Fig. 9.Correlation of HO2mixing ratios measured during SAPHIR
experiments on 17–23 July. 1 min averaged data are shown. The dashed line is the 1:1 line and the solid lines show the result of linear fits. Like for the ambient data the scatter of the entire data sets is larger than expected from the precision of single data points.
alkenes. Although these data are excluded from the analysis, the comparison of them does not give significantly different results (not shown here) compared to the results from the first part of the experiment. This indicates that the sensitivity of the LIF instruments is constant over a wide dynamic range of HO2concentrations encountered during this experiment.
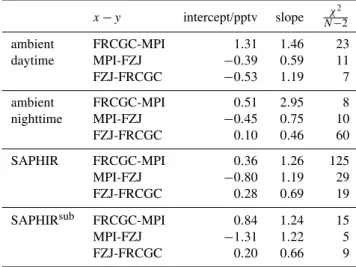
Table 4.Results of the linear regression analysis between HO2data
of the different instruments. Nχ−22 is the sum of squared residuals divided by number of data points. Data are averaged to 1 min time intervals and the standard deviation is taken as error, unless the error propagation of the high resolution data was larger than the standard deviation. Data after noon on 22 July were excluded (see text for details).
x−y intercept/pptv slope Nχ−22 ambient FRCGC-MPI 1.31 1.46 23 daytime MPI-FZJ −0.39 0.59 11 FZJ-FRCGC −0.53 1.19 7
ambient FRCGC-MPI 0.51 2.95 8
nighttime MPI-FZJ −0.45 0.75 10 FZJ-FRCGC 0.10 0.46 60
SAPHIR FRCGC-MPI 0.36 1.26 125 MPI-FZJ −0.80 1.19 29 FZJ-FRCGC 0.28 0.69 19
SAPHIRsub FRCGC-MPI 0.84 1.24 15 MPI-FZJ −1.31 1.22 5 FZJ-FRCGC 0.20 0.66 9
SAPHIRsub: same as in Table 3.
concentrations. Thus, the regression analysis gives no in-dication of a general instrumental offset problems that may bias atmospheric HO2measurements. However, during dark
periods of the experiments measurements by MPI-LIF are significantly higher than those by the other two instruments (see discussion below).
5 Discussion
The above results show that the agreement of measurements by the three LIF instruments is variable. The agreement for ambient air is different from the result for SAPHIR exper-iments (Table 4) and the agreement varies from day to day between different SAPHIR experiments (Fig. 9). Since no absolute HO2reference is available for comparison, it is not
possible to assess absolute concentrations. Only relative de-viations can be discussed. Systematic differences between measurements can occur for different reasons:
1. instruments may sample air with different composition (inhomogeneous environment),
2. instrumental calibrations can have systematic errors, 3. calibrations may lack of reproducibility,
4. intrinsic instrument sensitivities may be variable,
5. detection sensitivities may have unknown dependencies on chemical conditions,
6. chemical interferences may cause artifical HO2signals.
The first four reasons are unlikely explanations for the observed HO2 differences in the SAPHIR chamber, where
the same LIF instruments and a DOAS instrument, which provided calibration-free OH concentrations, showed good absolute agreement, within 13% for OH measurements (Schlosser et al., 2009). Neither the correlation plot between OH LIF measurements (Fig. 7, Schlosser et al., 2009) nor the box and whisker plot of differences between OH DOAS and LIF measurements for SAPHIR experiments (Fig. 8, Schlosser et al., 2009) exhibit significant dependencies be-tween measurements on the particular experiment or concen-tration levels of H2O, O3or NO. One major conclusion of the
OH comparison was that the chamber air can be considered to be homogeneously mixed for OH. This is also expected for the less reactive HO2. Furthermore, the comparison of
OH concentrations from LIF instruments versus the DOAS technique at SAPHIR demonstrated that the LIF calibra-tion sources for OH are accurate and reproducible (Schlosser et al., 2007, 2009). The same radical sources were also used for calibrations of HO2sensitivities during HOxComp. The
only difference was that CO was added to the calibration gas to convert OH to HO2in the radical sources of FZJ-LIF
and FRCGC-LIF (see instrument description above). Since the comparison of OH measurements (Schlosser et al., 2009) does not exhibit a day-to-day variability as observed for HO2,
the conversion of OH to HO2in the radical sources of
FZJ-LIF and FRCGC-FZJ-LIF would need to be variable, but com-plete conversion is ensured by the large excess of CO. Fur-thermore, during SAPHIR experiments OH measurements by FRCGC-LIF are slightly larger than those by MPI-LIF and FZJ-LIF, whereas HO2values by FRCGC-LIF are
gen-erally smaller. This again supports that there is no shared er-ror between calibration of the sensitivities for OH and HO2
for this instrument.
Unstable detection sensitivities due to technical problems of the LIF instruments are also an unlikely explanation for the observations. Similar to the calibration many parts of the instruments that are required for the HO2detection are
shared with those needed for the OH detection such as the laser used for the excitation of OH. In the FRCGC-LIF in-strument even the whole detection cell is the same for OH and HO2. Again, the good agreement between
measure-ments of OH concentrations (Schlosser et al., 2009) makes it unlikely that instrumental parameters such as laser perfor-mance caused the variability in the agreement of HO2mixing
ratios. The main difference to the OH detection is the addi-tion of excess NO upstream of the laser excitaaddi-tion, in order to convert HO2to OH. Technical details how the addition is
a variability that does not show up in the variability of re-peated calibrations.
Most likely chemical conditions during experiments af-fected either the HO2detection efficiency or caused
interfer-ing signals. As shown in the followinterfer-ing, there are two species which correlate with differences in the HO2 mixing ratios
measured by the LIF instruments: (1) ozone and (2) water vapor.
5.1 Influence of ozone during SAPHIR experiments
The influence of ozone was studied in the experiment on 19 July by varying ozone stepwise from 0 to 150 ppbv at a relatively constant water vapor mixing ratio of 1.0–1.4%. The linear correlation between measurements by the three LIF-instruments is high and MPI-LIF and FZJ-LIF measure-ments are in agreement when the chamber was illuminated, but an increasing difference between the HO2measurements
by MPI-LIF and the other two LIF instruments is observed in the dark chamber at increasing ozone concentrations (Fig. 7). The additional HO2in the MPI-LIF data reaches about 5 pptv
at 150 ppbv ozone relative to FZJ-LIF or FRCGC-LIF dur-ing the dark periods, but there is no indication for such an offset in the MPI-LIF data in the illuminated chamber. This is evident in the correlation plot in Fig. 10. A high correla-tion as well as good absolute agreement and a negligible off-set (1 pptv) is observed in the correlation of MPI-LIF versus FZJ-LIF, when the data from the dark periods are excluded, whereas FZJ-LIF and FRCGC-LIF correlate well both for il-luminated and dark conditions.
Systematic differences between the measurements by MPI-LIF and the other two instruments are also observed in the darkness during other SAPHIR experiments, but absolute deviations are not the same, when ozone mixing ratios on dif-ferent days are within the range of ozone concentrations en-countered on 19 July (e.g. 21 July during two periods, when the chamber roof was closed (09:15 to 10:00 and 12:00 to 15:00)). This indicates that this effect does not only depend on the ozone mixing ratio. There is no offset of HO2mixing
ratios by MPI-LIF during the ozonolysis of alkenes on 22 July that was also carried out in the dark chamber. The rela-tionship between data is similar to the relarela-tionship observed for the other experiments at similar water concentration. The intercept of the linear fit between data by MPI-LIF and the other two LIF instruments is within the range of intercepts calculated for the other experiments (approximately 1 pptv). The difference between the ozonolysis experiment and all the other experiments is that there are no species in the chamber that are photolytically produced including nitrogen oxides.
The potential interference from self-production of OH from ozone photolysis (see instrument description) is typi-cally small and independent of experimental conditions like darkness, so that this cannot explain the observations. A detailed analysis, which factors affect the sensitivity of the MPI-LIF instrument in the dark beside the observed
depen-Fig. 10. Correlation of HO2 mixing ratios on 19 July, when the
ozone mixing ratio was varied. The water mixing ratio was 1.0– 1.4%. Solid line shows the result of the linear fit. Data taken when the chamber roof was closed (crosses in Figure) were excluded from the fit.
dence on ozone, is not possible from measurements of this campaign. As mentioned in Schlosser et al. (2009) OH con-centration measurements by MPI-LIF at periods without day-light were rejected, because of an unexplained variable OH background signal.
5.2 Influence of water vapor during SAPHIR experiments
The largest differences between diurnal profiles measured by the LIF instruments are encountered during the first SAPHIR experiment, when water vapor was stepwise increased to a maximum mixing ratio of 1.8%. Whereas HO2mixing ratios
by FRCGC-LIF are the highest for dry conditions and the lowest for maximum water concentration, HO2mixing ratios
and FRCGC-LIF on 18 July is consistent with results from 17 July (with the exception of the first illumination period), differences between HO2by MPI-LIF and the other two
in-struments are decreasing with increasing NO concentration that was varied in this experiment. The reason for this be-havior is not clear, but is most likely not caused by the addi-tion of NO, because observed differences between MPI-LIF and the other instruments on 18 July are not consistent with difference observed on other days at similar NO concentra-tions (e.g. 19, 23 July for low NO). During the first part of the experiment on 21 July (ambient air in the chamber) mea-surements by FZJ-LIF are slightly lower than meamea-surements by MPI-LIF in contrast to observations on other days with similar water vapor concentrations. This pattern changes af-ter CO (500 ppmv) had been added at 11:00 when FZJ-LIF shows again larger values. No reason could be identified, why CO would change the pattern, since the concentration of CO was small enough not to affect the conversion of HO2
in the detection cells of instruments.
In order to investigate the water effect quantitatively, the data from all SAPHIR experiments (17–23 July) are grouped in four classes of water vapor concentrations (according to the water vapor concentrations encountered during the ex-periment on 17 July, when the water vapor concentration was systematically varied). For each subgroup, a good linear cor-relation is found (Fig. 11). Linear fits are then applied to the data pairs of each water vapor class. A data filter is ap-plied, excluding time periods when the ozone mixing ratio was larger than 30 ppbv in the dark chamber on 18, 19, 21, 23 July. With increasing water vapor concentration slopes of the fits are increasing from 0.35 to 1.26 for measurements by FRCGC-LIF and MPI-LIF, and decreasing from 2.2 to 1.1 and 1.5 to 0.7 for measurements by MPI-LIF and FZJ-LIF, and FZJ-LIF and FRCGC-LIF, respectively.
Apparently, the discrepancies between HO2measurements
are largest (up to a factor 3) at low water vapor mixing ra-tios (0–0.1% and 0.25–0.6%), while absolute agreement is better (within 30%) at high humidities (0.6–1.2% and 1.2– 1.8%). In the latter case, measurements of all three instru-ments agree within their stated 1σ accuracies. Furthermore, the ratio of the sum of squared residual and number of data points decreases, if data are restricted to conditions when the water vapor mixing ratio was higher than 0.6% (SAPHIRsub in Table 4), demonstrating that part of the variability indeed depends on the water vapor concentration.
The strong water vapor dependence of the correlation be-tween the LIF measurements is surprising, because the HO2
concentration measurements were corrected by each group for water vapor dependencies prior to data submission based on characterization measurements. Furthermore, also OH data were corrected for a dependence of instrument sensitiv-ities on water vapor determined from similar investigations, but no distinct dependence in the relationship of their mea-surements is observed (Schlosser et al., 2009).
Fig. 11. Correlation of HO2mixing ratios classified for different
water vapor mixing ratios in SAPHIR. All data are included with the exception of data during periods with ozone mixing ratios greater than 30 ppbv in the dark chamber on 18, 19, 20, 23 July. Separate regression analysis were performed for each level of water concen-tration indicated by the different colors. Solid lines are results from a linear fit.
between 0.4 and 1.2%. No water vapor dependence larger than the expected quenching effect (11%) was observed. Since the reproducibility of calibration measurements was within the same range, correction factors were derived the-oretically from quenching constants rather than from the cal-ibration measurements. In the case of the FRCGC-LIF in-strument, calibrations were done at low water vapor mixing below 0.1%. This was necessary, in order to produce radical concentrations in the lower pptv range in the FRCGC-LIF radical source. Measurements at higher water vapor mix-ing ratios were then corrected for fluorescence quenchmix-ing calculated from quenching constants. The validity of this assumption was tested in laboratory experiments. The sen-sitivity of the MPI-LIF instruments was investigated during the campaign by calibration measurements at different water levels and showed a larger reduction of the sensitivity than expected from fluorescence quenching (i.e. 20% reduction per 1% water vapor concentration). This empirical correc-tion factor was applied to the measurements by MPI-LIF.
The large differences between measurements at low wa-ter vapor concentrations cannot be explained by a lack of characterization of the sensitivity with respect to water vapor for several reasons: (1) the validity of the corrections that are applied for fluorescence quenching was demonstrated by the intercomparison of OH measurements (Schlosser et al., 2009). The same corrections are applied for OH and HO2
measurements. Similar characterization measurements for OH and HO2were used to correct data by MPI-LIF, but no
dependence in the relationship between data on water vapor was observed for OH. (2) The largest corrections are done for measurements by MPI-LIF, but they are significantly smaller than the differences between measurements observed for conditions with low water vapor concentration. (3) Cal-ibrations of the FRCGC LIF instrument were performed at low water vapor mixing ratios (<0.1%), and MPI-LIF and FZJ-LIF were calibrated over a range of water vapor that in-cludes the mixing ratios encountered during the campaign.
Despite these calibration conditions, measurements of all three instruments show significant disagreement at low hu-midities. This result suggests that an additional unknown pa-rameter influences the HO2detection sensitivity at dry
condi-tions in the chamber experiments, but not in the calibracondi-tions. The measurement differences are similar for each pair of in-struments. For this reason and due to the lack of an absolute reference, it is not possible to decide which instruments are affected by the unknown parameter. At high humidity (0.6– 1.8%), however, all instruments agree within the stated accu-racies (Table 1) and exhibit very good linear correlations. It should also be noted that the LIF instruments were mostly de-ployed for such high water vapor mixing ratios in field cam-paigns in the lower troposphere in the past, and that one of the instruments (FZJ-LIF) had shown very good agreement with the absolute measurements by MIESR at similar condi-tions in the field (Platt et al., 2002) and in SAPHIR (Fuchs et al., 2009).
5.3 Comparison of ambient air measurements
During ambient air measurements of the campaign, water va-por concentrations were approximately constant (around 1%) and ozone concentrations were low during the night (between 10 and 30 ppbv). Therefore, the observation of a higher linear correlation between measurements can be expected consid-ering the magnitude of the interferences found in the anal-ysis of the SAPHIR experiments. Whereas a similar slope in the linear fit between data by MPI-LIF and FRCGC-LIF is calculated for ambient air sampling and SAPHIR exper-iments, which were carried out with a comparable water concentration, HO2 mixing ratios by FZJ-LIF-ambient are
significantly smaller compared to the relationship observed for FZJ-LIF-SAPHIR. Good agreement between measure-ments by FZJ-LIF-ambient and FRCGC-LIF is observed, but HO2 mixing ratios by FRCGC-LIF are approximately 30%
smaller than those by FZJ-LIF-SAPHIR.
During the second night, MPI-LIF show significantly higher values than FRCGC-LIF than during day. This com-pares to the interference as observed in the dark chamber. During the first night FRCGC-LIF was not operated. FZJ-LIF was operated in two different configurations: with and without an additional converter for the detection of ROx,
re-spectively. Without the reactor (first night), the relationship between FZJ-LIF and MPI-LIF was similar to daytime, but FZJ-LIF and MPI-LIF agreed better during the second night, when FZJ-LIF was operated with the additional reactor, com-pared to their agreement during the day. The limited number of nighttime data which are available to compare instruments with identical configuration and the diverse relationship ob-served during the two nights do not allow drawing a definite conclusion from ambient nighttime data from this campaign. In principle, the different agreement of the instruments under ambient conditions compared to the SAPHIR exper-iments can have been caused by several reasons. First, the FZJ-LIF data in ambient and SAPHIR air were obtained by two LIF instruments with potentially different system-atic measurement errors. This explanation, however, is un-likely, because the two detection systems are constructed in the same way and both shared the same calibration source. Second, all LIF instruments applied different calibration fac-tors during ambient air sampling and SAPHIR measurements (MPI-LIF: 30% change; FRCGC-LIF: maximum 10% dif-ference, FZJ-LIF: different instruments with different cal-ibration factors). If the difference between measurements was caused by instability of the calibration source or laser, a similar difference between OH (Schlosser et al., 2009) and HO2 would be expected, but is only partly observed.
Al-though MPI-LIF values are larger for ambient air sampling for for both, OH and HO2, differences between HO2
in the SAPHIR chamber on 21 July. The agreement of the LIF instruments during this particular experiment was not significantly different from the other SAPHIR experiments at similar humidity. Lastly, it is possible that the instruments sampled ambient air of different chemical composition. In fact, the intercomparison of OH measurements during HOx-Comp has shown worse agreement and less correlation in ambient air compared to the measurements in the SAPHIR chamber. Observations for OH indicate that the ambient air was inhomogeneously mixed (Schlosser et al., 2009), which may explain at least some of the differences in the measured HO2concentrations. Sources and sinks for trace gases such
as vegetation were close to the instruments. Buildings and vegetation surrounded the measurements site, so that the in-coming air flow was disturbed and potentially not homoge-neous.
6 Summary and conclusions
The HOxCOMP campaign included a formal, blind inter-comparison of HO2measurements. Three instruments
mea-sured HO2 concentrations via chemical conversion to OH,
which was detected by laser-induced fluorescence. Because measurements by a MIESR instrument failed during the cam-paign, no absolute reference measurement was available, so that the accuracy of individual instruments could not be ad-dressed. The measurements included three days of sampling ambient air and six experiments at the atmosphere simulation chamber SAPHIR in J¨ulich, Germany.
HO2 concentrations measured by the three LIF
instru-ments are linearly correlated as demonstrated by the range of linear correlation coefficients between 0.82 and 0.98. Al-though differences between measurements are within the range of the combined accuracies of measurements for the entire data set from SAPHIR experiments, there are larger differences during distinct periods of the experiments. The relationship between measurements by the different LIF in-struments is variable on a time scale of hours and depends on conditions of the experiments. This cannot be explained by the variability of the instrument sensitivities, because (1) the same calibration factors were applied for several experi-ment days and the entire period of ambient air sampling, re-spectively, and (2) the OH sensitivity of instruments was cali-brated with the same radical sources, but differences between OH concentrations (Schlosser et al., 2009) do not change in the same way as observed for HO2.
Two chemical species are identified, whose concentrations correlate with changes in the relationship between data sets during SAPHIR experiments. First, the linear correlation be-tween data can be grouped into periods when the water va-por concentration was similar in the chamber. However, the dependence of the instrument sensitivity (mainly caused by fluorescence quenching) on water vapor is well-known and was characterized for all instruments. The validity of the
cor-rection applied was demonstrated by the intercomparison of OH concentrations measured by the same instruments which does not exhibit a dependence on water vapor (Schlosser et al., 2009). Therefore, results of this intercomparison do not question the effect of water vapor quenching. Further-more, the observed differences between measurements are larger than the correction factors. Thus, an unknown factor that is related to water vapor in the chamber may have influ-enced the HO2instrument sensitivities or may have caused
an unknown interference. The results of the linear regres-sion between data sets are significantly improved, if a subset of the data defined by the following conditions is used: (1) the water vapor mixing ratio was >0.6%, (2) presence of daylight, (3) when there was no daylight the ozone mixing ratio was <30 ppbv or no photolytically produced species were present. These findings recommend a reevaluation of the dependence of water vapor on the sensitivity of LIF in-struments especially for small concentrations and the inves-tigation of potential interferences which may be correlated with water vapor in the SAPHIR chamber. The agreement of measurement is improved for water vapor mixing ratios within the range of concentrations which are typically en-countered in the lower troposphere, where many of the HO2
measurements have been done so far.
Second, in one of the LIF instruments (MPI-LIF) a back-ground signal, which is correlated to the ozone concentration in the chamber, is observed during periods without sunlight. The magnitude of this interference does not only depend on the ozone concentration, but is variable for the different ex-periments. It does not appear during the ozonolysis experi-ment, when no photolytically produced species were in the chamber. It is known that ozone can cause an interference by its photolysis by the exciting laser beam at 308 nm, but this effect would not depend on the presence of sunlight outside the measurement cell and is expected to be smaller than the signal observed here, so that ozone photolysis most likely did not cause the observed interference. Further investiga-tions are required to clarify the reason for the observainvestiga-tions. The unexplained HO2background corresponds to the
obser-vation of an OH background of this instrument at the same time (Schlosser et al., 2009).
Both trace gas species which were identified to correlate with differences between measurements during SAPHIR ex-periments, were less variable for ambient air sampling. The good linear correlation between ambient air measurements does not give hints for additional species that influenced the instrument sensitivities. In contrast to SAPHIR experiments, results for nighttime data differ from daytime showing re-duced HO2 for MPI-LIF for some of the nighttime data.
have been affected by inhomogeneities in air masses sam-pled by the instruments at slightly different locations leading to deviations between measurements. This emphasizes that it is essential for instrument comparisons that all instruments sample the same air. A simulation chamber like SAPHIR provides an environment which ensures that instruments can sample homogeneously mixed air containing the same trace gas concentrations (Schlosser et al., 2007, 2009; Apel et al., 2008; Fuchs et al., 2010).
The results of this study indicate the need to study the in-fluence of atmospheric components such as water vapor or ozone on the instrument sensitivity under field conditions. Further systematic laboratory and chamber studies may be useful to resolve open questions identified here. Future inter-comparison efforts using different instruments could greatly aid to further improve the accuracy and reliability of HO2
measurements.
Acknowledgements. This work was supported by the EU FP-6 pro-gram EUROCHAMP (grant no. RII3-CT-2004-505968) and AC-CENT (Priority 1.1.6.3. Global Change and Ecosystems, grant no. GOCE-CT-2004-505337).
We thank B. Bohn, F. Rohrer, R. Tillmann, and R. Wegener for helpful discussions and supporting measurements, and F. J. Johnen for assistance with the experiments.
Edited by: F. Keutsch
References
Apel, E. C., Brauers, T., Koppmann, R., Bandowe, B., Bossmeyer, J., Holzke, C., Tillmann, R., Wahner, A., Wegener, R., Brun-ner, A., Jocher, M., Ruuskanen, T., Spirig, C., SteigBrun-ner, D., Steinbrecher, R., Gomez Alvarez, E., M¨uller, K., Burrows, J. P., Schade, G., Solomon, S. J., Ladst¨atter-Weissenmayer, A., Sim-monds, P., Young, D., Hopkins, J. R., Lewis, A. C., Legreid, G., Reimann, S., Hansel, A., Wisthaler, A., Blake, R. S., Ellis, A. M., Monks, P. S., and Wyche, K. P.: Intercomparison of oxygenated volatile organic compound measurements at the SAPHIR atmo-sphere simulation chamber, J. Geophys. Res., 113, D20307, doi: 10.1029/2008JD009865, 2008.
Aschmutat, U., Hessling, M., Holland, F., and Hofzumahaus, A., eds.: A tunable source of hydroxyl (OH) and hydroperoxy (HO2)
radicals: In the range between 106 and 109 cm−3, Physico-chemical behaviour of atmospheric pollutants, European Com-mission, Brussels, 1994.
Bohn, B., Rohrer, F., Brauers, T., and Wahner, A.: Actinometric measurements of NO2photolysis frequencies in the atmosphere simulation chamber SAPHIR, Atmos. Chem. Phys., 5, 493–503, doi:10.5194/acp-5-493-2005, 2005.
Finlayson-Pitts, B. J. and Pitts Jr., J. N.: Chemistry of the upper and lower atmosphere, Academic Press, San Diego, 2000.
Fuchs, H., Hofzumahaus, A., and Holland, F.: Measurement of tropospheric RO2and HO2radicals by a laser-induced
fluores-cence instrument, Rev. Sci. Instrum., 79, 084104, doi:10.1063/1. 2968712, 2008.
Fuchs, H., Brauers, T., H¨aseler, R., Holland, F., Mihelcic, D., M¨usgen, P., Rohrer, F., Wegener, R., and Hofzumahaus, A.: In-tercomparison of peroxy radical measurements obtained at at-mospheric conditions by laser-induced fluorescence and elec-tron spin resonance spectroscopy, Atmos. Meas. Tech., 2, 55–64, doi:10.5194/amt-2-55-2009, 2009.
Fuchs, H., Ball, S. M., Bohn, B., Brauers, T., Cohen, R. C., Dorn, H.-P., Dub´e, W. P., Fry, J. L., H¨aseler, R., Heitmann, U., Jones, R. L., Kleffmann, J., Mentel, T. F., M¨usgen, P., Rohrer, F., Rollins, A. W., Ruth, A. A., Kiendler-Scharr, A., Schlosser, E., Shillings, A. J. L., Tillmann, R., Varma, R. M., Venables, D. S., Villena Tapia, G., Wahner, A., Wegener, R., Wooldridge, P. J., and Brown, S. S.: Intercomparison of measurements of NO2
concentrations in the atmosphere simulation chamber SAPHIR during the NO3Comp campaign, Atmos. Meas. Tech., 3, 21–37, doi:10.5194/amt-3-21-2010, 2010.
Geyer, A., B¨achmann, K., Hofzumahaus, A., Holland, F., Konrad, S., Kl¨upfel, T., P¨atz, H. W., Sch¨afer, J., and Platt, U.: Nighttime formation of peroxy and hydroxyl radicals during the BERLIOZ campaign: Observations and modeling studies, J. Geophys. Res., 108, 8249, doi:10.1029/2001JD000656, 2003.
Heard, D. E. and Pilling, M. J.: Measurement of OH and HO2
in the troposphere, Chem. Rev., 103, 5163–5198, doi:10.1021/ cr020522s, 2003.
Hofzumahaus, A., Rohrer, F., Lu, K., Bohn, B., Brauers, T., Chang, C.-C., Fuchs, H., Holland, F., Kita, K., Kondo, Y., Li, X., Lou, S., Shao, M., Zeng, L., Wahner, A., and Zhang, Y.: Amplified trace gas removal in the troposphere, Science, 324, 1702–1704, doi:10.1126/science.1164566, 2009.
Holland, F., Hofzumahaus, A., Sch¨afer, J., Kraus, A., and P¨atz, H. W.: Measurements of OH and HO2 radical concentrations
and photolysis frequencies during BERLIOZ, J. Geophys. Res., 108, 8246, doi:10.1029/2001JD001393, 2003.
Kanaya, Y. and Akimoto, H.: Gating a channel photomultiplier with a fast high-voltage switch: reduction of afterpulse rates in a laser-induced fluorescence instrument for measurement of atmo-spheric OH radical concentrations, Appl. Optics, 45, 1254–1259, 2006.
Kanaya, Y., Sadanaga, Y., Nakamura, K., and Akimoto, H.: De-velopment of a ground-based LIF instrument for measuring HOx
radicals: Instrumentation and calibration, J. Atmos. Chem., 38, 73–110, 2001.
Kanaya, Y., Cao, R., Akimoto, H., Fukuda, M., Komazaki, Y., Yok-ouchi, Y., Koike, M., Tanimoto, H., Takegawa, N., and Kondo, Y.: Urban photochemistry in central Tokyo: 1. observed and modeled OH and HO2 radical concentrations during the
win-ter and summer 2004, J. Geophys. Res., 112, D21312, doi: 10.1029/2007JD008670, 2007.
Lelieveld, J., Butler, T. M., Crowley, J. N., Dillon, T. J., Fischer, H., Ganzeveld, L., Harder, H., Lawrence, M. G., Martinez, M., Taraborrelli, D., and Williams, J.: Atmospheric oxidation ca-pacity sustained by a tropical forest, Nature, 452, 737–740, doi: 10.1038/nature06870, 2008.