Gonçalo Laurentino Gomes
Licenciado em Engenharia Geológica
Spatial simulation of the W-Sn ore grades
of São Pedro das Águias skarn mineral
deposit (Tabuaço, northern Portugal)
Dissertação para obtenção do Grau de Mestre em
Engenharia Geológica
Orientador: Doutor José António de Almeida, Professor
Associado, FCT/UNL
Co-orientador: Mestre Filipa Vieira Matias, Estudante de
Doutoramento, FCT/UNL
Júri:
Presidente: Doutor Martim Afonso Ferreira de Sousa Chichorro Arguente: Doutor António Jorge Gonçalves de Sousa
Gonçalo Laurentino Gomes
Licenciado em Engenharia Geológica
Spatial simulation of the W-Sn ore grades
of São Pedro das Águias skarn mineral
deposit (Tabuaço, northern Portugal)
Dissertação para obtenção do Grau de Mestre em
Engenharia Geológica
Orientador: Doutor José António de Almeida, Professor
Associado, FCT/UNL
Spatial simulation of the W-Sn ore grades of São Pedro das
Águias skarn mineral deposit (Tabuaço, northern Portugal)
Copyright em nome de Gonçalo Laurentino Gomes, da FCT/UNL e da UNL.
A Faculdade de Ciências e Tecnologia e a Universidade Nova de Lisboa têm o direito, perpétuo e
sem limites geográficos, de arquivar e publicar esta dissertação através de exemplares impressos
reproduzidos em papel ou de forma digital, ou por qualquer outro meio conhecido ou que venha a
ser inventado, e de a divulgar através de repositórios científicos e de admitir a sua cópia e
distribuição com objectivos educacionais ou de investigação, não comerciais, desde que seja
“If the results disagree with informed opinion, do not admit a simple logical interpretation, and do
not show up clearly in a graphical presentation, they are probably wrong. There is no magic about
numerical methods, and many ways in which they can break down. They are a valuable aid to the
interpretation of data, not sausage machines automatically transforming bodies of numbers into
packages of scientific fact.”
ACKNOWLEDGMENTS
In this part of the present work I would like to thank to all entities and people who have contributed
directly, or not, to the rise, development and conclusion of this study. Consequently, in my opinion,
this is maybe the most difficult section of this thesis, because I am always thinking about: “I must
not forget of anyone!”. Thus, if this happens (which I hope not), I would like to apologize in
advance to those I have forgotten, and leave written down that all were important to me and to the
conclusion of my master thesis and, as consequence, to ending of this important stage of my life.
Therefore, a big and heartfelt thank you to the following:
To Colt Resources Inc. for gently providing all data, informations and help needed, for all the
reliance and for having authorized the publication of this master thesis and previous scientific
publications about this work. Without the data of this company the present study would not be
possible.
To FCT – Fundação para a Ciência e Tecnologia (Science and Technology Fundation) for funded
this study through the Project UID/GEO/04035/2013.
To the Faculty of Sciences and Technology of NOVA University of Lisbon and to its Earth
Sciences Department for having accepted and hosted me for many years, to study and develop
my hard skills.
To Professor José António for this opportunity and excellent orientation. Thank you also for your
constant motivation, imagination, availability, patience and professionalism, for all the answered
questions, our published works and friendship. All the last points and qualities motivated me to
work more and to believe in the final result. I am really grateful!
To Filipa for the given orientation, advices, our published works, and discussions, suggestions and
revisions of the models and texts. Thank you for having always been the bridge between me and
the professors’ hard acknowledgment, and me and the practical and complex mining and business
reality. I am also thankful for the constant availability and built friendship!
To Professor Martim for all the geological discussions, suggestions and revisions of the model and
texts even without being my supervisor. I am also grateful for your availability, patience, advices,
sympathy, explanations, answered questions, our published works and friendship. Thank you
Professor Martim!
To the remaining professors and staff of the Earth Sciences Department of Faculty of Sciences
and Technology of NOVA University of Lisbon who marked my academic formation, specially to
Professor Ana Paula, Graça, Sofia, Zenaide, Joaquim, Kullberg, Nuno, Paulo and Pedro and to
Fátima. Thank you all for the constant conversations, discussions, sharing, help and motivation
provided and, mostly, demonstrated friendship.
discussion about the studied region and for providing Doctor Manuel Bernardo de Sousa’s Ph.D.
thesis.
To Now Club’s staff and colleagues who improved greatly my English skills, specially to Ivan and
Super Mike. Without you maybe I would never have reached to this ambitious goal, of writing my
thesis completely in English. Thanks a lot!
To my colleagues and friends of the faculty, specially to Catarina, Daniela, Inês, Inês, Laura,
Lúcia, Marta, Rita, André, Brasil, Brissos, Chicão, David, Estevens, Gonçalo, Luís, Mário, Pedro,
Ricardo, Ricardo and Sanches. Thank you all for all conversations and discussions, funny and
relaxed moments, harder and softer projects and, mainly, for the created and special friendships!
To my homeland and unforgotten friends Ana, Daniela, Diana, Cátia, little Matilde, David, Fábio,
Flávio, Hugo, Renato, Rui, Rui and Rui. Thank you for all the unconditional friendship, constant
support and conversations, and for being always with me in the better and the worst moments!
Lastly, the last are always the first, to my family. To my bother Gil, my grandmothers Jesus and
Maria, my grandfathers, Chico and Tóino, who God has, my godson Rui and to my aunts, uncles
and cousins for the constant support, encouragement, love and open heart. Finally, a special and
great thanks to my parents Bina and Tó Manel for all the unconditional love, support and
encouragement, for the constant parents’ pride, patience and comprehension in spite of
everything, and for this big opportunity, my academic formation. I am who I am because of you
ABSTRACT
The purpose of this study is the W-Sn grades simulation of São Pedro das Águias skarn ore
deposit (Tabuaço, northern Portugal). This skarn deposit hosts a mineralization of scheelite and
cassiterite. The grades modelling constrained by lens-shaped skarns is challenging, because they
are numerous, thin, constrained to the structure shape and orientation, and recognized only in the
drill-holes without indication of interconnections. Despite of the complexity, the proposed
methodology constructs a geological model of the lens-shaped skarns, and generates a
conditional model of the grades.
The geological model construction begins with the automatic simulation of scenarios of the
interconnections between the lens-shaped intersected by the drill-holes, conditioned to the
orientation of the structure. For the simulated geometry scenarios represented by polylines in
several cross-sections thicknesses are added according to the drill-cores, and the skarn relative
proportion of each block is evaluated. Finally, the grid blocks between the cross-sections are filled
using direct the DSS algorithm with local means from the skarn proportion variable (continuous
variable). So long as the skarn thicknesses are much smaller than the blocks size, the
morphological model reports the skarn proportion variable. The W-Sn grades model encompasses
the local histograms estimation conditional to the geological model, and uses the PFS algorithm to
generate the final images. The local histograms estimation results of a grades mixture according to
the calculated skarn proportion between each block, and of a simple W-Sn simulated images
conditional to the skarn and no-skarn lithological groups.
The simulated grades are finally compared with the equivalent resources obtained by ordinary
kriging. The simulated images enable the evaluation of the local uncertainty, and may be used for
mine planning and optimizations.
RESUMO
O objectivo deste estudo é a simulação dos teores de W-Sn do depósito de skarn de São Pedro
das Águias (Tabuaço, norte de Portugal). Este depósito de skarn possui mineralizações de
scheelite e cassiterite. A modelação de teores condicionada a lentículas de skarn é um desafio,
porque estas são numerosas, finas, condicionadas à forma e orientação da estrutura e
reconhecidas só nas sondagens, sem indicação de conexões entre as mesmas. Apesar da
complexidade, a metodologia proposta constrói um modelo geológico das lentículas de skarn e
gera um modelo condicional de teores.
A construção do modelo geológico inicia-se com a simulação automática de cenários das
conexões das lentículas reconhecidas nas sondagens, condicionadas à orientação da estrutura.
Para os cenários simulados da geometria, representados por polylines em vários perfis, é
adicionada uma espessura de acordo com as sondagens e é avaliada a proporção relativa de
skarn dentro de cada bloco da malha. Finalmente, os blocos entre perfis são preenchidos por
SSD com médias locais a partir da variável proporção de skarn (variável contínua). Visto que a
espessura das lentículas de skarn é mais reduzida que a dimensão dos blocos, o modelo
morfológico reporta a variável proporção de skarn. O modelo de teores de W-Sn envolve a
estimação de histogramas locais condicionais ao modelo geológico e utiliza a PFS para gerar as
imagens finais. A estimação dos histogramas locais resulta de uma mistura de teores de acordo
com a proporção de skarn calculada entre cada bloco e origina simples imagens simuladas de
W-Sn condicionais para os tipos de rocha skarn e no-skarn.
Os teores simulados são finalmente comparados com os recursos equivalentes obtidos por krigagem normal. As imagens simuladas permitem a avaliação da incerteza local e podem ser utilizadas para o planeamento e optimização mineira.
CONTENTS
1. Introduction ... 1
1.1.
Setting and goals of the thesis ... 1
1.2.
Organization of the thesis ... 5
1.3.
Geographical and geomorphological setting ... 6
1.4.
Historical setting of the São Pedro das Águias ore deposit ... 8
2.
Geological setting of skarn deposits ... 11
2.1.
Skarn deposits ... 11
2.1.1.
Genesis and formation ... 11
2.1.2.
Classifications ... 13
2.1.3.
Skarn deposits all over the world ... 15
2.1.4.
Skarn deposits in Portugal ... 17
3.
Materials ... 19
3.1.
Geological setting of the São Pedro das Águias skarn deposit ... 19
3.1.1.
Variscan Orogeny ... 19
3.1.2.
Iberian Massif ... 23
3.1.3.
Central Iberian Zone ... 25
3.1.4.
Regional geology ... 30
3.1.5.
Local geology ... 36
3.2.
Available database ... 40
3.3.
Multivariate analysis of correlations between elements fingerprints, lithologies and
hydrothermal alteration types ... 43
3.3.1.
Multivariate analysis by PCA ... 43
3.3.2.
Preliminary data analysis ... 44
3.3.3.
Results ... 46
3.3.4.
Discussion ... 49
4.
Methodology and theoretical background ... 51
4.1.
State-of-the-art ... 51
4.2.
Theoretical background ... 54
4.2.1.
Spatial continuity ... 54
4.2.2.
Kriging tools ... 56
4.2.3.
DSS and CoDSS algorithms ... 58
4.2.4.
PFS algorithm ... 60
4.2.5.
Object-based model algorithm ... 61
4.2.6.
Uncertainty evaluation ... 63
4.3.
Methodology ... 64
4.3.1.
Low-resolution geological model ... 65
4.3.2.
High-resolution morphological model ... 66
4.3.3.
W and Sn grades model ... 66
5.
Case study ... 69
5.1.
Data processing ... 69
5.2.
Univariate and bivariate statistical analysis ... 69
5.3.
Spatial continuity evaluation ... 72
5.4.
Morphological model ... 74
5.5.
W and Sn grades model ... 79
6.
Final remarks ... 92
FIGURES
Figure 1.1 – World’s sketch showing the distribution of W- and bets; cross-hatched and black areas –
Sn-belts; dotted areas – W-belts. ... 3
Figure 1.2 – EU critical and non-critical raw materials combined with their supply risk and economic importance, and respective thresholds; green square – W raw material; blue square – Sn raw material. . 4
Figure 1.3 – Portugal’s map showing the location of the Tabuaço Experimental Mining License in Portugal.7 Figure 1.4 – Eastern view of the São Pedro das Águias skarn deposit area; the dashed trapezium represents the approximated location where the skarns are cropping out. ... 8
Figure 2.1 – Formation stages of skarns in function of temperature and time (adapted from Pirajno, 2009). 12 Figure 2.2 – Schematic formation stages of skarns: (a) isochemical prograde thermal metamorphism; (b) metasomatism; (c) retrograde hydrothermal alteration. ... 12
Figure 2.3 – Skarn deposits types according with the prevailing economic metals. ... 15
Figure 2.4 – Map showing the distribution of the large W and Sn skarn deposits and of the crustal elements; closed squares – W skarn deposits; crosses – Sn skarn deposits; dashed lines areas – Phanerozoic fold belts; dense dotted areas – Precambrian shields; lightly dotted areas – ancient platforms. ... 16
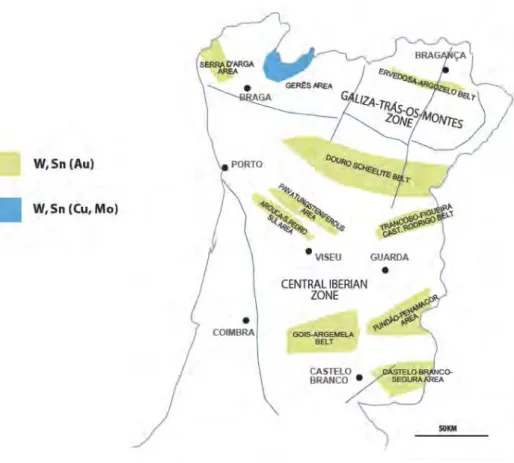
Figure 2.5 – Map showing the W and Sn potential areas in Portugal with mineralizations. ... 17
Figure 3.1 – Sketch showing the Iberia position in relation to the Appalachian, Caledonian and Variscan belts at the end of Variscan convergence; LBM – London-Brabant Massif. ... 20
Figure 3.2 – Sketch showing the Variscan Belt in Europe; B – Buçaco; BCSZ – Badajoz-Córdova Shear Zone; BF – Black Forest; C – Crozon; LC – Lizard Complex; LLF – Layale-Lubine Fault; LPSZ – Los Pedroches Shear Zone; MGCZ – Mid German Crystalline Zone; MM – Maures Massif; MT – Moldanubian Thrust; NASZ – North Armorican Shear Zone; NEF – Nort-sur-Erdre Fault; NPF – North Pyrenean Fault; PTSZ – Porto-Tomar Shear Zone; RHZ – Rheno-Hercynian Zone; S – Sardinia; SASZ – South Armorican Shear Zone (-N and -S – Northern and Southern branches, respectivelly); SISZ – Southern Iberian Shear Zone; VF – Variscan Front; VM – Vosges Massif. ... 21
Figure 3.3 – Sketch showing the axial traces of the Variscan folds and the main discrete strike-slip shear zones demonstrating the curvature of the Central Iberian Arc; BCSZ – Badajoz-Córdova Shear Zone; DBSZ – Douro-Beira Shear Zone; JPSZ – Juzbado-Penalva Shear Zone; LPSZ – Los Pedroches Shear Zone; PTSZ – Porto-Tomar Shear Zone; SISZ – Southern Iberian Shear Zone. ... 22
Figure 3.4 – Sketch showing the Lotze’s subdivision of the Iberian Massif. ... 24
Figure 3.5 – Sketch showing the division of the Iberian Massif. ... 24
Figure 3.6 – Sketch showing the boundaries proposed by Lotze (1945) and Villaseca et al. (2014) for the lithostratigraphic domains of Central Iberian Zone (Dúrico-Beirão Supergroup and Olho-de-Sapo Domains); 1 – Schist-Greywacke Complex; 2 – Talavera area; 3 – Guadamarra area; 4 – Anatectic Complex of Toledo; a – Las Hurdes-Serra de Gata; b – Sabugal; c – Penacova area; d – Albergaria region; e – Tormes Dome; f – Carraceda de Ansiaes area. ... 26
Figure 3.7 – Sketch showing the structural domains of Central Iberian Zone (Recumbent and Vertical Folds Domiains). ... 29
Figure 3.8 – Sketch showing the main mineralization systems spatial distribution of northern Portugal, and their relationship with the Variscan granitoids and Variscan shear zones. ... 30
Figure 3.9 – Stratigraphic column of the Douro Group. ... 32
Figure 3.10 – Geological map of the Armamar-Penedono region; the dashed trapezium represents the approximated location of the São Pedro das Águias skarn deposit. ... 33
Figure 3.11 – Geological map of the São Pedro das Águias area; the dashed trapezium represents the approximated location where the skarns are cropping out. ... 37
Figure 3.12 – Schematic cross-section showing a simplified paragenesis of the São Pedro das Águias skarn ore deposit. ... 39
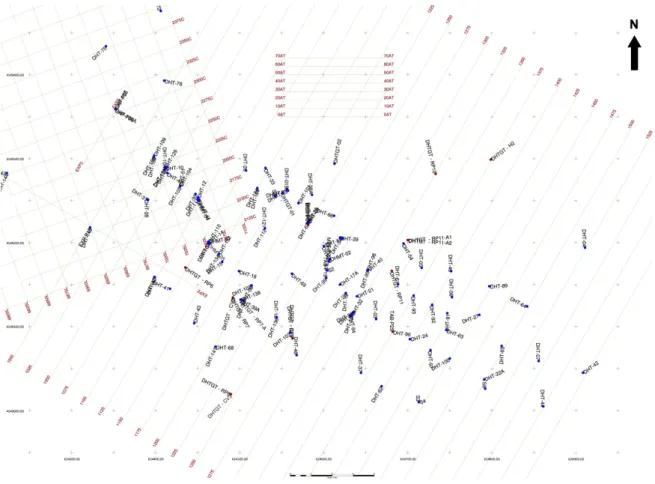
Figure 3.13 – Sketch showing the drill-holes distribution through the study area. ... 41
Figure 3.14 – Southeastern view of the study volume and drill-holes with a clockwise rotation of 30° constrained by the DTM. ... 42
Figure 3.15 – Example of a geologists’ hand drawn cross-section to demonstrate the drill-holes fan-shaped and their dip. ... 43
Figure 3.16 – Scatter plot of the F2/F1 overlapped with the chemical elements correlation. ... 47
Figure 3.17 – Scatter plot of the F2/F1 overlapped with the lithologies, or lithological groups. ... 48
Figure 3.18 – Scatter plot of the F2/F1 overlapped with the hydrothermal alteration types. ... 49
Figure 4.2 – Schematic cross-section view plan of the object-based model algorithm steps: (a) identification of the skarn lithologies in the drill-holes; (b) generation of the lens-shaped skarns in form of polylines; (c) addition of hypothetical lens-shaped skarns regarding the local and global target intensities; and (d)
addition of local thicknesses. ... 62
Figure 4.3 – Example of a geologists’ hand drawn cross-section divided in two regions, and insterpreted dip angles of the structure. ... 63
Figure 4.4 – Fluxogram representing the methodology applied on the study. ... 65
Figure 4.5 – Scheme exemplifying the split of a drill-hole in skarn and no-skarn lithologies, independently of the existent grades. ... 68
Figure 5.1 – Conditional cumulative histograms of W (1) and Sn (b) grades by proportion of length of the sampled drill-hole. ... 70
Figure 5.2 – Scatter plot of W and Sn grades. ... 72
Figure 5.3 – Skarn lithologies proportion and grades variograms, and theoretical models adjusted: (a) skarn proportion (Azimuth: 0°; Dip: 20°) direction; (b) skarn proportion (Azimuth: 0°; Dip: -70°) direction; (c) skarn proportion (Azimuth: 90°; Dip: 0°) direction (d) W grades (Azimuth: 0°; Dip: 20°) direction; (e) W grades (Azimuth: 0°; Dip: -70°) direction; (f) W grades (Azimuth: 90°; Dip: 0°) direction; (g) Sn grades (Azimuth: 0°; Dip: 20°) direction; (h) Sn grades (Azimuth: 0°; Dip: -70°) direction; and (i) Sn grades (Azimuth: 90°; Dip: 0°) direction. ... 73
Figure 5.4 – Dip angles distribution laws for each cross-section: (a) region 1; and (b) region 2. ... 75
Figure 5.5 – Western under DTM view of the cross-sections with a realization of the lens-shaped skarns object-based model: (a) with drill-holes; and (b) without drill-holes. ... 76
Figure 5.6 – Western under DTM view of the low-resolution geological model mean results of FSK. ... 77
Figure 5.7 – Results of the sixth cross-section of both low-resolution geological model and high-resolution morphological model: (a) low-resolution geological model first realization of the lens-shaped skarns; (b) resolution geological model of the fiftieth realization of the lens-shaped skarns; (c) low-resolution geological model mean results of FSK; (d) high-resolution morphological model mean results of FSK down-scalling; (e) high-resolution morphological model of the fiftieth realization of the FSK down-scalling; and (f) high-resolution morphological model of the fiftieth realization of the FSK down-scalling. ... 78
Figure 5.8 – Results of the sixth cross-section of the W and Sn grades model for skarn lithologies: (a) first realization of W; (b) fiftieth realization of W; (c) first realization of Sn; (d) fiftieth realization of Sn. . 80
Figure 5.9 – Results of the sixth cross-section for the W and Sn grades model for no-skarn lithologies: (a) first realization of W; (b) fiftieth realization of W; (c) first realization of Sn; (d) fiftieth realization of Sn. ... 81
Figure 5.10 – Western under DTM view of the final images of W grades model: (a) first realization; (b) fiftieth realization. ... 82
Figure 5.11 – Western under DTM view of the final images of Sn grades model: (a) first realization; (b) fiftieth realization. ... 83
Figure 5.12 – Results of the sixth cross-section of the final images of W and Sn grades model: (a) first realization of W; (b) fiftieth realization of W; (c) first realization of Sn; (d) fiftieth realization of Sn. . 84
Figure 5.13 – Results of the sixth cross-section of the mean and uncertainty final images of W and Sn grades model: (a) mean of W; (b) uncertainty of W; (c) mean of Sn; (d) variance of Sn. ... 85
Figure 5.14 – Eastern view of the mean results of W grades model with blocks of 10% certainty. ... 86
Figure 5.15 – Curves of WO3 ore (a) and metal (b) resources. ... 88
Figure 5.16 – Curves of grades resources: (a) WO3 grades; and (b) Sn grades. ... 89
TABLES
Table 1.1 – EU critical and non-critical raw materials combined with the EU supply. ... 5
Table 3.1 – Sampled lithologies and associated representativity. ... 45
Table 3.2 – Sampled hydrothermal alteration types and associated representativity. ... 45
Table 3.3 – First five factors and respective eigenvalues and variances. ... 46
Table 5.1 – Conditional univariate statistics of W and Sn grades by skarn and no-skarn sets of lithologies. . 71
Table 5.2 – Results of the one factor ANOVA test for for both W and Sn grades within skarn and no-skarn lithologies. ... 71
Table 5.3 – Skarn lithologies proportion and W and Sn grades parameters of variograms theoretical models. ... 72
LIST OF ABBREVIATIONS, ACRONYMS AND INITIALS
General
3D – Three-dimensional
AD – Anno Domini
Ag – Silver
Al – Aluminum
Au – Gold
As – Arsenic
Ba – Barium
Be – Beryllium
Bi – Bismuth
BC – Before Christ
Ca – Calcium
Cd – Cadmium
Ce – Cerium
Co – Cobalt
CO2 – Carbon dioxide
Colt – Colt Resources Inc.
Cr – Chromium
Cu – Copper
ex. gr. – Exempli gratia (for exemple or for instance)
et al. – Et alii (and other authors)
etc. – Et cetera (and others or and other things)
EU – European Union
Fe – Iron
Ga – Gallium
Ge – Germanium
ha – Hectare
HREE – Heavy Rare Earth Elements
i.e. – Id est (that is or in other words)
K – Potash
kbar – Kilobar
km – Kilometers
La – Lanthanum
Li – Lithium
LREE – Light Rare Earth Elements
m – Meters
Ma – Million years
mm – Millimeters
Mg – Magnesium
Mn – Manganese
Mo – Molybdenum
Mt – Million tonnes
Na – Sodium
Nb – Niobium
Ni – Nickel
O – Oxygen
P – Phosphorus
Pb – Lead
PGM – Platinum Group Metals
Rb – Rubidium
S – Sulfur
Sb – Antimony
Sc – Scandium
Se – Selenium
SEREM – Société d’Études de Recherches et d’Exploitations Minières (Research and Mining
SFM – Serviço de Fomento Mineiro (Mining Development Service)
Si – Silicon
Sn – Tin
SPE – Sociedade Portuguesa de Empreendimentos (Ventures Portuguese Society)
Sr – Strontium
t – Tonnes
Ta – Tantalum
Te – Tellurium
Th – Thorium
Ti – Titanium
Tl – Tallium
U – Uranium
UV – Ultra Violet
V – Vanadium
W – Tungsten or wolfram
WO3 – Tungsten trioxide
wt% – Weight percentage
Y – Iridium
Zn – Zinc
Zr – Zirconium
Geological related
APL – Aplites
BLS – Black/dark grey schists
BLX – Biotite schists
CAV – Solution cavities
CLS – Core losses
CRB – Carbonates or calcschists
CRV – Calcite veins
D1 – First Variscan deformation phase
D2 – Second Variscan deformation phase
D3 – Third Variscan deformation phase
FBX – Faults breccia
FLG – Faults filled with gauge
FLP – Probable faults
FLT – Obvious faults
GNT – Granites
OVB – Overburden
QZV – Quartz veins
SKL – Skarns layered
SKM – Skarns layered to massive
SKN – Skarns indifferentiated
Geostatistical related
BLUE – Best Linear Unbiased Estimator
CCDF – Conditional Cumulative Distribution Function
CDF – Cumulative Distribution Function
CoDSS – Direct Sequential Co-Simulation
CoSGS – Sequential Gaussian Co-Simulation
DEM – Digital Elevation Model
DSS – Direct Sequential Simulation
DTM – Digital Terrain Model
F – Factor
FSK – Skarn relative proportion
FNSK – No-skarn relative proportion
IK – Indicator Kriging
KED – Kriging with External Drift
OCoK – Ordinary Co-Kriging
PC – Principal Component
PCA – Principal Component Analysis
PFS – Probability Field Simulation or P-Field Simulation
SCoK – Simple Co-Kriging
SICoS – Sequential Indicator Co-Simulation
SGS – Sequential Gaussian Simulation
SIS – Sequential Indicator Simulation
1. Introduction
1. Introduction
The present section has the aim of reporting the setting, goals and organization of this work. The
geographical, geomorphological and historical setting of the case study area or region, i.e., the
São Pedro das Águias skarn ore deposit, are also presented.
1.1. Setting and goals of the thesis
The main goal of this thesis is to propose and check a methodology that generates a W and Sn
grades simulated model conditional to a morphological model, with inclusion of geological
information into the construction of the later. The methodology was tested in the São Pedro das
Águias skarn ore deposit (Tabuaço, northern Portugal), which hosts a mineralization of scheelite
(CaWO4) and cassiterite (SnO2). The present deposit is part of the Tabuaço Tungsten Project,
which contains an on-going Experimental Mining License. Colt owns 100% of the rights on the
concession covering the Tabuaço Tungsten Project and, consequently, the Tabuaço Experimental
Mining License was granted to the company (O’Donovan el al., 2012, Beare and MacDougall,
2013).
W, also known as tungsten or wolfram, is a transition metal with atomic number 74 and of both 6th
group and period. The former came from the Swedish term tung sten, which means heavy stone,
respectively, owing to its high density. The the latter derived from the German words wolf rahm
that mean wolf lather, respectively. This meaning becomes from the Middle Ages because it was
harder to obtain Sn from the ores when they also contained W, forming some lather that seemed
“to eat” the Sn. This chemical element is normally in the solid phase and owns a high density of
about 19.3 g/cm3 and the highest melting point of 3410°C (Moura and Velho, 2012).
In the Earth’s crust, W is widespread with an average grade of 1 ppm (Dill, 2010) and can be
found in forty-five minerals (Moura and Velho, 2012). However, economically, W may just be
recovered from wolframite (76 wt% W) and scheelite (80 wt% W) (Dill, 2010; Mora and Velho,
2012). These two are mined from 0.2 to 0.4% WO3 of ore grade. The presence of Au, Ag, Sc, Nb
and Ta increase the value of the W ore; while if Sn > 1.5%, As > 0.2%, P > 0.03%, S > 0.3% and
the existence of Sb, Cu, and Mo may be detrimental to the quality of the ore (Dill, 2010). The
applications of W pass by W carbide to harden alloys, ferrotungsten, stainless steel/high-grade
steel, W filaments for lamps, thermionic uses, and heavy-duty tools (such as drill-bits, by the
recycling of steel alloyed with W and powder-metallurgical material, as W carbide) (Dill, 2010;
Moura and Velho, 2012).
Sn is a post-transition metal with atomic number 50 of the group 14 and the period 5. It is known
as tin, which came from the Latin word stannum. Sn is also normally in the solid phase and has a
density of about 7.3 g/cm3 and a low melting point of 232°C (Moura and Velho, 2012). In the
1. Introduction
ninety-four mienerals (Moura and Velho, 2012). However, economically, it can just be recoverd
from cassiterite (78.8 wt% Sn) (Dill, 2010; Moura and Velhor, 2012). Sn primarily was used for
food containers, in form of Sn- and tern-plates; however, the uses of Sn on nowadays are in form
of alloys (for instance, bronze, brass and babbitt metal, with Sb and Cu in the glass and ceramic
industries), solders, tinning steel sheets, for electronic devices (for example LCD displays), and
pigments (Dill, 2010; Moura and Velho, 2012).
According to Kwak (1987), both W and Sn deposits occur in belts all over the world, which are
mainly distributed by the western part of North America (Appalachian Sn-W Belt), northern South
America (Eastern Brazilian and Ondonro-Guinean Brazilian Belts), Europe (Armorican Belt), Africa
(Nigerian and Liberian-Moroccan Belts), eastern Asia and eastern Australia (Figure 1.1). These
belts can also be grouped into a global-scale by plate tectonic reconstructions, for example the
Appalachian Sn-W Belt match with the Armorican Belt, and the Eastern Brazilian and
Ondonro-Guinean Brazilian Belts with the Nigerian and Liberian-Moroccan Belts (Kwak, 1987). The deposits
of W and Sn of the Iberian Peninsula are inserted in a W and Sn metallogenic province. In
Portugal, in turn, this metallogenic province is situated in the Galiza–Trás-os-Montes Zone and
Central Iberian Zone (Martins, 2012) to the east of the Porto-Tomar Shear Zone and to the
northeast of the Juromenha Thrust Fault (Neiva, 1944, in Ribeiro and Pereira, 1982; Thadeu,
1977), with exception of the polymetallic sulphide deposits situated in the Pyrite Belt of the South
Portuguese Zone (Ribeiro and Pereira, 1982; Martins, 2012). The major part of these deposits are
directly or indirectly associated with granite intrusions and inside of their contact metamorphic
aureoles (Martins, 2012).
Scheelite and the cassiterite are the two most important minerals for the present case study.
Scheelite (CaWO4) is a calcic tungstate mineral, in which contains 13.92% of Ca, 63.85% of W,
and 22.23% of O. According to Dana’s classification (Klein and Dutrow, 2008) this mineral is an
anhydrous molybdate and tungstate, in which Mo may substitute W forming partial series between
scheelite and powellite (CaMoO4). Scheelite has a Mohs hardness between 4.5-5, a specific
gravity of 5.9-6.1, and presents fluorescence, being an useful characteristic for prospection when
UV light is used. About cassiterite, it is a Sn (SnO2) oxide mineral, according to Dana’s
classification (Klein and Dutrow, 2008), including 78.6% of Sn and 21.4% of O. Sn can be
substituted by Nb and Ta in the mineral, and it may contain small amounts of Fe3+. This mineral
has a Mohs hardness of about 6-7, and a specific gravity of 6.8-7.1.
According to the EU (DG-ENTR, 2010, 2014), the variety and stock of materials used in the
existent products has growth during the recent years. Thus, the EU defined a list of fifty-four
non-energy and non-agricultural raw materials that it considers fundamental to Europe’s economy,
growth and jobs, and essential for maintaining and improving people’s quality of life (DG-ENTR,
2014). In this list there were defined critical and non-critical raw materials by having a higher or
lower economic importance and the risk associated with their supply (DG-ENTR, 2010, 2014).
1. Introduction
and of 5.0 to the latter was defined, in which the raw materials that are below these thresholds are
non-critical and those that are above are critical (Figure 1.2 and Table 1.1). Hence, one important
point that indicates if one raw material is critical or not, is the technological change and the rapid
diffusion of new technologies (DG-ENTR, 2010).
Figure 1.1 – World’s sketch showing the distribution of W- and bets; cross-hatched and black areas –
Sn-belts; dotted areas – W-belts (Kwak, 1987).
Both W and Sn metals are raw materials included into the EU’s list (Figure 1.2 and Table 1.1). W
is clearly considered a critical raw material with less than 3% supply in the EU (Figure 1.2 and
Table 1.1; DG-ENTR, 2010, 2014), being the main resulting product of São Pedro das Águias
possible exploitation. According to DG-ENTR (2010), the reasons for the criticality of W are: (1) the
supply is dominated by China (that has the largest reserves in the world), which may cause a price
and quantitative disruption; (2) growing risks a “predatory” behaviour of that country on the W
scrap market; (3) limited substitute alternatives by the cost of the materials/technologies, lesser
performance, and less friendly environmental options; and (4) if EU value chain is broken there is
a loss of know-how in the world, because the EU is the leader in the development of a lot of W
products for many industries (such as automotive), resulting in a total dependence from abroad. In
the other hand, Sn is not considered a critical raw material (Figure 1.2 and Table 1.1), however its
supply in the EU is less than 1% (Table 1.1) and it is placed close to the supply risk threshold
1. Introduction
possible exploitation. Sn may even turn critical, because of its proximity to the supply risk
threshold.
The data base used to support this methodology contains informations about the São Pedro das
Águias skarn ore deposit drilling campaign, and was gently provided by Colt. It includes
informations about the drill-hole cores collected, such as their spatial position, lithologies, and
element grades.
A set of computer software was used to process all the information and to develop the present
work. The utilized software was: (1) an automatic algorithm proposed by Simões (2014) adapted to
the case study; (2) GeoMS; (3) ANDAD; and (4) MoveTM.
Figure 1.2 – EU critical and non-critical raw materials combined with their supply risk and economic
importance, and respective thresholds; green square – W raw material; blue square – Sn raw material
1. Introduction
Table 1.1 – EU critical and non-critical raw materials combined with the EU supply (adapted from DG-ENTR,
2014).
Critical raw materials
Gallium Silicon metal Chromium Antimony
Magnesite Coking coal Tungsten Beryllium
Fluorspar Borate
Germanium Cobalt
Indium Magnesium
Natural graphite Niobium PGM Phosphate rock HREE LREE EU
supply > 20% < 20% < 10% < 3% < 1%
Non-critical raw materials
Clays (and kaolin) Gold
Diatomite Manganese
Feldspar Molybdenum
Hafnium Bentonite Natural rubber
Limestione Gypsum Aluminium Barytes Scandium
Perlite Potash Copper Bauxite Tantalum
Sawn softwood Pulpwood Rhenium Iron Tin
Silica sand Selenium Silver Lithium Titanium
Tellurium Talc Zinc Nickel Vanadium
1.2. Organization of the thesis
This thesis is organized into seven main sections. The first section (1. Introduction) reports the setting, goals, and organization of this thesis. This section also introduces the geographical,
geomorphological and historical setting of the São Pedro das Águias skarn ore deposit. The
second section 2. Geological setting of skarn deposits has the aim of presenting the geological aspects about the skarn deposits in general. Therefore, it covers their genesis and processes,
classifications, and examples both in Portugal and all over the world. The geological issues about
the São Pedro das Águias skarn deposit in particular are presented in 3. Materials. In this section are discussed all the issues which are involved in the São Pedro das Águias skarn deposit
formation, from the Variscan Orogeny, passing by the Iberian Massif, the Central Iberian Zone, the
regional geology, to the local geology, the available database, and a multivariate analysis of
correlations between elements fingerprints, lithologies and hydrothermal alteration types.
state-of-1. Introduction
the-art, followed by an explanation of the applied methodology, and ending with a review of the
used theoretical background. The case study itself is handled in 5. Case study. This section covers the data description and processing, and the obtained results, from the univariate and
bivariate analysis, passing by the results from each step of the methodology, to the summary of
the resources present in the deposit. At last, the conclusions of all the present work and the further
studies or works are reported in 6. Final remarks. The bibliography and references used during this study are covered in the last section (7. References).
1.3. Geographical and geomorphological setting
The Tabuaço Experimental Mining License is located in the north-central part of Portugal, in a
Porto wine growing area, namely in the Armamar-Penedono region. It is situated approximately
300 km to north-northeast of Lisbon (capital of Portugal), and 100 km to the east-southeast of
Oporto (the second largest city of Portugal; O’Donovan et al., 2012; Beare and MacDougall, 2013;
Figure 1.3). The São Pedro das Águias skarn ore deposit is located in the municipality of Tabuaço
(district of Viseu), more precisely in the civil parish of Távora. It is cropping out in the western bank
of the Távora River, in the São Pedro das Águias farmland area (Figure 1.4). The Távora River is
a tributary of the Douro River (the northern main river of Portugal). The São Pedro das Águias
farmland is situated approximately 2 km to the southeast of the village of Távora, and 5 km to the
same direction of the town of Tabuaço.
According to the geomorphological setting, the terrain around São Pedro das Águias ore deposit is
conditioned by two existent lithologies: (1) granites; and (2) metasediments. The study area is hilly
and varies from: (1) steep peaks with v-shaped valleys in the central, northeastern and eastern
parts; to (2) undulating rolling hills in the southwestern areas. The schists and greywackes
(metasediments) are predominant in the former zone. On the other hand, in the latter zone one
can verify the existence of granites (Sousa, 1982; Ferreira and Sousa, 1994; O’Donovan et al.,
2012; Beare and MacDougall, 2013). The elevation of this area ranges from 225 m to 500 m
above the sea level.
The drainage system of this area is constrained by the main faulting system, with direction of
northwest–south-southeast. However, the fractures with directions of south and
north-northeast–south-southwest also condition the rivers of this drainage system (Sousa et al., 1979;
Sousa, 1982; Ferreira and Sousa, 1994). The direction of the Távora River confirms this evidence.
When the Távora River crosses granite terrains it goes in a straight direction according to the main
fractures. When it crosses metasediment terrains it goes in a more irregular direction, but it is still
conditioned by the fractures. There are occurrences of breccia-quartz veins filling some fractures.
These veins are in relief owing to the differential erosion (Sousa et al., 1979; Sousa, 1982; Ferreira
and Sousa, 1994), such as São Pedro das Águias-Granjinha-Monte Verde Vein, which has
1. Introduction
metasediments.
Figure 1.3 – Portugal’s map showing the location of the Tabuaço Experimental Mining License in Portugal
1. Introduction
Figure 1.4 – Eastern view of the São Pedro das Águias skarn deposit area; the dashed trapezium represents
the approximated location where the skarns are cropping out (O’Donovan, 2012; Beare and MacDougall,
2013).
1.4. Historical setting of the São Pedro das Águias ore deposit
Comparing with other mined occurrences in Portugal, the studied deposit is considered a recent
one, discovered approximately 40 years ago. In the Tabuaço area there is no record or evidence
of prior scheelite mining (Sousa et al., 1979; Moura and Velho, 2012; O’Donovan et al., 2012;
Beare and MacDougall, 2013). This fact may be verified taking a few examples, for instance the
Penedono gold deposit, and the Panasqueira tungsten deposit that were both discovered much
earlier (Murton, 2007; Moura and Velho, 2012). The mining of the Penedono gold deposit was
started by Romans, from 200/300 BC to 300/400 AD. After and much later from 1930’s to 1950’s,
1. Introduction
deposit, its first exploration license was granted in 1886. The mine was founded in 1896 and only
stopped the mining operations in two small periods, after the II World War and in the 1990’s.
According to Sousa et al. (1979, in O’Donovan et al., 2012, and Beare and MacDougall, 2013),
there were some small artisan Sn mines in the opposite flank of the Távora River. However, the
scheelite skarns along Távora’s margins were only discovered in the 1970’s by SFM, during
geological fieldwork and mineral-light exploration (with short-wave UV lamp). Therefore, during the
period from 1979 to 1984, the Armamar-Meda Licence (that includes the Tabuaço area) was
included in the Alto Douro exploration concession (Sn-W, Au, etc.), and a joint venture between
the Portuguese SPE and the French SEREM (SPE-SEREM) was formed in order to keep the
exploration in the Tabuaço area (Moura and Velho, 2012; O’Donovan et al., 2012; Beare and
MacDougall, 2013).
Hence, from 1980 to 1981, the SPE-SEREM started the joint venture initial phase of prospection
works in Tabuaço. These prospection works were focused on regional mapping, UV lamp
exploration, grab sampling, channel rock sampling, and stream sediment and soil sampling
programmes (O’Donovan et al., 2012; Beare and MacDougall, 2013). The majority of the
prospection works were in the São Pedro das Águias ore deposit. All vegetation there was
removed to enable an extensive sampling of the northern and southern skarn outcrops. The
northern outcrops samples gave a mean grades between 0.55 and 0.67% W and 0.086% Sn, and
the southern samples gave grades within 0.10 and 0.55% W and 0.05% Sn.
The SPE-SEREM joint venture carried out an initial drilling prospection with six drill-holes, during
the period of 1981-1982, to define the geometry, structure, and grades of the scheelite mineralized
skarns in the Tabuaço area (Moura and Velho, 2012; O’Donovan et al., 2012; Beare and
MacDougall, 2013). Three of the drill-holes intersected the best mineralized horizons. The two
easternmost drill-holes intersected an upper carbonate and a lower mineralized skarn horizon, with
sub-horizontal dip, reporting grades from 0.48 to 0.93% WO3. And the northernmost one crossed
approximately 19 m of mineralization with 1.18% WO3. Attending this drill-hole, it was thought that
this part of the deposit represented its central area. However no further drilling exploration was
done to verify this supposition. As a result of the upper exploration programme in the Tabuaço
area, the SPE-SEREM joint venture has estimated a geological resource of approximately 1 Mt of
scheelite mineralized skans in stratiform horizons, with an average grade of 0.87% WO3.
Later, between 2007 and 2012, Colt acquired the Armamar-Meda exploration concession, and
started a new exploration campaign. The company began with an extensive outcrop sampling
work and a drilling prospection program, in which were involved more than 100 drill-holes with over
11.400 m until now (O’Donovan et al., 2012; Beare and MacDougall, 2013). Although the surface
rights are subordinated to the mining rights, in 2011 the company acquired 140 ha of surface rights
(including vineyards, a winery, and a former Cistercian monastery) to prevent delays imposed by
the landowners during the exploration and remaining activities. Finally, the Tabuaço Experimental
1. Introduction
2. Geological setting of skarn deposits
2. Geological setting of skarn deposits
This section presents the geological issues about skarn deposits in general. It has the aim of
discussing the general aspects of the skarn deposits genesis and processes, classifications, and
examples both in Portugal and all over the world.
2.1. Skarn deposits
The word “skarn” was originally employed by old Swedish miners to refer to the very tough rocks
comprised by coarse-grained calc-silicate gangue associated with the Precambrian magnetite and
chalcopyrite deposits in Sweden (ex. gr., Burt, 1977; Robb, 2005). However, there is evidence of
mining skarn deposits since at least 4000 years ago by the ancient Chinese, Greek, and Roman
empires (ex. gr., Nicolescu and Mârza, 1989, in Meinert et al., 2005). Afterward, only since the 19th
century, did skarn deposits begin to be described in scientific publications (Meinert, 1992).
Although there were earlier descriptions of skarn forming processes and deposits, Alfred Elis
Törnebohm may be considered the first author to use the term “skarn” in a scientific publication in
1875 (Meinert et al., 2005).
Nowadays, the widely used definition of “skarn” (Robb, 2005; which is also used in the present
study) is the one discussed by Einaudy et al. (1981, in Kwak 1986, 1987), which defends the
replacement-style rocks. Thus, a skarn is a calc-silicate rock formed by metasomatic replacement
of carbonate lithologies (independent of whether they are Ca- or Mg-rich) by silicate minerals,
during regional or contact metasomatic processes connected to igneous intrusions (Pirajno, 1992,
2009). Therefore, a skarn is a metasomatic rock with a complex mineralogy of granoblastic
texture, composed by calc-silicate minerals, such as garnets (either andradite or grossular),
epidote, vesuvianite, diopside, and wollastonite, originated from percolation of magmatic fluids in a
carbonate rock (Moura and Velho, 2011).
2.1.1. Genesis and formation
According to Pirajno (1992, 2009), the generation of skarns implicates a sequence of processes
related to and correlated with the late magmatic and hydrothermal events associated with a
magmatic intrusion in sedimentary rocks. Therefore, as explained above, it results from the
replacement of carbonate lithologies by silicate minerals. This alteration type is called silication,
which is a process connected with the metamorphic and metasomatic contact with those
carbonate rocks, promoted by the emplacement and cooling of some intrusion.
Consequently, skarn deposits are originated in three sequential stages (Figures 2.1 and 2.2;
Einaudi et al., 1981, in Robb, 2005; Meinert, 1992; Pirajno, 1992, 2009): (1) an isochemical
2. Geological setting of skarn deposits
alteration stage. According to Pirajno (1992, 2009), these stages match with the early potassic and
later hydrolytic alterations on the porphyry stock or intrusion; skarns develop at temperatures
varying from 200 to 700°C, and pressures ranging from 0.3 to 3 kbar; and the salinities of
metasomatic fluids vary between 10 and about 45 wt%.
Figure 2.1 – Formation stages of skarns in function of temperature and time (adapted from Pirajno, 2009).
Figure 2.2 – Schematic formation stages of skarns: (a) isochemical prograde thermal metamorphism; (b)
metasomatism; (c) retrograde hydrothermal alteration (adapted from Pirajno, 2009).
The isochemical prograde thermal metamorphic stage (Figures 2.1 and 2.2 a) is induced by a
2. Geological setting of skarn deposits
In spite of the thermal contact during this stage, there is also fluid circulation of mostly H2O and
CO2 as a result of the prograde metamorphic reactions. The present stage has no associated
mineralizations, however there are dehydration processes near the borders of the intrusion that
might be important to increase the porosity of the source rocks and to ease up the fluid flux of later
mineralization phases.
Continuing by the metasomatic stage (Figures 2.1 and 2.2 b), at deeper crustal levels the fluid flux
is probably concentrated by structural or bedding parallel conducts, whilst at upper levels it is more
pervasively distributed. Although the alteration is more pervasive and coarse-grained at this stage,
comparing with the uppermost stage, the metasomatic mineral assemblages are similar. Ca, Mg
and CO2 (which are into the carbonate sediments) are replaced by Si, Al and Fe, and are inserted
into the metasomatic system. During this stage sulfide mineralizations do not occur, but magnetite
and scheelite precipitate in the final phases (Robb, 2005).
Finally, the retrograde hydrothermal alteration stage (Figures 2.1 and 2.2 c) comprises the
progressively cooling and decline of the high temperature magmatic fluid system, because the
fluids become gradually dominated by shallow meteoric waters (Burt, 1977). Thus a sequence of
retrograde reactions and the precipitation of sulfide-related mineralization occur (Einaudi et al.,
1981, in Robb, 2005). The paragenetically late precipitation of most skarn-related ores indicates
that the precipitation of the metals is linked to the declining temperature of the ore fluids (and a
consequent drop in solubilities), the fluid mixing, or the ore fluid neutralization by the reaction with
the carbonate rocks (Robb, 2005).
2.1.2. Classifications
There are several classifications for skarn deposits. Burt (1977) referred that the skarn deposits
have been classified by their scale, structure, replaced rock and mined metals. Meinert (1992)
noted that they may be classified according to descriptive and genetic characteristics, such as the
prevailing economic metals, the protolith composition, the temperature of formation, and the
mechanism of fluid movements. In spite of there being so many classifications followed by different
authors, they refer roughly the same types and definitions. The more adopted classification is
based on the prevailing economic metals, although not all skarns have economic mineralizations
(Meinert et al., 2005). Hence, the skarns that include ore mineralization, characteristically
metalliferous, are named skarn deposits.
Adopting Burt’s above referred classifications (1977), when skarns are classified by scale, there
are two types: (1) the reaction skarns, diffusional skarns, bimetasomatic skarns, or metamorphic
skarns; and (2) the replacement skarns, infiltrational skarns, ore skarns, or metasomatic skarns
(Kwak, 1987). The first can be originated mostly by isochemical metamorphism of thinly
interbedded shale and carbonate layers (Meinert, 1992; Meinert et al., 2005; Pirajno, 2009), being
2. Geological setting of skarn deposits
mineralization, formed by infiltration of fluids, which are from igneous intrusions (Pirajno, 2009),
and post-date the metamorphic skarns, i.e., they result by metasomatic processes interacting with
the metamorphic skarns, being of larger scale (varying from cm to hundred m, or more; Burt, 1977;
Kwak, 1987).
Continuing with the same classification, the replacement skarns may be classified according to
their structural relations with an intrusion (Burt, 1972, in Burt, 1977) in: (1) normal or skarn around
intrusive, if carbonate rocks are replaced by being adjacent to a small intrusive body; (2) inverse or
intrusive around skarn, if roof pendants or xenoliths are replaced by a large intrusive batholith; and
(3) no intrusive or skarn along a vein, if skarns take place along veins, far from an exposed
intrusion.
Still following Burt´s referred classification (1977), skarns can also be classified according to the
replaced lithology, that is, the initial protolith, as: (1) exoskarn; or (2) endoskarn. An exoskarn
occurs when the protolith is a carbonate rock, i.e., the metasomatic assemblage is external to the
intrusion. Whereas, an endoskarn takes place if the protolith is an igneous or other aluminous
rock, that is, the metasomatic assemblage is internal to the intrusion (Meinert, 1992; Pirajno, 1992,
2009; Meinert et al., 2005; Robb, 2005).
In turn, the exoskarns can be divided into: (1) calcic skarns, when Ca-rich and if the protolith is a
limestone; or (2) magnesian skarn, when Mg-rich and if the replaced rock has a dolomitic
composition. As mineralogical content, the calcic skarns may have garnets (from
andradite-grossularite series), clinopiroxenes (from diopside-hedenbergite series), wollastonite, scapolite,
epidote, and magnetite. While magnesian skarns may have in silica-poor environments, diopside,
forstrite, serpentinite, magnetite and talc, and in silica-rich environments, talc and
tremolite-actinolite (Burt, 1977; Meinert, 1992; Pirajno, 1992, 2009; Meinert et al., 2005; Robb, 2005).
Pirajno (1992, 2009) also refers the existence of silica-pyrite skarns associated with some
porphyry deposits, and Meintert et al. (2005) also makes reference to mangan skarns.
According to the prevailing economic metals/ores classification, Burt (1977) referred the
subdivision of the skarn deposits in four cathegories: (1) Fe (iron skarns), when it contains
magnetite or, rarely, specularite; (2) Cu (cupriferous skarns), when it has chalcopyrite, bornite and
other sulfides; (3) Zn (zinciferous skarn), when it contains sphalerite; and (4) W (tungsten skarn),
when have scheelite. Later, other authors have added two more types to this classification, which
have stayed: (1) W; (2) Mo-Sn; (3) Cu; (4) Fe; (5) Zn; and (6) Au (Pirajno, 1992; Robb, 2005).
Pirajno (1992), for example, subdivided these types whether they are related with porphyry skarns
or not: (1) Cu and Fe are porphyry-related skarns; while (2) Fe, W, Sn and Mo are
non-porphyry-related skarns. So, despite there being exceptions, Robb (2005) associated the last types
according to the composition of the igneous intrusions (Figure 2.3): (1) Fe and Au skarn deposits
are usually linked with intermediate to mafic intrusions; (2) Cu, Zn and W deposits are normally
associated with calc-alkaline, magnetite-bearing, I-type granitic intrusions; and (3) Mo-Sn are
2. Geological setting of skarn deposits
Figure 2.3 – Skarn deposits types according with the prevailing economic metals (adapted from Robb, 2005).
According to the above classifications, it is possible to refer that the case study skarn deposit is a
replacement, normal, exo-calcic, and W skarn deposit (O’Donovan, 2012; Beare and MacDougal,
2013). Therefore, it is only missing to define what is a W skarn deposit. A W skarn deposit is
referred to a skarn that holds anomalous W grades with Sn low-grade, or even no Sn. This kind of
deposit is usually stratiform (extending for hundreds of m with thicknesses unusually exceeding 12
m), and derives from interlayered carbonates and pelites (Kwak, 1987). It is linked to
coarse-grained equigranular batholiths with pegmatite and aplite dykes, and surrounded by large
high-temperature metamorphic aureoles (Meinert, 1992). These batholiths are characteristically
connected with calc-alkaline intrusions from a relatively deep environment (Robb, 2005; Pirajno,
2009) of generally I-type (Kwak, 1987), although there are exceptions of S-type intrusions, such as
the batholith next to São Pedro das Águias skarn deposit (O’Donovan, 2012; Beare and
MacDougal, 2013; Cerejo, 2013; Cerejo et al., 2014).
2.1.3. Skarn deposits all over the world
Skarn deposits are broadly distributed all over the world (Kwak, 1987; Meinert, 1992; Meinert et
2. Geological setting of skarn deposits
relatively younger deposits are the economically the most important (Burt, 1977). They are also
one of the most plentiful ore types in the Earth’s crust (Meinert et al., 2005), and most of them
were mined for a range of elements (Meinert, 1992) occurring in the most tectonic settings, such
as oceanic steep subduction, continental drifting, etc. (Figure 2.4; Einaudi et al., 1981, in Pirajno,
2009; Meinert et al., 2005).
Figure 2.4 – Map showing the distribution of the large W and Sn skarn deposits and of the crustal elements;
closed squares – W skarn deposits; crosses – Sn skarn deposits; dashed lines areas – Phanerozoic fold
belts; dense dotted areas – Precambrian shields; lightly dotted areas – ancient platforms (Kwak, 1987).
Summing up, for instance Meinert (1992) and Pirajno (2009) selected a set of examples of the
major skarn deposits divided by the prevailing economic metals. As few examples of Cu skarn
deposits, there are Mines Gaspé (Quebec) and Bingham (Utah), both associated with porphyry Cu
deposits. Continuing with the W-type, to exemplify the Pine Creek (California) and the King Islands
(Tasmania). Passing by the Sn-type, Moina (Tasmania) and Lost River (Alaska), which are good
examples. About Au-type, there are Crown Jewel (Washington) and Navachab (Namibia) for
instance. For the Zn-type there are the Nakatatsu Mine (Japan) and the Naica (Mexico). Good
examples of the Mo-type are Yangchiaachangtze (China) and Azegour (Morocco). Finally, for
Fe-Skarns, there are Teya Deposit (Russia) and Larap (Philippines).
According to the case study skarn deposit type, Kwak (1987) presented the large W and Sn skarn
2. Geological setting of skarn deposits
Phanerozoic fold belts, the Precambrian shields, and the ancient platforms; Figure 2.4).
Apparently, these types of skarn deposits take place mostly into the Phanerozoic fold belts areas
(more than 90% of the cases), both in marginal to major plates (Cordilleran area, North America)
and within plates (central Asia).
2.1.4. Skarn deposits in Portugal
The skarn deposits in Portugal are mainly distributed in the central-northern part of the country.
Most of the Portuguese skarns are located in the Central Iberian Zone, occurring in practically the
whole the Dúrico-Beirão Supergroup lithostratigraphic sequences (Sousa, 1981). As the case
study deposit, according to Martins (2012) the skarn deposits in the Dúrico-Beirão Supergroup
contain scheelite, and are inserted in the Douro Scheelite Belt (Figure 2.5). Despite this fact, the
same author and Moura and Velho (2012) also refer to the existence of small skarn deposits in
Vila Nova de Cerveira and Covas (district of Viana do Castelo) in the Silurian sequences, and
Pinto (1984) also refers that there are skarns in Ossa-Morena Zone, namely in Alvito.
Figure 2.5 – Map showing the W and Sn potential areas in Portugal with mineralizations (Martins, 2012).
According to the skarn deposits in the Dúrico-Beirão Supergroup lithostratigraphic sequences,
2. Geological setting of skarn deposits
itself in Tabuaço (as referred before), the Riba de Alva (between Barca de Alva and
3. Materials
3. Materials
The present section intends to demonstrate the geological issues about the São Pedro das Águias
skarn deposit in particular. It has the objective of reporting the particular topics that implicate the
São Pedro das Águias skarn deposit formation, from the Variscan Orogeny, passing by the Iberian
Massif, the Central Iberian Zone, the regional geology, to the local geology, the available
database, and a multivariate analysis of correlations between elements fingerprints, lithologies and
hydrothermal alteration types.
3.1. Geological setting of the São Pedro das Águias skarn
deposit
The São Pedro das Águias skarn deposit is situated in the central sector of the Central Iberian
Zone, a tectono-stratigraphic unit of the Iberian Massif of the Iberian Variscan Belt, which is in turn
included in the European Variscan Fold Belt. These issues will be presented later in the present
subsection. In order to introduce the geological setting of the São Pedro das Águias skarn deposit,
it is necessary to go back to the period between the Late Proterozoic and the Early Paleozoic. In
this time span two oceans opened in the Earth, Iapetus and Tornquist, which detached three
continental masses (Catalán et al., 2007): (1) Laurentia; (2) Baltica; and (3) Avalonia.
Possibly, Avalonia originated close to Gondwana, due to its fauna (Cocks and Fortey, 1988, in
Catalán et al., 2007). However in the Late Cambrian–Early Ordovician this microcontinent or
terrane drifted forming the Rheic Ocean. Finally, during the Devonian, the closure of this ocean
formed the Variscan Belt in central and western Europe and northern Africa, and the Alleghanian
Orogen in North America (ex. gr., Hatcher, 1982, in Catalán et al., 2007), in which originated the
Pangea Supercontinent (Catalán et al., 2007).
The studied mineralizations are hosted in a Lower Cambrian stratigraphic sequence (Bateiras
Formation of the Douro Group of the Dúrico-Beirão Supergroup), which ultimately records the
break-up processes at the North-Gondwana margin (Catalán et al., 2007).
3.1.1. Variscan Orogeny
The Variscan Orogeny began with the initial episodes of the oceanic closure that drove to the
formation of Pangea. This oceanic closure, according to Catalán et al. (2007), took place by the
actuation of three sets of orogenic diachronic episodes: (1) the initial one occurred during the Late
Cambrian and the Middle Ordovician, and it was an arc-continent collision in both sides of the
Iapetus Ocean (ex. gr., Kelling et al., 1985, in Catalán et al., 2007), which originated the
3. Materials
respectively; Figure 3.1), and The Appalachians (the Taconic and the Penobscottian Belts; Figure
3.1); (2) the second event happened between the Early Silurian and the Late Devonian, and gave
rise to Laurussia with the closure of Iapetus, and the collision of Laurentia with Baltica and
Avalonia (forming an arc in the Avalonia side; ex. gr., Soper, 1988, in Catalán et al., 2007); and,
finally, (3) the last one took place during the Carboniferous and the Early Permian, originating an
intense deformation in Europe and Africa, and The Appalachians (the Variscan and the
Alleghanian belts, respectively; Figure 3.1), resulting in the formation of Pangea with the closure of
the Rheic and Theic Oceans, and the collision of Gondwana with Laurussia (Lefort, 1989, in
Catalán et al., 2007).
Figure 3.1 – Sketch showing the Iberia position in relation to the Appalachian, Caledonian and Variscan belts
at the end of Variscan convergence; LBM – London-Brabant Massif (adapted from Catalán et al., 2002, in