CPD
11, 3759–3798, 2015Development of
coccolithophore-based transfer functions
B. Ausín et al.
Title Page
Abstract Introduction
Conclusions References
Tables Figures
◭ ◮
◭ ◮
Back Close
Full Screen / Esc
Printer-friendly Version Interactive Discussion
Discussion
P
a
per
|
Discussion
P
a
per
|
Discussion
P
a
per
|
Discussion
P
a
per
|
Clim. Past Discuss., 11, 3759–3798, 2015 www.clim-past-discuss.net/11/3759/2015/ doi:10.5194/cpd-11-3759-2015
© Author(s) 2015. CC Attribution 3.0 License.
This discussion paper is/has been under review for the journal Climate of the Past (CP). Please refer to the corresponding final paper in CP if available.
Development of coccolithophore-based
transfer functions in the Western
Mediterranean Sea: a sea surface salinity
reconstruction for the last 15.5 kyr
B. Ausín1, I. Hernández-Almeida2, J.-A. Flores1, F.-J. Sierro1, M. Grosjean2,
G. Francés3, and B. Alonso4
1
Department of Geology, University of Salamanca, Plaza de los Caídos s/n, 37008 Salamanca, Spain
2
Institute of Geography and Oeschger Centre for Climate Change Research, University of Bern, Erlachstrasse 9a, 3012 Bern, 3012 Bern, Switzerland
3
Department of Marine Geosciences, University of Vigo, Campus As Lagoas – Marcosende, 36310 Vigo, Spain
4
CPD
11, 3759–3798, 2015Development of
coccolithophore-based transfer functions
B. Ausín et al.
Title Page
Abstract Introduction
Conclusions References
Tables Figures
◭ ◮
◭ ◮
Back Close
Full Screen / Esc
Printer-friendly Version Interactive Discussion
Discussion
P
a
per
|
Discussion
P
a
per
|
Discussion
P
a
per
|
Discussion
P
a
per
|
Received: 4 August 2015 – Accepted: 5 August 2015 – Published: 21 August 2015
Correspondence to: B. Ausín ([email protected])
CPD
11, 3759–3798, 2015Development of
coccolithophore-based transfer functions
B. Ausín et al.
Title Page
Abstract Introduction
Conclusions References
Tables Figures
◭ ◮
◭ ◮
Back Close
Full Screen / Esc
Printer-friendly Version Interactive Discussion
Discussion
P
a
per
|
Discussion
P
a
per
|
Discussion
P
a
per
|
Discussion
P
a
per
|
Abstract
A new dataset of 88 marine surface sediment samples and related oceanic environ-mental variables (temperature, salinity, chlorophylla, oxygen, etc.) was studied to quan-tify the relationship between assemblages of coccolithophore species and modern en-vironmental conditions in the Western Mediterranean Sea and the Atlantic Ocean, west
5
of the Strait of Gibraltar. Multivariate statistical analyses revealed that coccolithophore species were primarily related to the sea surface salinity (SSS) gradient, which ex-plains an independent and significant proportion of variance in the coccolithophore data. A quantitative coccolithophore-based transfer function to estimate SSS was de-veloped using the Modern Analog Technique (MAT) and weighted-averaging
partial-10
least square regression (WA-PLS). The bootstrapped regression coefficient (Rboot2 ) was 0.85MATand 0.80WA-PLS, with root-mean square error of prediction (RMSEP) of 0.29MAT
and 0.30WA-PLS (psu). The resulting transfer function was applied to fossil coccol-ithophore assemblages in the highly resolved (∼65 yr) sediment core CEUTA10PC08 from the Alboran Sea (Western Mediterranean) in order to reconstruct SSS for the last
15
25 kyr. The reliability of the reconstruction was evaluated by assessing the degree of similarity between fossil and modern coccolithophore assemblage, and comparison of reconstruction with fossil ordination scores. Analogs were poor for the stadials associ-ated with Heinrich Event 2 and 1 and part of the Last Glacial Maximum. Good analogs indicate more reliable reconstruction of the SSS for the last 15.5 kyr. During this
pe-20
riod, several millennial and centennial SSS changes were observed and associated with variations in the Atlantic Water entering the Alboran Sea, sea-level oscillations, and arid or humid atmospheric conditions in the Western Mediterranean.
1 Introduction
Coccolithophores are one of the major components of marine phytoplankton. They are
25
CPD
11, 3759–3798, 2015Development of
coccolithophore-based transfer functions
B. Ausín et al.
Title Page
Abstract Introduction
Conclusions References
Tables Figures
◭ ◮
◭ ◮
Back Close
Full Screen / Esc
Printer-friendly Version Interactive Discussion
Discussion
P
a
per
|
Discussion
P
a
per
|
Discussion
P
a
per
|
Discussion
P
a
per
|
and salinity and are widely used in qualitative paleoenvironmental studies (Baumann et al., 2005; Guerreiro et al., 2013, 2014). These studies provide general insight into the response of coccolithophores to environmental variables, but quantitative studies (e.g. transfer functions) allow assessing these relationships in a more rigorous and clear manner. Transfer functions are based on the calibration of the modern relationship
be-5
tween organisms and environmental conditions, and this information is in turn used to reconstruct past environmental variables. Different statistical approaches based on coccolithophores have been proposed in order to generate quantitative paleorecon-structions of different ecological variables. Giraudeau and Rogers (1994) used factor analyses and multiple regressions to estimate chlorophyllafrom coccolithophore
cen-10
sus counts in surface sediment samples in the Benguela upwelling area. Several au-thors (Beaufort et al., 2001, 1997; Incarbona et al., 2010) calibrated the relative abun-dance of the coccolithophoreFloriphaera profunda in surface sediment samples with respect to primary productivity and reconstructed past variations of this parameter in the Indian and Pacific oceans and in the Central Mediterranean Sea. Saavedra-Pellitero
15
et al. (2011, 2013) used linear regression methods to derive past SST estimates in the southeast Pacific Ocean from coccolithophore census counts and accumulation rates. Bollmann et al. (2009) and Bollmann and Herrle (2007) applied multiple linear regres-sions to morphometric measurements of the coccolithophore Emiliania huxleyi from globally distributed core-top and plankton samples to obtain modern and past sea
sur-20
face salinity (SSS) estimates.
To date, no coccolithophore-based transfer function has been applied in the Western Mediterranean Sea, a semi-enclosed basin situated at mid-latitudes (Fig. 1a). In this region evaporation exceeds precipitation plus runoff, such that water budgets tend to be balanced by the advection of relatively less saline Atlantic Water (AW) through the
25
CPD
11, 3759–3798, 2015Development of
coccolithophore-based transfer functions
B. Ausín et al.
Title Page
Abstract Introduction
Conclusions References
Tables Figures
◭ ◮
◭ ◮
Back Close
Full Screen / Esc
Printer-friendly Version Interactive Discussion
Discussion
P
a
per
|
Discussion
P
a
per
|
Discussion
P
a
per
|
Discussion
P
a
per
|
longitudinal gradients between the Atlantic Ocean and the Western Mediterranean in annual terms. In this confined basin, the estimation of changes in those environmental parameters is essential for determining Atlantic–Mediterranean water mass exchange through the Strait of Gibraltar in the past (Rohling and Bigg, 1998; Schmidt, 1998). This exchange depends on variations in the hydrological cycle, ice-volume effects, and
5
Mediterranean circulation patterns, which have a thermohaline origin (MEDOCGROUP, 1970).
The aim of this study is to explore the potential of coccolithophores for the devel-opment of quantitative reconstructions in the Western Mediterranean Sea. We study the response of coccolithophore assemblages from surface sediment samples from
10
Atlantic Ocean and Mediterranean Sea to environmental variables. The resulting cal-ibration model (transfer function) for salinity was used to reconstruct SSS changes at high-resolution in the Alboran Sea (Fig. 1a) for the last 25 kyr. The reliability of the reconstruction was assessed by analysis of the similarity between fossil and modern coccolithophore assemblages, and fossil ordination scores. Finally, centennial and
mil-15
lennial SSS changes are described and discussed, and compared to regional records of SST, organic matter preservation and continental aridity.
2 Materials and methods
2.1 Modern training set
2.1.1 Surface sediment samples
20
Initially, 117 core tops located around a horizontal transect along the Western Mediter-ranean Sea and near the Gulf of Cadiz in the Atlantic Ocean were selected. They had been retrieved at varying water depths ranging from 70 to 2620 m during sev-eral oceanographic surveys and were stored at the University of Vigo and at the Core Repository of the Institute of Marine Sciences – CSIC in Barcelona. The first cm (or the
CPD
11, 3759–3798, 2015Development of
coccolithophore-based transfer functions
B. Ausín et al.
Title Page
Abstract Introduction
Conclusions References
Tables Figures
◭ ◮
◭ ◮
Back Close
Full Screen / Esc
Printer-friendly Version Interactive Discussion
Discussion
P
a
per
|
Discussion
P
a
per
|
Discussion
P
a
per
|
Discussion
P
a
per
|
second, if the first was unavailable) of the 117 core tops was sampled, assuming that it essentially represents present-day conditions.
2.1.2 Environmental variables
Data on temperature (Locarnini et al., 2013), salinity (Zweng et al., 2013), chlorophylla
(Boyer et al., 2013), oxygen content and saturation (García et al., 2014a), nitrate,
phos-5
phate, and silicate (García et al., 2014b) were obtained from the 2013 World Ocean Atlas (WOA13), and mixed layer depth (Monterey and Levitus, 1997), total alkalinity (TALK) and total dissolved inorganic carbon (DIC) (Goyet et al., 2000) for the training
set sites were taken 1◦ longitude by 1◦ latitude grid, using weighted averaged grid-ding by Ocean Data View (ODV) software (Schlitzer, 2014). Similarly, data on pH and
10
carbonate (CO23−) were calculated using the “derived variable” tool of ODV software. These data have been averaged annually and seasonally (for summer and winter) from 1955 to 2012 and were selected at 10, 20, 30, 50, 75, 100, 125, 150, 200 and 300 m water depth.
2.2 Fossil data set
15
The fossil coccolithophore data set used for the reconstruction comprises coc-colithophore census counts from core CEUTA10PC08 (36◦1′22′′N, 4◦52′3′′W; 914 m b.s.l.) located in the Alboran Sea, previously published by Ausín et al. (2015). Fossil assemblages show good-to-moderate degree of preservation. Location of this core lies under the modern path of the AW at the surface, near the Strait of Gibraltar
20
CPD
11, 3759–3798, 2015Development of
coccolithophore-based transfer functions
B. Ausín et al.
Title Page
Abstract Introduction
Conclusions References
Tables Figures
◭ ◮
◭ ◮
Back Close
Full Screen / Esc
Printer-friendly Version Interactive Discussion
Discussion
P
a
per
|
Discussion
P
a
per
|
Discussion
P
a
per
|
Discussion
P
a
per
|
2.3 Micropaleontological analyses
Both modern (surface sediment) and fossil (downcore) samples were prepared for coccolithophore analyses according to the techniques proposed by Flores and Sierro (1997). A polarized-light microscope at 1000× magnification was employed to iden-tify and count at least 500 coccoliths in each sample, belonging to 21 different taxa.
5
Species whose relative abundance was<1 % in the first count were considered later in 20 visual fields in order to estimate their abundance accurately. The final relative abun-dance of each species in each sample was then recalculated. Gephyrocapsa speci-mens smaller than 3 µm were lumped together and designated “smallGephyrocapsa” (Flores et al., 1997). The “medium Gephyrocapsa” group was made up of
Gephyro-10
capsawhose size was between 3 and 5 µm. The following species were split according
to the size criteria:E. huxleyi(<4 and>4 µm) andGephyrocapsa oceanica(<5 and
>5 µm). Other taxa identified in this study were Calcidiscus leptoporus,F. profunda,
Gephyrocapsa caribbeanica, Gephyrocapsa muellerae,Helicosphaeraspp., and
Syra-cosphaera spp. (as dominant taxa). The rare taxa identified were Braarudosphaera
15
bigelowii, Calciosolenia murrayi, Coccolithus pelagicus subsp. braarudii, Coccolithus
pelagicus subsp. pelagicus, Oolithotus fragilis, Pontosphaera spp., Rhabdosphaera
clavigera, Umbilicosphaeraspp. andUmbellosphaeraspp.
Twenty-nine samples were finally eliminated from the initial modern data set owing to their high content (>10 %) in obviously reworked nannofossils. These taxa belong to
20
older stratigraphic levels (consistently older than the Pliocene in this study), meaning that they were resuspended and transported from their original location to the sample site, and lack any relationship with modern environmental conditions. Therefore, the final training set (Supplement) comprised 88 surface samples (Fig. 1b): 78 from the Western Mediterranean (58 from the Balearic Sea and 20 from the Alboran Sea) and
25
CPD
11, 3759–3798, 2015Development of
coccolithophore-based transfer functions
B. Ausín et al.
Title Page
Abstract Introduction
Conclusions References
Tables Figures
◭ ◮
◭ ◮
Back Close
Full Screen / Esc
Printer-friendly Version Interactive Discussion
Discussion
P
a
per
|
Discussion
P
a
per
|
Discussion
P
a
per
|
Discussion
P
a
per
|
2.4 Statistical analyses
2.4.1 Relationship between coccolithophore assemblages and environmental
variables
Prior to statistical analyses, environmental variables were checked for unimodal dis-tribution. Only mixed layer depth,TALK and DIC were log10 transformed, since
trans-5
formation of other variables did not cause noticeable changes. Principal Component Analyses (PCA) was performed on this initial data set to assess the major environmen-tal gradients and collinearity among the variables.
Coccolithophore relative abundances were square-root transformed to stabilize their variances. The species Braarudosphaera sp., Calciosolenia sp., Coccolithus
pelagi-10
cussubsp.braarudii, Coccolithus pelagicussubsp.pelagicus, and Pontosphaeraspp., were excluded from the modern (and consequently from the fossil) coccolithophore assemblages since their maximum relative abundance was not >1 % in at least two samples. Detrended Correspondence Analysis (DCA) was then performed on the mod-ern coccolithophore assemblage to estimate the length of the environmental gradient.
15
A length of the first DCA axis>2 Standard Deviation (SD) units indicates the unimodal responses of the organisms (Birks, 1995; ter Braak and Prentice, 1988), while shorter lengths indicate linear responses.
The Akaike’s information criterion (AIC) was used in an ordination analysis to identify the minimum number of variables (subset) that, being statistically significant, explained
20
the maximum variation in the modern coccolithophore assemblage. Canonical Corre-spondence Analysis (CCA) was used to evaluate the influence of this environmental subset to explain coccolithophore distribution in the modern training set.
The ratio between the first constrained axis and the first unconstrained axis (λ1/λ2) was used as diagnosis to test the strength of a single environmental variable when
25
coc-CPD
11, 3759–3798, 2015Development of
coccolithophore-based transfer functions
B. Ausín et al.
Title Page
Abstract Introduction
Conclusions References
Tables Figures
◭ ◮
◭ ◮
Back Close
Full Screen / Esc
Printer-friendly Version Interactive Discussion
Discussion
P
a
per
|
Discussion
P
a
per
|
Discussion
P
a
per
|
Discussion
P
a
per
|
colithophore training set explained uniquely by each significant environmental variable was calculated using variance partitioning.
Ordination analyses and variance partitioning were performed using the “vegan” package v.2.3. (Oksanen et al., 2015) for R (R Development Core Team, 2015).
2.4.2 Transfer function
5
Calibration models were calculated for the variable of interest (and every variable by means of exploratory analysis) using the weighted-averaging-partial least squares (WA-PLS) (ter Braak and Juggins, 1993; ter Braak et al., 1993) and the Modern Analog Technique (MAT) (Prell, 1985), both implemented in C2 version 1.4.3 software (Juggins, 2007). All models were calculated for the cross-validation predictions by bootstrapping
10
(999 permutation cycles) (Birks, 1995). In MAT, the number of analogs resulting in the maximum coefficient of determination (Rboot2 ) between the observed and predicted val-ues and the lowest root-mean square error of prediction (RMSEP) (Telford et al., 2004) was calculated using an optimization set together with the usual training and test sets implemented in the “analoge” package for R (R Development Core Team, 2015). In
WA-15
PLS, a decrease of 5 % or more in RMSEP was required to retain the next component (Birks, 1995; ter Braak et al., 1993).
Telford et al. (2013) reported that SST reconstructions based on planktonic foraminifera census counts calibrated at a fixed depth and for a particular season might be biased. The most suitable calibration should be based on the depth and season
20
that most influenced the coccolithophore fossil assemblage from core CEUTA10PC08. These were determined by testing the statistical significance of the summer, winter, and annual reconstructions of the variable of interest at 10 different depths of the upper photic zone from 10 to 300 m, following the procedure described by Telford et al. (2013), using the “paleoSig” package v.1.1-1 (Telford, 2015) for R (R Development Core Team,
25
2015).
CPD
11, 3759–3798, 2015Development of
coccolithophore-based transfer functions
B. Ausín et al.
Title Page
Abstract Introduction
Conclusions References
Tables Figures
◭ ◮
◭ ◮
Back Close
Full Screen / Esc
Printer-friendly Version Interactive Discussion
Discussion
P
a
per
|
Discussion
P
a
per
|
Discussion
P
a
per
|
Discussion
P
a
per
|
determined as those whose absolute residual was higher than the mean SD of the observed values (Edwards et al., 2004).
A combination of the highestRboot2 and the lowest RMSEP was used as a criterion for the quality prediction of the model. The graphical representations of the observed val-ues against the valval-ues predicted by the model and the residuals against the predicted
5
values were used as a diagnosis of the model.
2.4.3 Derived reconstruction and evaluation
MAT and WA-PLS were applied to the fossil coccolithophore assemblages of core CEUTA10PC08, which were previously square-root transformed. In order to assess the quality of the modern analogs for the fossil (downcore) samples, the squared chord
10
distance between each fossil sample and each sample in the modern training set (Over-peck et al., 1985) was calculated with MAT using C2 version 1.4.3 software (Juggins, 2007). A squared chord distance below the 10th percentile would be considered good, while values above this cutoffwould represent assemblages with poor analogs (Simp-son, 2007).
15
The first axis of the PCA analyses of the fossil dataset (PC1fossil) shows the most important changes in the composition of the fossil coccolithophore assemblage. Com-parison between PC1fossiland the reconstructed variable of interest was used to assess
whether the reconstruction could be considered representative of the major ecological changes of the fossil assemblage (Juggins, 2013).
20
3 Results
3.1 Geographical distribution of coccolithophores
The geographical distribution of the main coccolithophore taxa is shown in Fig. 2. The relative abundance ofE. huxleyi<4 µm increases from the southern Spanish coast to the northern African coast, and high values are observed around the mouth of the Ebro
CPD
11, 3759–3798, 2015Development of
coccolithophore-based transfer functions
B. Ausín et al.
Title Page
Abstract Introduction
Conclusions References
Tables Figures
◭ ◮
◭ ◮
Back Close
Full Screen / Esc
Printer-friendly Version Interactive Discussion
Discussion
P
a
per
|
Discussion
P
a
per
|
Discussion
P
a
per
|
Discussion
P
a
per
|
River Delta (Fig. 2a). By contrast, the smallGephyrocapsagroup (Fig. 2b) shows the opposite distribution: a decreasing relative abundance from the Spanish to the African coast and low values near the Ebro River Delta.E. huxleyi<4 µm and the small
Gephy-rocapsagroup are small placoliths that on average constitute 83 % of coccolithophore
assemblages. G. caribbeanicaand F. profunda (Fig. 2c and d) are more abundant in
5
the Atlantic Ocean (up to 16 and 13 %, respectively).C. leptoporusandHelicosphaera spp. (Fig. 2e and f) show patchy distributions and are more abundant (up to 7 %) around the Catalan margin and the Balearic Islands.G. muellerae(Fig. 2g) is more abundant southeast of the Balearic Islands and shows a patch of 2 % abundance in the northern part of the Alboran Sea.G. oceanica(<5 µm) (Fig. 2h) is mostly distributed near the
10
Strait of Gibraltar, reaching up to 6 % of relative abundance. It also shows a patch of 3 % relative abundance around the Andarax River mouth (Figs. 1a and 2h).
3.2 Relationship between coccolithophores and environmental variables
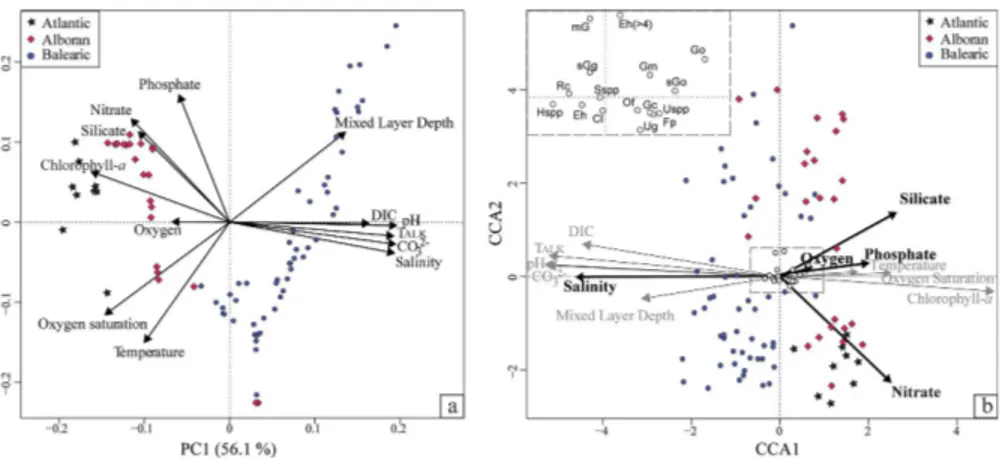
The PC1 explains 56.1 % of the variance within the environmental data set (Fig. 3a) and is highly correlated to CO23−, salinity, pH andTALK. PC2 explains 22.3 % of the total
15
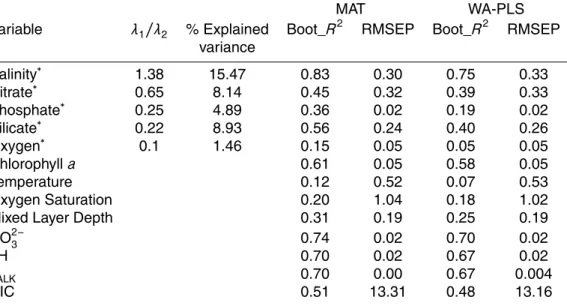
variance and summarizes primarily the information from temperature and phosphate. The ordination based on the AIC determined that only salinity, nitrate, phosphate, silicate and oxygen are needed to explain the maximum variation in the modern coc-colithophore assemblage and are significant at the 95 % level when added individually to the model via a forward selection procedure. The first axis of the DCA performed
20
on the modern coccolithophore assemblage was 2.6 SD units. Accordingly, unimodal methods were followed. The CCA (Fig. 3b) reveals sites and species distribution along this environmetal subset. The others were also plotted as passive variables to avoid overfitting. Vectors reflect that salinity exhibits the longest gradient and is strongly cor-related with CCA1, indicating a strong relationship with coccolithophore distribution.
25
Some sites from the Alboran and Balearic Sea and the taxa mediumGephyrocapsa
andE. huxleyi (>4 µm) are distributed along the CCA2. Individual CCAs (Table 1) to
CPD
11, 3759–3798, 2015Development of
coccolithophore-based transfer functions
B. Ausín et al.
Title Page
Abstract Introduction
Conclusions References
Tables Figures
◭ ◮
◭ ◮
Back Close
Full Screen / Esc
Printer-friendly Version Interactive Discussion
Discussion
P
a
per
|
Discussion
P
a
per
|
Discussion
P
a
per
|
Discussion
P
a
per
|
to be significant. Variance partitioning revealed that these significant variables account for 38.9 % of the cumulative variance in the coccolithophore training set and salinity explains large proportion of this variance (15.5 %).
3.3 Transfer functions
Salinity explained the largest amount of variation in the coccolithophore assemblages
5
and consequently, was chosen to develop the coccolithophore-based transfer function. Additionally, comparison among theRboot2 from preliminary calibration models for each variable confirmed the best predictive power for salinity (Table 1).
Among the WA-PLS models for salinity, the two-component model (WA-PLS2) was chosen as the most suitable since it afforded a reduction of 6.4 % in the RMSEP. The
10
ideal number of analogs for MAT was six.
The analyses of the amount of down-core variance explained by the summer, winter, and annual salinity reconstructions at 10 different depths and their statistical signif-icance revealed that the mean-annual reconstruction at 10 m explained the highest variance. Hence, the reconstruction for core CEUTA10PC08 was based on the
mean-15
annual salinity data at 10 m depth and referred to as SSS reconstruction.
Five samples showed higher residuals than the SD of salinity and were preliminary identified as potential outliers (Supplement). However, only one of these samples (CO-81-2/TK-2) was identified as outlier in both MAT and WA-PLS regression methods. This had a bright yellowish color under the microscope, likely due to the effect of diagenetic
20
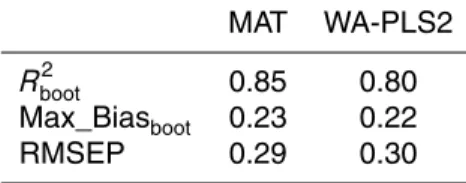
processes. In order to retain the maximum number of observations representing mod-ern environmental conditions, only this sample was removed from subsequent model implementations, leading to an improvement of the MAT and WA-PLS2Rboot2 coefficient of 3.4 and 6.6 %, respectively, and reducing both Max_Biasbootand RMSEP (Table 2).
Final MAT and WA-PLS2 models showed similar quality predictions (Table 2). The
25
CPD
11, 3759–3798, 2015Development of
coccolithophore-based transfer functions
B. Ausín et al.
Title Page
Abstract Introduction
Conclusions References
Tables Figures
◭ ◮
◭ ◮
Back Close
Full Screen / Esc
Printer-friendly Version Interactive Discussion
Discussion
P
a
per
|
Discussion
P
a
per
|
Discussion
P
a
per
|
Discussion
P
a
per
|
values from both models approach the diagonal of slope one (that indicates perfect pre-dictions) reasonably well (Fig. 4d and e). The residuals for MAT and WA-PLS2 models (Fig. 4f and g) are equally distributed around zero and show no apparent trends.
3.4 SSS reconstruction
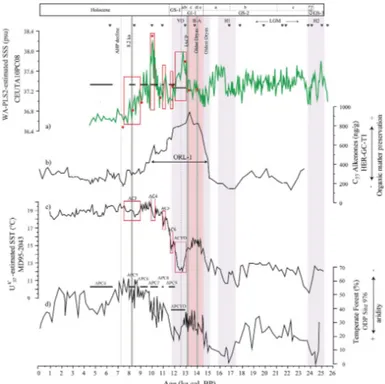
The SSS reconstructions for core CEUTA10PC08 derived from both MAT and
WA-5
PLS2 are very similar (Fig. 5a and b), with same range of SSS values. These only differ during the stadials associated with Heinrich Events 2 and 1 (H2 and H1), when the WA-PLS2-estimated SSS shows more pronounced salinity decreases.
The SSS reconstructions obtained from core CEUTA10PC08 (Fig. 5a) can be divided into three intervals: (i) the period from 25.5 to 15.5 ka is characterized by higher values,
10
ranging between 37.8 and 37 psu. Lower values are found from 20 to 18 ka followed by a drop of 0.8 psu at 17.3 ka, (ii) the period from 15.5 to 9 ka shows fast changes and large oscillations. An abrupt decrease from 37.9 to 36.9 psu is recognized at 15 ka, followed by large peaks of high values at 12.8, 11.1, and 10.2 ka; and (iii) the period from 9 to 4.5 ka records the lowest values, ranging between 37 and 36.5 psu and shows
15
a general decreasing trend.
The errors associated with both SSS reconstruction are of a similar magnitude for the last 25 kyr (Fig. 5a). Squared chord distances between fossil and modern assemblages (Fig. 5b) revealed that many samples from 25.5 to 16 ka were above the 10th percentile. The comparison between PC1fossil and the SSS reconstruction is shown in Fig. 5c,
20
showing general good agreement, especially for the last 16 kyr.
4 Discussion
4.1 Geographic coccolithophore distribution and SSS
E. huxleyi (<4 µm) and small Gephyrocapsa (<3 µm) are very abundant (83 % on
average) and widespread in the Western Mediterranean (Fig. 2a and b) as
CPD
11, 3759–3798, 2015Development of
coccolithophore-based transfer functions
B. Ausín et al.
Title Page
Abstract Introduction
Conclusions References
Tables Figures
◭ ◮
◭ ◮
Back Close
Full Screen / Esc
Printer-friendly Version Interactive Discussion
Discussion
P
a
per
|
Discussion
P
a
per
|
Discussion
P
a
per
|
Discussion
P
a
per
|
ously reported for surface sediment samples in the Western Mediterranean by Álvarez et al. (2010). These taxa, especiallyE. huxleyi(<4 µm), are cosmopolitan and tolerate wide ranges of temperature and salinity (Winter et al., 1994). The higher relative abun-dance ofG. caribbeanica, F. profundaandG. oceanicain the Atlantic and the Mediter-ranean waters near the Strait of Gibraltar (Fig. 2c, d and h) suggests their preference
5
for fresher waters. This notion is also indicated by the CCA (Fig. 3b), where these species are located on the right part of the salinity gradient.C. leptoporus(Fig. 2e) and
Helicosphaeraspp. (Fig. 2f) show higher abundances in the Balearic Sea and a similar
spatial distribution. Nevertheless, the CCA (Fig. 3b) suggests thatHelicosphaeraspp. have preferernce for more saline waters than C. leptoporus. This discrepancy might
10
be related to the patchy spatial distribution of these species, possibly linked to the in-fluence of common mesoscale structures in this area such as eddies or geostrophic fronts (Fig. 1a).
Salinity was highly correlated with CO23− and pH (Fig. 3a and b). Carbonate chem-istry has already been found to be related to coccolith mass (Beaufort et al., 2011).
15
Nevertheless, multivariate analyses revealed that salinity is significant and the most important variable of those studied in explaining coccolithophore data variance in this modern training set. Oviedo et al. (2015) have recently studied coccolithophore dis-tribution from water column samples and in situ environmental measurement in the Mediterranean Sea. This study concluded that CO23−, pH and salinity are the most
im-20
portant factors in explaining coccolithophore data in the study area, which is in agreet-ment with our study. However, the individual importance and proportion of variance explained by each of these significant variables was not assessed in that study. De-spite of this, the authors discarded salinity as a final explanatory variable arguing that
E. huxleyiinhabits at a wide salinity range, suggesting a negligible ecological effect of
25
CPD
11, 3759–3798, 2015Development of
coccolithophore-based transfer functions
B. Ausín et al.
Title Page
Abstract Introduction
Conclusions References
Tables Figures
◭ ◮
◭ ◮
Back Close
Full Screen / Esc
Printer-friendly Version Interactive Discussion
Discussion
P
a
per
|
Discussion
P
a
per
|
Discussion
P
a
per
|
Discussion
P
a
per
|
et al., 1998; Paasche et al., 1996; Schouten et al., 2006), in both culture experiments and marine surface sediment samples. Nevertheless, findings by Oviedo et al. (2015) point toward the same direction of variability of coccolithophore assemblages in the Mediterranean Sea controlled by salinity and/or related variables. It is worth to mention that salinity influences solubility of CO23− through several paths: the solubility of free
5
carbon dioxide in water, the solubility product constants, the concentration of the ion hydrogen, and the quantity of calcium in the water (Trask, 1936). Based on this strong relationship, salinity could be influencing coccolithophore distribution through coccolith calcification processes. In contrast, Bollmann and Herrle (2009) have proposed an al-ternative hypothesis, suggesting that salinity influences coccolithophores through cell
10
turgor regulation linked to osmotic processes.
Although there is no clear consensus about the mechanism through which salinity in-fluence coccolithophore associations, many other studies point to a strong link between this variable and coccolithophore species. In the Japan Sea, salinity has been proposed to have an ecological or physiological influence on the production of alkenone and
15
alkenoates, which are organic compounds mainly produced byEmilianiaand
Gephyro-capsagenus (Fujine et al., 2006). In the Baltic Sea, alkenone unsaturation ratios have
been found to be significantly correlated with salinity (Blanz et al., 2005). In the Mediter-ranean Sea, Knappertsbusch (1993) studied the distribution of extant coccolithophore species in relation to in situ temperature and salinity data. A good correspondence was
20
only found between coccolithophore species and the environmental parameters under study, indicating thatG. oceanicawas linearly correlated with salinity. Moreover, salin-ity has proven to be important to other marine unicellular planktonic groups such as diatoms (Fritz et al., 1991; Jiang et al., 2014; Li et al., 2012) and dinoflagellate cysts (Jansson et al., 2014, and references therein), reinforcing the hyposthesis of salinity as
25
CPD
11, 3759–3798, 2015Development of
coccolithophore-based transfer functions
B. Ausín et al.
Title Page
Abstract Introduction
Conclusions References
Tables Figures
◭ ◮
◭ ◮
Back Close
Full Screen / Esc
Printer-friendly Version Interactive Discussion
Discussion
P
a
per
|
Discussion
P
a
per
|
Discussion
P
a
per
|
Discussion
P
a
per
|
4.2 Transfer function quality
A general good fit can be deduced for both models, although MAT was seen to perform slightly better from a higherRboot2 and a lower RMSEP (Table 2) and plotted predicted values compared with observed values (Fig. 4). The intermediate values of the salinity gradient are less well represented than the more extreme values (Fig. 4d and e).
Un-5
evenness can bias the RMSEP leading to overestimation of the predictive power of the model (Telford and Birks, 2011).While an even distribution would be always desirable, unevenness is a feature inherent to most training sets from oceanic environments. In this case, it is not severe and the observations, although unevenly distributed along the salinity gradient, do not leave gaps. The distribution of the residuals (Fig. 4f and g)
10
indicates the adequacy of the model.
4.3 Downcore SSS reconstruction
The derived MAT and WA-PLS2 SSS reconstructions (Fig. 5a) are very similar. Nev-ertheless, WA-PLS2 shows more marked salinity decreases than MAT during the H2 (25.2–23.7 ka) and H1 (17.4–15.9 ka). Unlike WA-PLS, MAT does not consider the
en-15
tire dataset when calculating the species optima, only the most taxonomically similar analogs, being more sensitive to local conditions (Telford and Birks, 2009). Fossil sam-ples lack good analogs for the H2 and H1, coinciding with large peaks ofE. huxleyi (>4 µm) (Fig. 5b). H2 and H1 have been linked to the entry of fresher water originating from the North Atlantic ice melting in the Western Mediterranean Sea (Cacho et al.,
20
1999; Melki, 2011; Sierro et al., 2005), suggesting a link between the high abundances
ofE. huxleyi (>4 µm) and lower salinities in the past. By contrast, Bollmann and
Her-rle (2007) reported a significant current correlation between E. huxleyi (>4 µm) and higher salinities from the study of globally distributed core-top samples. These authors used this relationship to estimate salinity values during the LGM. Interestingly, they
25
CPD
11, 3759–3798, 2015Development of
coccolithophore-based transfer functions
B. Ausín et al.
Title Page
Abstract Introduction
Conclusions References
Tables Figures
◭ ◮
◭ ◮
Back Close
Full Screen / Esc
Printer-friendly Version Interactive Discussion
Discussion
P
a
per
|
Discussion
P
a
per
|
Discussion
P
a
per
|
Discussion
P
a
per
|
suggest that high percentages/presence ofE. huxleyi(>4 µm) in the fossil record lacks modern analogs, as indicated by the high dissimilarity between fossil samples with high percentages of this species and modern samples (Fig. 5b).
Owing to MAT is strongly dependent upon on the analogs selected (Telford and Birks, 2009) and WA-PLS2 reconstruction for H2 and H1 is more coherent with a
freshwa-5
ter inflow scenario, it seems WA-PLS2 affords more reliable values than MAT. Conse-quently, WA-PLS2-estimated SSS is chosen for final interpretations.
Transfer functions assume that the ecological response of organisms to either the environmental variable of interest or to the linear combination of this important variable with others has not changed significantly over the time span represented by the fossil
10
assemblage (Birks, 1995). The good agreement observed between PC1fossil and re-constructed SSS patterns from 16 ka onwards (Fig. 5c) suggests that the SSS transfer function fulfills this assumption back to 16 ka. Larger differences are observed from 25 to 16 ka, possibly promoted by the situation of the absence of analogs during this period discussed above.
15
4.4 SSS changes in the Alboran Sea over the last 15.5 kyr
The SSS reconstruction (Fig. 6a) might involve additional uncertainty during part of the LGM (from 25 to 18 ka), H2 and H1 derived from the lack of analogs. Consequently, the SSS reconstruction for that time span will not be discussed here.
4.4.1 Oldest Dryas
20
An abrupt decrease in salinity of 0.8 psu occurred at 15.5 ka. This change is not sup-ported by the findings of Fletcher and Sánchez Goñi (2008) or those of Combourieu Nebout et al. (2009) who, using pollen records from two sites in the Western Mediter-ranean, identified arid conditions in the southern Iberian Peninsula. The global sea-level rise of ∼20 m during meltwater pulse 1A (mwp-1A) has been dated at 14.6 ka
25
CPD
11, 3759–3798, 2015Development of
coccolithophore-based transfer functions
B. Ausín et al.
Title Page
Abstract Introduction
Conclusions References
Tables Figures
◭ ◮
◭ ◮
Back Close
Full Screen / Esc
Printer-friendly Version Interactive Discussion
Discussion
P
a
per
|
Discussion
P
a
per
|
Discussion
P
a
per
|
Discussion
P
a
per
|
Allerød. Since this section covers 3000 yr with no control point (Fig. 6a), it could be an artifact of poorly constrained chronology for this time interval. Nevertheless, this seems unlikely since other authors (Duplessy et al., 1992; Emeis et al., 2000; Kallel et al., 1997) have reported similar abrupt SSS decreases in different regions of the Mediterranean Sea and the Atlantic Ocean at this time.
5
In particular, Duplessy et al. (1992) observed a SSS decrease of about 2.5 psu in the Atlantic Ocean west of the Strait of Gibraltar during the Oldest Dryas in northwestern Europe and related it to the meltwater release from the Barents and the Fennoscandi-navian ice sheets. These authors also argued that such minor injections of freshwater would have been insufficient to trigger the observed drop in salinity, and proposed an
10
additional feedback from changes in the hydrological cycle and water advection to pro-mote changes in the thermohaline circulation and the observed changes in SSS.
4.4.2 Bølling–Allerød (B–A)
The SSS values are generally low for the B–A, the Bølling being fresher than the Allerød, both separated by the Older-Dryas (GI-1d) interval (Fig. 6a). Owing to the
15
global sea-level rise during the B–A, and specifically during the mwp-1A between 13.5 and 14.1 ka, a greater volume of AW would have entered through the Strait, decreasing the average SSS. In addition, wetter conditions would have contributed to this freshen-ing. Enhanced rainfall and increased river discharge have already been inferred from diatom assemblages, sediment grain-size, pollen records, elemental ratios and
coccol-20
ithophore records in the Western Mediterranean during the B–A (Ausín et al., 2015; Bárcena et al., 2001; Combourieu Nebout et al., 2009; Frigola et al., 2008; Martínez-Ruiz et al., 2015; Rodrigo-Gámiz et al., 2011). This period of reduced salinity also coincides with the highest values of total concentration of C37alkenones, a proxy of or-ganic matter preservation (Cacho et al., 2002), from a nearby core located offthe coast
25
or-CPD
11, 3759–3798, 2015Development of
coccolithophore-based transfer functions
B. Ausín et al.
Title Page
Abstract Introduction
Conclusions References
Tables Figures
◭ ◮
◭ ◮
Back Close
Full Screen / Esc
Printer-friendly Version Interactive Discussion
Discussion
P
a
per
|
Discussion
P
a
per
|
Discussion
P
a
per
|
Discussion
P
a
per
|
ganic matter, although its origin is still under debate (Rogerson et al., 2008). Values below 37.25 psu match with an increasing trend in organic matter preservation. The joint effect of a salinity reduction of 0.8 psu and a temperature increase of 3◦C (Cacho et al., 2001) would have led to a significant reduction in sea surface density, possibly prompting stagnation of the upper water column. Moreover, Ausín et al. (2015)
ob-5
served a rise in primary productivity during this interval in the Alboran Sea from fossil coccolithophore assemblages. Frigola et al. (2008) and Martínez-Ruiz et al. (2015) identified a reduction in deep water formation in the Gulf of Lion using sediment-grain size analyses and elemental ratios, respectively. Increased organic matter export to the seabed, along with reduced deep-basin ventilation, would have hampered organic
10
matter mineralization, reinforcing the formation of the ORL. Rogerson et al. (2008) have used model simulations to explore the mechanisms driving ORL formation. These au-thors concluded that a strong reduction in seawater density, which agrees with the decrease in reconstructed SSS from core CEUTA10PC08, in conjunction with a rise of the interface between deep and intermediate waters, would be the most likely
explana-15
tion for the origin of the Alboran ORL.
The brief Intra-Alleröd Cold Period (IACP) (G1-1b) (Lehman and Keigmin, 1992) put an end to the low salinity values of the B–A. The SSS increasing trend is in agreement with the enhanced continental aridity reported for elemental ratios from a nearby core for this brief time span (Rodrigo-Gámiz et al., 2011).
20
4.4.3 Younger Dryas (YD) and the Holocene
The YD displays a shift from higher to lower SSS values, decreasing by 0.6 psu in total along its two phases (YDa and YDb). This is in keeping with a transition from arid to hu-mid conditions observed in paleoclimate records from the Western and Central Mediter-ranean Sea (Cacho et al., 2001; Combourieu Nebout et al., 2009; Rodrigo-Gámiz et al.,
25
CPD
11, 3759–3798, 2015Development of
coccolithophore-based transfer functions
B. Ausín et al.
Title Page
Abstract Introduction
Conclusions References
Tables Figures
◭ ◮
◭ ◮
Back Close
Full Screen / Esc
Printer-friendly Version Interactive Discussion
Discussion
P
a
per
|
Discussion
P
a
per
|
Discussion
P
a
per
|
Discussion
P
a
per
|
values), with a period of continuous SST increasing trend (Cacho et al., 2001) (Fig. 6c) and the rise in the post-glacial sea level (Fairbanks, 1989). However, fast SSS oscil-lations point to an intermittent influence of the forcing mechanisms. SSS changes in the Western Mediterranean can be driven by atmospheric and/or oceanic processes. With regard to atmospheric conditions, pollen data from the Western Mediterranean
5
(Combourieu Nebout et al., 2009; Dormoy et al., 2009; Fletcher et al., 2010) reveal the occurrence of periods of greater dryness, but they do not coincide exactly with SSS increases (Fig. 6a and d), as would be expected from reduced rainfall and decreased river discharge. Regarding oceanic processes, variations in the salinity and flux of the incoming AW are able to drive salinity changes in the study area (Bèthoux, 1979).
Ow-10
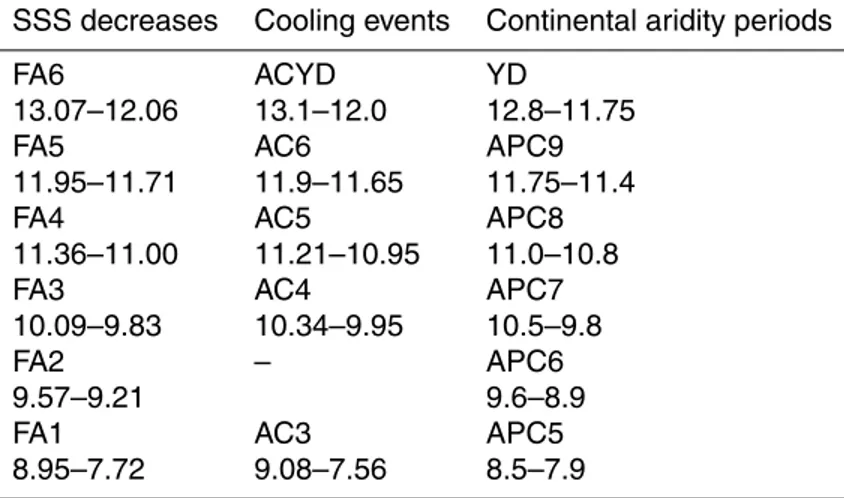
ing to its proximity to the Strait, core CEUTA10PC08 is expected to be a sensitive record to salinity changes in the past driven by AW influxes. Thus, periods of less saline AW influx should be recognizable in the SSS reconstruction. Six brief periods of a SSS de-creasing trend were identified at 13.07–12.06, 11.95–11.71, 11.36–11.00, 10.09–9.83, 9.57–9.21, and 8.95–7.72 ka (Fig. 6a). Except for the period at 9.57–9.21 ka, all of them
15
are accurately simultaneous to the brief Alboran cooling (AC) events (Table 3, Fig. 6c) that have been linked to North Atlantic influxes of cold atlantic waters in the Alboran Sea (Cacho et al., 2001). The synchronicity of the SST coolings and SSS freshenings suggests a common origin. AC events have been correlated with those of declining for-est (named APC) deduced from pollen analyses by Combourieu Nebout et al. (2009)
20
(Table 3, Fig. 6a and d), suggesting increased aridity inland at times of freshwater ad-vection events (FA; Table 3). The APC6 dry period from 9.6 to 8.9 ka does not match any AC event, but coincides with FA2 (Table 3), demonstrating the common nature of these short-term oscillations.
The last freshening episode (FA1; 8.95–7.72 ka) includes the 8.2 ka event (Alley
25
sta-CPD
11, 3759–3798, 2015Development of
coccolithophore-based transfer functions
B. Ausín et al.
Title Page
Abstract Introduction
Conclusions References
Tables Figures
◭ ◮
◭ ◮
Back Close
Full Screen / Esc
Printer-friendly Version Interactive Discussion
Discussion
P
a
per
|
Discussion
P
a
per
|
Discussion
P
a
per
|
Discussion
P
a
per
|
lagmite from the Corchia cave (central Italy). These authors found no evidence of the 8.2 ka event in relation to SSS. Similarly, we interpret that the 8.2 ka event would have had a negligible effect on surface salinity in the Alboran Sea. The aforementioned FA1 ends at 7.4 ka, when the lowest values SSS are recorded. At this time, the sea level in the Alboran Sea reached maximum high-stand conditions (Zazo et al., 2008).
More-5
over, the African Humid Period (AHP; 11–5.5 ka) affected the study area, especially up to 7.4 ka, when it started to decline (deMenocal et al., 2000; Renssen et al., 2003; Ritchie et al., 1985). The joint action of these processes certainly resulted in a de-crease of SSS at 7.4 ka. From 7.4 to 4.5 ka, salinity values level offaround 36.6 psu, close to present SSS values in the Alboran Sea.
10
5 Conclusions
Multivariate statistical analyses show that coccolithophore distribution of modern coc-colithophore assemblages in the Atlantic Ocean, west of the Strait of Gibraltar, and the Western Mediterranean was mainly influenced by annual mean salinity at 10 m depth. MAT and WA-PLS2 calibration models show similar outcomes. These models
15
were applied to coccolithophore assemblages from a fossil core to reconstruct SSS at high resolution for the last 25 kyr in the Alboran Sea. Statistical analyses reveal assem-blages lacking good modern analogs in relation to the speciesE. huxleyi>4 µm during H2 and H1 and part of the LGM, preventing further interpretations for these periods. A low SSS was found for the B–A, possibly due to the post-glacial sea-level rise and
20
regionally wetter conditions in the adjacent continental areas. The consequent reduc-tion in sea surface density is suggested to have triggered the formareduc-tion of the ORL in the Alboran Sea. During the YD and Holocene, six brief, abrupt SSS decreases at 13.1–12.0, 11.9–11.7, 11.4–11.0, 10.1–9.8, 9.6–9.2, and 9.0–7.7 ka were linked to the advection of fresher and colder AW related to meltwater pulses in the North Atlantic and
25
CPD
11, 3759–3798, 2015Development of
coccolithophore-based transfer functions
B. Ausín et al.
Title Page
Abstract Introduction
Conclusions References
Tables Figures
◭ ◮
◭ ◮
Back Close
Full Screen / Esc
Printer-friendly Version Interactive Discussion
Discussion
P
a
per
|
Discussion
P
a
per
|
Discussion
P
a
per
|
Discussion
P
a
per
|
Alboran Sea and the onset of the decline of the African Humid Period. SSS remained low from 7.4 to 4.5 ka, close to its present values.
A broader understanding of the ecological link between coccolithophore species and environmental parameters would be desirable in order to be able to place coccolithophore-based transfer functions within the ecological context in future works.
5
Nevertheless, the diverse statistical tests performed in this study and the strong em-phasis placed on assessing the validity and reliability of both the model and the recon-struction do reveal the potential of coccolithophores for developing transfer functions. The derived transfer function provides a potential independent proxy for quantitative reconstructions of SSS changes in other locations of the Western Mediterranean Sea
10
over the last 15.5 kyr.
The Supplement related to this article is available online at doi:10.5194/cpd-11-3759-2015-supplement.
Acknowledgements. B. Ausín is sincerely grateful to the Core Repository of the Institute of
Marines Sciences- CSIC at Barcelona and the University of Vigo for the core-top samples
sup-15
ply. This study was supported by the FPU grant AP2010-2559 of the Ministry of Education of Spain given to B. Ausín and by the Consolider Ingenio “GRACCIE” program CSD 2007-00067, the program SA263U14 of Junta de Castilla y León, and the programs: CGL2011-26493, VA-CLIODP339, CTM2008-06399-C04/MAR, CTM 2012-39599-C03-02/03 and MOWER (CTM 2012-39599-CO3-02/03) of the Spanish Ministry of Economy and Competitiveness.
20
References
Álvarez, M. C., Amore, F. O., Cros, L., Alonso, B., and Alcántara-Carrió, J.: Coccolithophore biogeography in the Mediterranean Iberian margin, Revista Española de Micropaleontología, 42, 359–372, 2010.
Alley, R. B., Mayewski, P. A., Sowers, T., Stuiver, M., Taylor, K. C., and Clark, P. U.: Holocene
25
CPD
11, 3759–3798, 2015Development of
coccolithophore-based transfer functions
B. Ausín et al.
Title Page
Abstract Introduction
Conclusions References
Tables Figures
◭ ◮
◭ ◮
Back Close
Full Screen / Esc
Printer-friendly Version Interactive Discussion
Discussion
P
a
per
|
Discussion
P
a
per
|
Discussion
P
a
per
|
Discussion
P
a
per
|
Ausín, B., Flores, J. A., Bácena, M. A., Sierro, F. J., Francés, G., Gutiérrez-Arnillas, E., Hernández-Almeida, I., Martrat, B., Grimalt, J. O., and Cacho, I.: Coccolithophore produc-tivity and surface water dynamics in the Alboran Sea during the last 25 kyr, Palaeogeogr. Palaeocl., 418, 126–140, 2015.
Bárcena, M. A., Cacho, I., Abrantes, F., Sierro, F. J., Grimalt, J. O., and Flores, J. A.:
Paleopro-5
ductivity variations related to climatic conditions in the Alboran Sea (western Mediterranean) during the last glacial–interglacial transition: the diatom record, Palaeogeogr. Palaeocl., 167, 337–357, 2001.
Bard, E., Hamelin, B., Arnold, M., Montaggioni, L., Cabioch, G., Faure, G., and Rougerie, F.: Deglacial sea-level record from Tahiti corals and the timing of global meltwater discharge,
10
Nature, 382, 241–244, 1996.
Baumann, K. H., Andruleit, H., Boeckel, B., Geisen, M., and Kinkel, H.: The significance of extant coccolithophores as indicators of ocean water masses, surface water temperature, and palaeoproductivity: a review, Palaeont. Z., 79, 93–112, 2005.
Beaufort, L., Lancelot, Y., Camberlin, P., Cayre, O., Vincent, E., Bassinot, F., and Labeyrie, L.:
15
Insolation cycles as a major control of equatorial Indian Ocean primary production, Science, 278, 1451–1454, 1997.
Beaufort, L., de Garidel-Thoron, T., Mix, A. C., and Pisias, N. G.: ENSO-like forcing on oceanic primary production during the Late Pleistocene, Science, 293, 2440–2444, 2001.
Beaufort, L., Probert, I., de Garidel-Thoron, T., Bendif, E. M., Ruiz-Pino, D., Metzl, N., Goyet, C.,
20
Buchet, N., Coupel, P., Grelaud, M., Rost, B., Rickaby, R. E. M., and de Vargas, C.: Sensitivity of coccolithophores to carbonate chemistry and ocean acidification, Nature, 476, 80–83, 2011.
Bèthoux, J. P.: Budgets of the Mediterranean Sea. Their dependance on the local climate and on the characteristics of the Atlantic waters, Oceanol. Acta, 2, 157–163, 1979.
25
Birks, H. J. B.: Quantitative palaeoenvironmental reconstructions, in: Statistical Modelling of Quaternary Science Data, technical guide 5, edited by: Maddy, D. and Brew, J. S., Quater-nary Research Association, Cambridge, 271 pp., 1995.
Blanz, T., Emeis, K.-C., and Siegel, H.: Controls on alkenone unsaturation ratios along the salinity gradient between the open ocean and the Baltic Sea, Geochim. Cosmochim. Ac., 69,
30
3589–3600, 2005.
CPD
11, 3759–3798, 2015Development of
coccolithophore-based transfer functions
B. Ausín et al.
Title Page
Abstract Introduction
Conclusions References
Tables Figures
◭ ◮
◭ ◮
Back Close
Full Screen / Esc
Printer-friendly Version Interactive Discussion
Discussion
P
a
per
|
Discussion
P
a
per
|
Discussion
P
a
per
|
Discussion
P
a
per
|
Bollmann, J., Herrle, J. O., Cortés, M. Y., and Fielding, S. R.: The effect of sea water salinity on the morphology ofEmiliania huxleyiin plankton and sediment samples, Earth Planet. Sc. Lett., 284, 320–328, 2009.
Boyer, T. P., Antonov, J. I., Baranova, O. K., Coleman, C., Garcia, H. E., Grodsky, A., John-son, D. R., Locarnini, R. A., Mishonov, A. V., O’Brien, T. D., Paver, C. R., Reagan, J. R.,
5
Seidov, D., Smolyar, I. V., and Zweng, M. M.: World ocean database 2013, in: NOAA Atlas NESDIS 72, edited by: Levitus, S. and Mishonov, A., Silver Spring, MD, 209, 2013.
Cacho, I., Grimalt, J. O., Pelejero, C., Canals, M., Sierro, F. J., Flores, J. A., and Shackleton, N.: Dansgaard–Oeschger and Heinrich Event imprints in Alboran Sea paleotemperatures, Pale-oceanography, 14, 698–705, 1999.
10
Cacho, I., Grimalt, J. O., Canals, M., Sbaffi, L., Shackleton, N. J., Schönfeld, J., and Zahn, R.: Variability of the western Mediterranean Sea surface temperature during the last 25 000 years and its connection with the Northern Hemisphere climatic changes, Paleo-ceanography, 16, 40–52, 2001.
Cacho, I., Grimalt, J. O., and Canals, M.: Response of the Western Mediterranean Sea to rapid
15
climatic variability during the last 50 000 years: a molecular biomarker approach, J. Marine Syst., 33–34, 253–272, 2002.
Combourieu Nebout, N., Peyron, O., Dormoy, I., Desprat, S., Beaudouin, C., Kotthoff, U., and Marret, F.: Rapid climatic variability in the west Mediterranean during the last 25 000 years from high resolution pollen data, Clim. Past, 5, 503–521, doi:10.5194/cp-5-503-2009, 2009.
20
Cros, L. and Fortuño, J.-M.: Atlas of northwestern Mediterranean coccolithophores, Sci. Mar., 66, 7–182, 2002.
deMenocal, P., Ortiz, J., Guilderson, T., Adkins, J., Sarnthein, M., Baker, L., and Yarusinsky, M.: Abrupt onset and termination of the African Humid Period: rapid climate responses to gradual insolation forcing, Quaternary Sci. Rev., 19, 347–361, 2000.
25
Dormoy, I., Peyron, O., Combourieu Nebout, N., Goring, S., Kotthoff, U., Magny, M., and Pross, J.: Terrestrial climate variability and seasonality changes in the Mediterranean re-gion between 15 000 and 4000 years BP deduced from marine pollen records, Clim. Past, 5, 615–632, doi:10.5194/cp-5-615-2009, 2009.
Duplessy, J. C., Labeyrie, L., Arnold, M., Paterne, M., Duprat, J., and van Weering, T. C. E.:
30
CPD
11, 3759–3798, 2015Development of
coccolithophore-based transfer functions
B. Ausín et al.
Title Page
Abstract Introduction
Conclusions References
Tables Figures
◭ ◮
◭ ◮
Back Close
Full Screen / Esc
Printer-friendly Version Interactive Discussion
Discussion
P
a
per
|
Discussion
P
a
per
|
Discussion
P
a
per
|
Discussion
P
a
per
|
Edwards, R. J., van de Plassche, O., Gehrels, W. R., and Wright, A. J.: Assessing sea-level data from Connecticut, USA, using a foraminiferal transfer function for tide level, Mar. Mi-cropaleontol., 51, 239–255, 2004.
Emeis, K.-C., Struck, U., Schulz, H.-M., Rosenberg, R., Bernasconi, S., Erlenkeuser, H., Sakamoto, T., and Martinez-Ruiz, F.: Temperature and salinity variations of Mediterranean
5
Sea surface waters over the last 16 000 years from records of planktonic stable oxygen iso-topes and alkenone unsaturation ratios, Palaeogeogr. Palaeocl., 158, 259–280, 2000. Fairbanks, R. G.: A 17 000 year glacio-eustatic sea level record; influence of glacial melting
rates on the Younger Dryas event and deep-ocean circulation, Nature, 342, 637–642, 1989. Fielding, S. R., Herrle, J. O., Bollmann, J., Worden, R. H., and Montagnesd, D. J. S.: Assessing
10
the applicability of Emiliania huxleyicoccolith morphology as a sea-surface salinity proxy, Limnol. Oceanogr., 54, 1475–1480, 2009.
Fletcher, W. J. and Sánchez Goñi, M. F.: Orbital- and sub-orbital-scale climate impacts on vegetation of the western Mediterranean basin over the last 48 000 yr, Quaternary Res., 70, 451–464, 2008.
15
Fletcher, W. J., Sanchez Goñi, M. F., Peyron, O., and Dormoy, I.: Abrupt climate changes of the last deglaciation detected in a Western Mediterranean forest record, Clim. Past, 6, 245–264, doi:10.5194/cp-6-245-2010, 2010.
Flores, J. A. and Sierro, F. J.: Revised technique for calculation of calcareous nannofossil ac-cumulation rates, Micropaleontology, 43, 321–324, 1997.
20
Flores, J. A., Sierro, F. J., Francés, G., Vázquez, A., and Zamarreño, I.: The last 100 000 years in the western Mediterranean: sea surface water and frontal dynamics as revealed by coc-colithophores, Mar. Micropaleontol., 29, 351–366, 1997.
Frigola, J., Moreno, A., Cacho, I., Canals, M., Sierro, F. J., Flores, J. A., and Grimalt, J. O.: Evidence of abrupt changes in Western Mediterranean deep water circulation during the last
25
50 kyr: a high-resolution marine record from the Balearic Sea, Quatern. Int., 181, 88–104, 2008.
Fritz, S. C., Juggins, S., Battarbee, R. W., and Engstrom, D. R.: Reconstruction of past changes in salinity and climate using a diatom-based transfer function, Nature, 352, 706–708, 1991. Fujine, K., Yamamoto, M., Tada, R., and Kido, Y.: A salinity-related occurrence of a novel
30
CPD
11, 3759–3798, 2015Development of
coccolithophore-based transfer functions
B. Ausín et al.
Title Page
Abstract Introduction
Conclusions References
Tables Figures
◭ ◮
◭ ◮
Back Close
Full Screen / Esc
Printer-friendly Version Interactive Discussion
Discussion
P
a
per
|
Discussion
P
a
per
|
Discussion
P
a
per
|
Discussion
P
a
per
|
García, H. E., Locarnini, R. A., Boyer, T. P., Antonov, J. I., Baranova, O. K., Zweng, M. M., Reagan, J. R., and Johnson, D. R.: World ocean atlas 2013, volume 3: dissolved oxygen, apparent oxygen utilization, and oxygen saturation, in: NOAA Atlas NESDIS 75, edited by: Levitus, S. and Mishonov, A., 27 pp., 2014a.
García, H. E., Locarnini, R. A., Boyer, T. P., Antonov, J. I., Baranova, O. K., Zweng, M. M.,
5
Reagan, J. R., and Johnson, D. R.: World ocean atlas 2013, volume 4: dissolved inorganic nutrients (phosphate, nitrate, silicate), in: NOAA Atlas NESDIS 76, edited by: Levitus, S. and Mishonov, A., 25 pp., 2014b.
Giraudeau, J. and Rogers, J.: Phytoplankton biomass and sea-surface temperature estimates from sea-bed distribution of nannofossils and planktonic foraminifera in the Benguela
up-10
welling system, Micropaleontology, 40, 275–285, 1994.
Goyet, C., Healy, R. J., and Ryan, P. D.: Global Distribution of Total Inorganic Carbon and Total Alkalinity Below the Deepest Winter Mixed Layer Depths, ORNL/CDIAC-127, NDP-076, Carbon Dioxide Information Analysis Center, Oak Ridge National Laboratory, US Department of Energy, Oak Ridge, TN, 2000.
15
Green, J. C., Heimdal, B. R., Paasche, E., and Moate, R.: Changes in calcification and the dimensions of coccoliths ofEmiliania huxleyi(Haptophyta) grown at reduced salinities, Phy-cologia, 37, 121–131, 1998.
Guerreiro, C., Oliveira, A., de Stigter, H., Cachão, M., Sá C, Borges, C., Cros, L., Santos, A., Fortuño, J.-M., and Rodrigues, A.: Late winter coccolithophore bloom offcentral Portugal in
20
response to river discharge and upwelling, Cont. Shelf. Res., 59, 65–83, 2013.
Guerreiro, C., Sá C, de Stigter, H., Oliveira, A., Cachão, M., Cros, L., Borges, C., Quaresma, L., Santos, A. I., Fortuño, J.-M., and Rodrigues, A.: Influence of the Nazaré Canyon, central Portuguese margin, on late winter coccolithophore assemblages, Deep-Sea Res. Pt. II, 104, 335–358, 2014.
25
Incarbona, A., Martrat, B., Di Stefano, E., Grimalt, J. O., Pelosi, N., Patti, B., and Tranchida, G.: Primary productivity variability on the Atlantic Iberian Margin over the last 70 000 years: evi-dence from coccolithophores and fossil organic compounds, Paleoceanography, 25, PA2218, doi:10.1029/2008PA001709, 2010.
Jansson, I.-M., Mertens, K. N., Head, M. J., de Vernal, A., Londeix, L., Marret, F.,
30
sur-CPD
11, 3759–3798, 2015Development of
coccolithophore-based transfer functions
B. Ausín et al.
Title Page
Abstract Introduction
Conclusions References
Tables Figures
◭ ◮
◭ ◮
Back Close
Full Screen / Esc
Printer-friendly Version Interactive Discussion
Discussion
P
a
per
|
Discussion
P
a
per
|
Discussion
P
a
per
|
Discussion
P
a
per
|
face sediments of the North Atlantic Ocean, Mediterranean–Marmara–Black Sea region, and Baltic–Kattegat–Skagerrak estuarine system, Palaeogeogr. Palaeocl., 399, 202–213, 2014. Jiang, H., Knudsen, M. F., Seidenkrantz, M.-S., Zhao, M., Sha, L., and Ran, L.:
Diatom-based reconstruction of summer sea-surface salinity in the South China Sea over the last 15 000 years, Boreas, 43, 208–219, 2014.
5
Juggins, S.: C2 Version 1.5 Software for Ecological and Palaeoecological Data Analysis and Visualisation, Newcastle University„ Newcastle upon Tyne, UK, available at: http://www.staff. ncl.ac.uk/stephen.juggins/software/C2Home.htm (last access: 7 July 2015), 2007.
Juggins, S.: Quantitative reconstructions in palaeolimnology: new paradigm or sick science?, Quaternary Sci. Rev., 64, 20–32, 2013.
10
Kallel, N., Paterne, M., Labeyrie, L., Duplessy, J.-C., and Arnold, M.: Temperature and salinity records of the Tyrrhenian Sea during the last 18 000 years, Palaeogeogr. Palaeocl., 135, 97– 108, 1997.
Knappertsbusch, M.: Geographic distribution of living and Holocene coccolithophores in the Mediterranean Sea, Mar. Micropaleontol., 21, 219–247, 1993.
15
Lehman, S. J. and Keigmin, L. D.: Sudden changes in Norht Atlantic circulation during the last glaciation, Nature, 356, 757–762, 1992.
Li, D., Knudsen, M. F., Jiang, H., Olsen, J., Zhao, M., Li, T., Knudsen, K. L., Seidenkrantz, M.-S., and Sha, L.: A diatom-based reconstruction of summer sea-surface salinity in the Southern Okinawa Trough, East China Sea, over the last millennium, J. Quaternary Sci., 27, 771–779,
20
2012.
Locarnini, R., Mishonov, A., Antonov, J., Boyer, T., Garcia, H., Baranova, O., Zweng, M., Paver, C. R., Reagan, J. R., Johnson, D. R., Hamilton, M., and Seidov, D.: World ocean atlas 2013, volume 1: temperature, in: NOAA Atlas NESDIS 73, edited by: Levitus, S. and Mishonov, A., 40 pp., 2013.
25
Martínez-Ruiz, F., Kastner, M., Gallego-Torres, D., Rodrigo-Gámiz, M., Nieto-Moreno, V., and Ortega-Huertas, M.: Paleoclimate and paleoceanography over the past 20 000 yr in the Mediterranean Sea Basins as indicated by sediment elemental proxies, Quaternary Sci. Rev., 107, 25–46, 2015.
MEDOCGROUP: Observation of formation of deep water in the Mediterranean Sea, 1969,
30
Nature, 227, 1037–1040, 1970.