www.atmos-chem-phys.net/15/2825/2015/ doi:10.5194/acp-15-2825-2015
© Author(s) 2015. CC Attribution 3.0 License.
Characterization of primary and secondary wood combustion
products generated under different burner loads
E. A. Bruns1, M. Krapf1, J. Orasche2,3,4, Y. Huang2, R. Zimmermann2,3,4, L. Drinovec5, G. Moˇcnik5, I. El-Haddad1, J. G. Slowik1, J. Dommen1, U. Baltensperger1, and A. S. H. Prévôt1
1Laboratory of Atmospheric Chemistry, Paul Scherrer Institute, 5232 Villigen, Switzerland
2Joint Mass Spectrometry Centre, Cooperation Group “Comprehensive Molecular Analytics”, Helmholtz Zentrum München, 85764 Neuherberg, Germany
3Joint Mass Spectrometry Centre, Institute of Chemistry, Division of Analytical and Technical Chemistry, University of Rostock, 18057 Rostock, Germany
4Helmholtz Virtual Institute of Complex Molecular Systems in Environmental Health–Aerosol and Health (HICE), www.hice-vi.eu
5Aerosol d.o.o, Kamniška 41, 1000 Ljubljana, Slovenia
Correspondence to:A. S. H. Prévôt ([email protected])
Received: 16 September 2014 – Published in Atmos. Chem. Phys. Discuss.: 17 October 2014 Revised: 22 January 2015 – Accepted: 13 February 2015 – Published: 12 March 2015
Abstract. Residential wood burning contributes to the total atmospheric aerosol burden; however, large uncertainties re-main in the magnitude and characteristics of wood burning products. Primary emissions are influenced by a variety of parameters, including appliance type, burner wood load and wood type. In addition to directly emitted particles, previous laboratory studies have shown that oxidation of gas-phase emissions produces compounds with sufficiently low volatil-ity to readily partition to the particles, forming considerable quantities of secondary organic aerosol (SOA). However, rel-atively little is known about wood burning SOA, and the ef-fects of burn parameters on SOA formation and composition are yet to be determined. There is clearly a need for further study of primary and secondary wood combustion aerosols to advance our knowledge of atmospheric aerosols and their impacts on health, air quality and climate.
For the first time, smog chamber experiments were con-ducted to investigate the effects of wood loading on both primary and secondary wood combustion products. Prod-ucts were characterized using a range of particle- and gas-phase instrumentation, including an aerosol mass spectrome-ter (AMS). A novel approach for polycyclic aromatic hydro-carbon (PAH) quantification from AMS data was developed and results were compared to those from GC-MS analysis of filter samples.
Similar total particle mass emission factors were observed under high and average wood loadings; however, high fuel loadings were found to generate significantly higher contri-butions of PAHs to the total organic aerosol (OA) mass com-pared to average loadings. PAHs contributed 15±4 % (mean
1 Introduction
Residential wood combustion is a notable source of atmo-spheric aerosols, particularly in regions with moderate to cold climate, as it is a common heating method. For ex-ample, during the winter, residential wood combustion was found to contribute between 17 and 49 % to submicron or-ganic aerosol mass at various rural and urban sites through-out central Europe (Lanz et al., 2010); between 9 and 64 % to total particulate carbon at six rural sites in Portugal, France, Germany, Austria and Hungary (Gelencsér et al., 2007); an average of∼41 % to organic carbon in Fresno (USA) (Gorin et al., 2006); an average of 79 % to organic carbon in Prague (Czech Republic) (Saarikoski et al., 2008); 13–15 % to pri-mary submicron aerosol and up to 66 % to total submicron aerosol in Paris (France) (Crippa et al., 2013; Petit et al., 2014); 31–83 % to PM1 in northern Sweden (Krecl et al., 2008); and 30–60 % to organic carbon in various European alpine locations (Herich et al., 2014). Globally, it is estimated that approximately 3 billion people burn biomass or coal for residential heating and cooking needs (IPCC, 2007).
Although wood combustion is known to contribute to the global aerosol burden, large uncertainties in aerosol compo-sition and quantification remain. Aerosol characterization is important for ambient source apportionment and for under-standing impacts on health (Naeher et al., 2007; Mauderly and Chow, 2008; Bølling et al., 2009), air quality (Finlayson-Pitts and (Finlayson-Pitts, 2000) and climate (IPCC, 2013). Direct partic-ulate emissions from wood combustion are a complex mix-ture of organic compounds, inorganic compounds, elemental and/or black carbon, and metals (Fine et al., 2001, 2002a, 2004a; Hedberg et al., 2002; Johansson et al., 2004; Schmidl et al., 2008), making characterization difficult. Previous stud-ies have shown that organics often constitute more than 50 % of particulate emissions (Schauer et al., 2001; Fine et al., 2002b; Hedberg et al., 2002; Schmidl et al., 2008; Elsasser et al., 2013), making this an important class of compounds to characterize. However, characterization is complicated by burn variability, both during a single fire and between indi-vidual fires (Weimer et al., 2008; Heringa et al., 2012; El-sasser et al., 2013; Eriksson et al., 2014). Burn parameters, such as wood type, wood loading and appliance type, can also influence emission composition greatly (McDonald et al., 2000; Fine et al., 2002b; Jordan and Seen, 2005; Weimer et al., 2008; Pettersson et al., 2011; Orasche et al., 2012, 2013; Elsasser et al., 2013; Eriksson et al., 2014).
Gases emitted together with primary organic aerosol (POA) can undergo oxidation in the atmosphere to form lower-volatility compounds, which condense to form sec-ondary organic aerosols (SOA) (Kroll and Seinfeld, 2008). However, most previous laboratory studies of residential wood burning have only characterized primary emissions af-ter undergoing varying degrees of cooling and dilution (Mc-Donald et al., 2000; Fine et al., 2001, 2002a, b, 2004a, b; Schauer et al., 2001; Hedberg et al., 2002; Johansson et al.,
2004; Schmidl et al., 2008; Weimer et al., 2008; Orasche et al., 2012, 2013; Elsasser et al., 2013; Eriksson et al., 2014). The few laboratory studies investigating SOA forma-tion from residential wood burning have shown that it can be substantial; aged OA was 1.8–5.3 times that of POA for log wood burners during stable burning conditions (Grieshop et al., 2009a, b; Hennigan et al., 2010; Heringa et al., 2011). Also, phenol, syringol and guaiacol, which have been identi-fied in primary biomass burning emissions, form SOA in lab-oratory studies (Yee et al., 2013). There is evidence of SOA formation from residential wood burning in ambient mea-surements as well (Iinuma et al., 2010; Mohr et al., 2013). For example, methyl-nitrocatechols, reaction products from the oxidation ofm-cresol, present in primary wood smoke, have been measured in significant quantities in rural Ger-many (Iinuma et al., 2010). The extent to which wood com-bustion SOA is included in ambient measurements is un-clear and more work is needed to characterize SOA quan-tities and composition. For example, 59 % of the carbon in semi- and low-volatility oxygenated organic aerosol (largely secondary) measured during winter in Barcelona consists of non-fossil carbon, suggesting this is from sources such as biomass burning and cooking (Mohr et al., 2012). Improved understanding of wood burning SOA is also needed to im-prove modeling results (Simpson et al., 2007).
PAHs are formed during incomplete combustion, emitted during wood burning (McDonald et al., 2000; Schauer et al., 2001; Hedberg et al., 2002; Fine et al., 2004b; Jordan and Seen, 2005; Fitzpatrick et al., 2007; Bari et al., 2011; Pet-tersson et al., 2011; Eriksson et al., 2014), and of particu-lar interest due to their deleterious effects on health (Kim et al., 2013). Functionalized PAHs, such as oxygenated or ni-trogenated compounds, can be emitted directly during burn-ing or can form in the atmosphere from the oxidation of parent PAHs, and these heteroatom derivatives often have higher toxicity than their PAH analogues (Yu, 2002; Fu et al., 2012). Recently, increased PAH emissions were observed under highly loaded burner conditions (Elsasser et al., 2013; Orasche et al., 2013; Eriksson et al., 2014). However, no work has been published on the effect of burner fuel load on SOA.
Here, we present results from the first smog chamber in-vestigation of the impact of wood load on the quantities and composition of primary and secondary residential wood combustion products. Online measurements were made with a high-resolution time-of-flight aerosol mass spectrometer (AMS) and compared to results from offline filter analysis, with a particular focus on PAH emissions and their evolution with aging.
2 Methods
deviations, 2 SD) were conducted in a 27 m3 smog cham-ber (Paulsen et al., 2005) to investigate the effects of wood loading on primary emissions and secondary products. Three of the experiments (1–3, Table 1) were conducted with a starting wood load of 2.21±0.09 kg (three logs without bark, four pieces of kindling and three fire starters com-prised of pine wood shavings, paraffin and natural resin) and three experiments (4–6, Table 1) were conducted with a starting wood load of 7.4±0.2 kg (nine logs without bark, eight pieces of kindling and four fire starters) in the∼0.037 m3burner combustion chamber of a modern log wood burner (Avant, Attika) (Fig. S1 in the Supplement). Hereafter, these two cases are referred to as “average load” and “high load”, respectively. Prior to each burn, ash and residue from the pre-vious burn were removed. Each burn began with ignition of the fire starters using a hand-held lighter and immediately closing the burner door. The damper was left completely open to allow maximum air flow into the combustion cham-ber until the logs caught fire (∼10–15 min), after which the air flow was reduced.
Before each experiment, the chamber was cleaned by in-jecting O3 for 6 to 8 h and irradiating with a set of 80 UV lights (100 W, Cleo Performance, Philips) (Platt et al., 2013) for at least 10 h while flushing with pure air (120 L min−1, 737-250 series, AADCO Instruments Inc.). The chamber was then flushed with pure air in the dark for at least 20 h. Af-ter cleaning, the chamber was partially filled with humidi-fied pure air. Wood was combusted as described above and emissions were sampled from the chimney, diluted using two ejector dilutors in parallel (DI-1000, Dekati Ltd.) and in-jected into the chamber. Lines from the chimney to the smog chamber, the ejection diluters and the dilution air (equal mix-ture of air purified from 737-250 series, AADCO Instruments Inc. and 250 series, AADCO Instruments Inc.) were heated to 473 K to reduce line losses of semi-volatile compounds due to condensation of the hot emissions. The total dilution ratios of the raw emissions after the dilutors ranged from 13.6 to 15. Emissions underwent another dilution of roughly a factor of 5–20, depending on the experiment, when injected into the chamber. The average temperature and relative humidity in the chamber after emission injection was 294.0 ±0.5 K and 60±5 %, respectively.
Emission injection into the chamber began at least 15 min after ignition to ensure that the emissions were not influ-enced by fire starters. Injection continued until either flames were no longer visible or the desired mass concentration was reached in the chamber, which ranged from 41 to 82 min for experiments 1–5. Experiment 6 was performed in a similar manner, except at the end of the flaming phase, the injec-tion into the chamber was stopped and two batches of two additional logs each were added to the burner. The second and third injection into the chamber began after the new logs caught fire (approximately 2–4 min after addition) for a total injection period of 113 min.
A burn proceeds through phases: a starting phase, at least one stable flaming phase and a smoldering phase, all of which can have different chemical profiles. Emissions are typically more variable during the start and smoldering phase than the flaming stage. To isolate the effect of fuel loading, only emissions from the flaming phase were sampled. In this study, the average modified combustion efficiency (MCE), defined as the ratio of CO2(g) to the sum of CO2(g) and
CO(g)(Ward and Radke, 1993), of the injected emissions was
greater than 0.90 for each experiment (Table 1), indicating in-jected emissions were dominated by the flaming phase (Lee et al., 2010).
After injection, the gaseous and particulate emissions in the chamber were characterized using a variety of online and offline techniques described below. Following approximately 2 h of primary emissions measurements, the toxicological re-sponses of human epithelia cells to the particle emissions were investigated (presented in a future publication). During the cell exposures, particles were sampled at∼80 L min−1 from the chamber. This necessitated refilling the partially empty chamber during the exposure with humidified pure air. After exposing the cells to primary emissions and the con-current refilling of the chamber, a 9-times deuterated bu-tanol sample (bubu-tanol-D9, 98 %, Cambridge Isotope Labo-ratories) was injected into the chamber. This compound was monitored ([M-H2O+H]+ fragment,m/z 66) using a pro-ton transfer reaction time-of-flight mass spectrometer (PTR-MS, [H3O]+ reagent ion, Ionicon Analytik GmbH) to cal-culate OH exposures in the chamber, using a rate constant of 3.4×10⁻¹²cm3molec−1s−1(Barmet et al., 2012). The PTR-MS was not used during experiments 3 and 6.
In addition to the butanol-D9 injection, a continuous injec-tion of nitrous acid (HONO), which dissociates upon irradi-ation (λ< 400 nm) to form hydroxyl radical (OH), began 30– 35 min prior to the start of photooxidation. The HONO was generated and injected by bubbling pure air (2.5 L min−1)
through a mixture of H2SO4 (95–97 %, Merck) in water (10 mM, 18.0 Mcm, Milli-Q, Reference A+)and NaNO2 in water (1 mM experiments 1, 2, 4, 5; 3 mM experiments 3, 6;≥99.0 %, Fluka) and passing through a particle filter into the chamber (Taira and Kanda, 1990; Pfaffenberger et al., 2013). Finally, the emissions were aged with UV light for 4.5–16 h, corresponding to maximum OH exposures of
∼(2–5)×107molec cm−3h in experiments 1, 2, 4 and 5. A significant increase in OA upon photooxidation was observed during all experiments, and after the maximum OA concen-tration was reached, a second cell exposure and chamber re-fill was performed.
Table 1.Characterization of primary gas-phase and particle-phase emissions measured from the smog chamber.
Expt. Wood load Wood burned MCE CO2 CO CH4 THC Total PM Organic PAH BC NO3 SO4 NH4 Cl OM : BCb O : Cc H : Cc (kg) per chamber air (g kg−1)b (g kg−1)b (g kg−1)b (g kg−1)b (g kg−1)b (mg kg−1)a,b (mg kg−1)b (mg kg−1)b (mg kg−1)b (mg kg−1)b (mg kg−1)b (mg kg−1)b
volume (g m−3)b
1 2.17 0.562±0.008 0.96 1740±50 42.8±0.9 2.93±0.05 5.8±0.3 0.81±0.02 700±20 27±2 75±1 18±1 5.8±0.3 3.6±0.3 2.07±0.09 9.4±0.2 0.376±0.002 1.521±0.006 2 2.21 0.635±0.004 0.96 1740±20 43.8±0.3 4.02±0.03 5.7±0.2 0.260±0.005 154±5 5.2±0.8 86±2 9.7±0.8 2.8±0.2 1.6±0.2 0.59±0.08 1.79±0.06 0.475±0.006 1.45±0.01 3 2.26 0.5227±0.0001 0.96 1773.1±0.9 31.65±0.08 2.368±0.001 2.3±0.1 0.227±0.009 60±9 2.8±0.5 153±9 9.6±0.7 2.1±0.3 1.5±0.2 0.24±0.07 0.39±0.06 0.40±0.01 1.447±0.008 4 7.47 1.239±0.004 0.96 1730±10 51.3±0.2 4.07±0.02 6.53±0.07 0.132±0.002 78±2 13.1±0.8 45.6±0.3 5.3±0.3 2.0±0.2 0.58±0.04 0.60±0.06 1.72±0.05 0.255±0.007 1.133±0.008 5 7.49 0.669±0.001 0.97 1743±6 45.9±0.1 2.872±0.004 4.58±0.06 0.174±0.002 40±2 5.4±0.5 119.8±0.6 10.4±0.6 1.8±0.2 1.2±0.2 0.33±0.07 0.33±0.01 0.36±0.01 1.09±0.01 6 7.34 1.6908±0.0003 0.94 1701.4±0.7 64.96±0.05 4.717±0.003 7.65±0.04 0.172±0.003 59±3 8.1±0.4 105±2 5.0±0.2 2.4±0.2 0.56±0.04 1.16±0.08 0.56±0.03 0.305±0.008 1.205±0.007 aOrganic includes PAH.bDeviations are±2 SD calculated from the error propagation of the sample standard deviation of the measurements.cDeviations are±2 SD of the measurements.
converter and 9841A NOx analyzer, Monitor Labs) were measured.
Non-refractory particle chemical composition and size were measured using a high-resolution (HR) time-of-flight AMS (Aerodyne Research Inc.) (DeCarlo et al., 2006) op-erated in V mode with a 2.5 µm inlet lens (Williams et al., 2013). Two Aethalometers each measured black car-bon mass concentrations at seven wavelengths (Magee Sci-entific Aethalometer model A33, Aerosol d.o.o.). A ther-mal desorber comprised of a 50 cm heating section held at 423 K followed by a 50 cm denuder section was located di-rectly upstream of one Aethalometer to volatilize and re-move organic species (Burtscher et al., 2001). A condensa-tion particle counter (CPC, 3025A TSI) measured total par-ticle number concentrations and a scanning mobility parpar-ticle sizer (SMPS, CPC 3022, TSI, and custom built DMA with a length of 0.44 m) measured particle size distributions. Parti-cles were dried (Nafion, Perma Pure LLC) upstream of the AMS, Aethalometers, SMPS and CPC.
Losses in the thermal desorber were determined by nebu-lizing NaCl (≥99.5 %, Fluka) in water and passing through the thermal desorber. Size distributions were measured using an SMPS before and after the thermal desorber. It was deter-mined that 24 % of the mass is lost in the thermal desorber at a mobility diameter of 100 nm and 9 % of the mass is lost at a mobility diameter of 200 nm. The average mobility diame-ter of the particles afdiame-ter injection ranged from 50 to 120 nm and losses were accounted for using the data collected at a mobility diameter of 100 nm.
Additionally, particles were collected on filters (47 mm Tissuquartz, Pall Corporation, 26 L min−1for 30–32 min) af-ter injection of the primary emissions and afaf-ter observation of the maximum OA signal during aging. Prior to deposi-tion on the filter, particles were sampled through a char-coal denuder to remove organic gases. Filters were imme-diately stored at 253 K until analysis. Filters were analyzed by in situ-derivatization thermal desorption gas chromatogra-phy time-of-flight mass spectrometry (IDTD-GC-TOF-MS) as described by Orasche et al. (2011). Briefly, a small portion of each filter was spiked with internal standards (isotopically labeled compounds; Orasche et al., 2011) and N-methyl-N-(trimethylsilyl)-trifluoroacetamide (MSTFA) was added be-fore and subsequently during a thermal extraction period by introduction into a carrier gas stream. Thermally desorbed and derivatized molecules were transferred onto the cold GC
column and the GC-MS run was started with pure carrier gas. Filter analysis from experiment 2 is not available.
3 Data analysis
3.1 Wall loss and dilution
wall loss rate constant, which is dependent on particle size, is not expected to change greatly following the coagulation period immediately after injection, as the particle mass mean diameter changed less than 100 nm for all experiments except experiment 6.
The wall loss correction was applied after the emissions were injected and well mixed in the chamber, approximately 15–50 min after the end of the injection, until the end of the experiment. Concentrations were also corrected for dilution during chamber refilling by using CH4as an inert tracer. Gas-phase measurements were corrected for dilution in the same manner.
3.2 Emission factors
Emission factors (EFs) of various speciesi,Si, were
deter-mined using Eq. (1) (Andreae and Merlet, 2001):
EFSi=
1Si
1CCO2+1CCO+1CHC+1COC+1CBC
×fC, (1)
where 1Si is the background-corrected concentration of
speciesi,1CCO2 is the background-corrected CO2
concen-tration, 1CCO is the background-corrected CO concentra-tion, 1CHC is the background-corrected hydrocarbon con-centration, 1COC is the background-corrected organic car-bon concentration,1CBCis the background-corrected black carbon concentration, andfCis the carbon fraction of beech wood, estimated to be 0.5 (Joosten et al., 2004). HR-AMS data were used to determine the organic mass to organic car-bon (OM : OC) ratio for each experiment (Aiken et al., 2008). The average OM : OC of the primary emissions for the aver-age load experiments was 1.7±0.1 and was 1.56±0.05 for the high load experiments.
3.3 AMS analysis
AMS data were analyzed in Igor Pro 6.3 (WaveMetrics) us-ing the SQUIRREL (version 1.53F) and PIKA (1.12F) data analysis programs.
Extensive fragmentation of most compounds is observed in AMS mass spectra due to the vaporization–ionization pro-cess. During data analysis, the mass spectral signal is sep-arated into different compound classes (i.e., organics, ni-trate, sulfate, ammonium and chloride) using known frag-mentation patterns for unit mass resolution (UMR) data (Al-lan et al., 2004) or using ion assignments determined from high-resolution (HR) analysis. Unlike most organic com-pounds, PAHs undergo relatively little fragmentation in the AMS vaporization–ionization process, making it possible to positively identify PAH base ions ([M]+). In addition to base ions, some associated fragment ions are observed (e.g., [M-H]+, [M-2H]+ and [M+H]+) (Dzepina et al., 2007). PAH base ions and associated ions can also be doubly charged (e.g., [C16H10]+=m/z 202.08 and [C16H10]2+= m/z101.04). For singly charged ions at odd nominal masses,
this results in doubly charged ions at roughly half-integer masses (e.g., [C16H9]+=m/z 201.07 and [C16H9]2+= m/z100.54).
PAH quantification from AMS data is not often reported, even when PAHs are in relatively high abundance (Elsasser et al., 2013), due to data analysis challenges. UMR quantifi-cation of PAH and non-PAH contribution at the same nom-inal mass and incorporation of signal at half-integer masses is difficult (Dzepina et al., 2007). HR analysis allows for the quantification of ions at half-integer masses and the ability to distinguish between multiple ions at the same nominal mass. However, the number of possible molecular assignments and ion peak widths both increase with increasingm/z, making PAH assignment and separation from non-PAH signal at the same nominal mass difficult.
Dzepina et al. (2007) measured PAH standards and ambi-ent PAHs with a quadrupole AMS and developed a method to analyze PAHs separately from organics. In the ambient mea-surements, contribution at higherm/zvalues from non-PAH compounds further complicated PAH quantification. Based on the analysis of laboratory standards, a method was devel-oped for quantifying PAHs. However, Dzepina et al. (2007) used a quadrupole AMS during these measurements and thus only UMR data were available. Here, HR data provide more information for PAH quantification. For this study, PAHs were analyzed as a subclass of organics, using a combina-tion of UMR and HR analysis to maximize the advantages of both methods.
The UMR analysis fragmentation table was modified with input from the HR analysis. To reduce uncertainty in peak fitting due to increasing number of chemically reasonable ion assignments at higher masses, HR data were fit only for masses belowm/z200. Peaks abovem/z200 were fit only if the peak measured during primary emissions could be fit solely with a formula corresponding to a PAH and yielded a fit residual less than 5 %. Peak fit examples are shown in Fig. S2 in the Supplement. To achieve satisfactory fitting in the higher m/z range, PAH ions with sufficiently high signal to noise were used in the determination of the m/z
calibration and peak width parameters. All signal at PAH base peaks abovem/z 200 is considered PAH, which may neglect non-PAH contributions. However, the quality of the peak fits in Fig. S2 in the Supplement is high, suggesting that the non-PAH signal at these masses is relatively low. This method also results in some mass abovem/z200 considered non-PAH, which may be PAH-related. If all the mass above
m/z200 categorized as non-PAH was actually PAH-related, the PAH signal would increase by∼50–90 % for the primary emissions.
Table 2.PAH base ions included in the AMS analysis.
Ion Nominalm/z
[C10H8]+ 128
[C11H7]+ 139
[C12H8]+ 152
[C13H7]+ 163
[C13H9]+ 165
[C12H8O]+ 168
[C14H8]+ 176
[C14H10]+ 178
[C15H9]+ 189
[C13H8O2]+ 196
[C16H7]+ 199
[C16H10]+ 202
[C18H10]+ 226
[C17H10O]+ 230
[C20H12]+ 252
[C22H12]+ 276
[C24H12]+ 300
[C24H14]+ 302
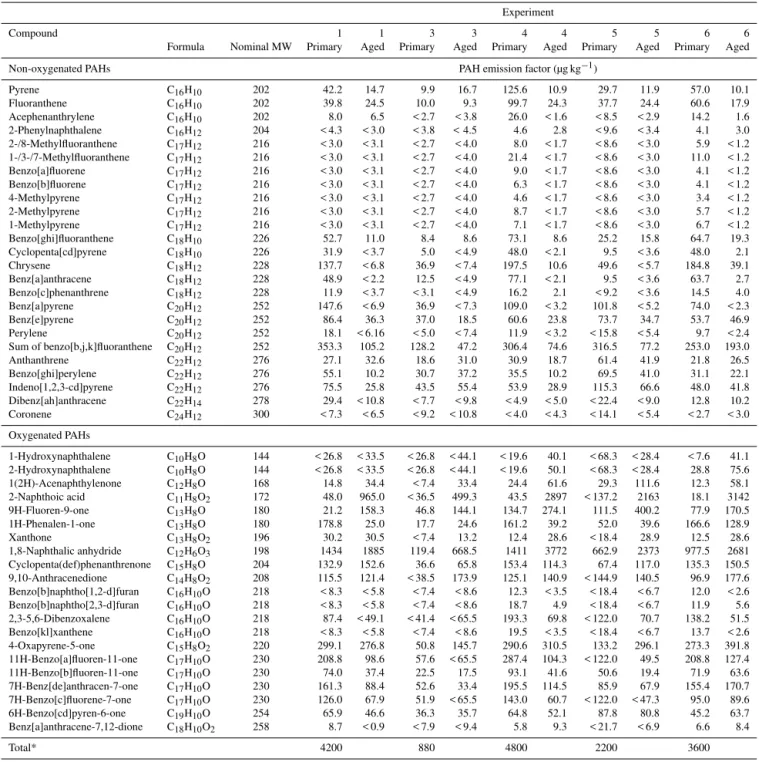
From the HR analysis, it was observed that the oxygenated PAHs do not have significant signal at the (non-isotopic) as-sociated ions listed above, likely due to fragmentation dif-ferences from the presence of oxygen atom. There are con-siderable PAH signals as low asm/z128 (Fig. 1), which if interpreted as an unfragmented species would indicate naph-thalene; however, this compound is expected to be fully in the gas phase (Pankow, 1994). Therefore, this suggests that the PAH signals observed in the lowerm/zregion are likely from PAHs that have undergone fragmentation in the AMS vaporization–ionization process. The PAH ions at oddm/z’s are also likely fragments, as observed by Bente et al. (2009). PAH base ions typically yield higher signals than their as-sociated ions and are thus less prone to interference from non-PAH signal. To reduce uncertainty in quantification at the associated ions, particularly during oxidation when the PAH fraction decreases due to reaction of PAHs and/or pro-duction of non-PAH ions, the ratio of the base ion to each associated ion was determined from the primary emissions. This ratio was then incorporated into the UMR fragmenta-tion table and applied to the entire data set. These ratios are influenced by instrumental parameters and are assumed to not change greatly during the short period in which these experiments were performed. Thus, these ratios were deter-mined from a single experiment (experiment 4, with the high-est fraction of PAHs) and applied to all experiments. Fig-ure S3 in the Supplement shows the ratios of associated ions to the base ion for base peaks atm/z202, 226 and 276 during this experiment. These ratios were relatively stable during the
∼7 h primary emission measurement period, including dur-ing dilution. There were difficulties in determindur-ing accurate ratios of the smallest PAH ion, [C10H8]+, and the associated
0.08 0.06 0.04 0.02 0.00 300 250 200 150 100 50 0 60 43 29 73 57 0.08 0.06 0.04 0.02 0.00 300 250 200 150 100 50 0 0.12 0.11 44 57
202 226 252
276 0.08 0.06 0.04 0.02 0.00 300 250 200 150 100 50 0 44 28 57 202 226 252 276 152 189 176 163 126 139 0.08 0.06 0.04 0.02 0.00 300 250 200 150 100 50 0 57
60 126 152 202
226 252
44
28
139 189 276
176 163 0.08 0.06 0.04 0.02 0.00 300 250 200 150 100 50 0 71 60 44 30 57 0.08 0.06 0.04 0.02 0.00 300 250 200 150 100 50 0 73 60 44 29 57 m/z m/z Normalized intensity Organic (non-PAH) PAH Nitrate Sulfate Ammonium Chloride a (1) d (4) b (2) e (5) c (3) f (6)
Figure 1.AMS mass spectra of organic (non-PAH) and PAH
contri-butions to primary non-refractory particles from(a–c)average-load
experiments 1–3 and from(d–f)high-load experiments 4–6,
respec-tively. The signal is normalized to the total signal. The legend in(a)
applies to(a–f).
[C10H6]+. For this PAH and associated ions, ratios were
de-termined individually for each experiment.
The doubly charged ions from even mass base ions over-lap with other ions which may be PAH or non-PAH. Thus, the ratio of doubly charged to singly charged ions from all odd mass base ions was used to calculate the doubly charged sig-nal from even mass base ions. For presentation of mass spec-tra herein, the signal from the doubly charged ions was sub-tracted from them/zat which it was observed and added into the base ion signal. Also, there is overlap between some base and associated ions. For example, [M-2H]+from [C14H10]+ is [C14H8]+. In these cases, for example, [C14H8]+ was treated as a base ion, and thus the ratio of [C14H10]+ to the [M-2H]+ was not included in the analysis. The ratio of
[M]+/ [M-H]+was used, and thus [M+H]+from [C14H8]+
was not calculated.
For analysis requiring software tools only available for use with HR data (e.g., determination of elemental ratios), not all mass is accounted for due to difficulties in fitting above
HR data were used exclusively for nitrate, sulfate, ammo-nium and chloride quantification. For quantification, the rel-ative ionization efficiency (RIE) of PAHs was assumed to be the same as non-PAH organics (i.e., 1.4). As with several recent laboratory biomass burning studies (Hennigan et al., 2011; Heringa et al., 2011, 2012; Ortega et al., 2013; Eriks-son et al., 2014), a collection efficiency of 1 was used for all experiments.
The AMS PAH analysis is subject to uncertainties. PAHs may be underestimated due to the conservative analysis ap-proach of only assigning compounds that are unambiguously PAHs to the PAH subclass. The PAH RIE is another possible source of error in the AMS analysis. Compared to the PAH RIE used in this study, Dzepina et al. (2007) measured simi-lar or greater RIEs for four PAH standards (∼1.35–2.1) and Slowik et al. (2004) measured a similar RIE for pyrene of 1.35. However, if the RIE was higher (i.e., 2.1), the reported PAH values would decrease by a factor of 1.5. Substantial formation of PAHs during the AMS vaporization process is unlikely. Flash pyrolysis of biomass material at 400–550◦C was observed to produce very low levels of PAHs (Horne and Williams, 1996). Although the temperatures were lower than that of the AMS vaporizer (600◦C), the pyrolysis time was 2 s, much longer than the 10−4–10−5s AMS vaporiza-tion process.
3.4 Filter-based analysis
GC-MS analysis of filter samples can provide unambiguous identification of PAH compounds not possible with AMS analysis. However, filter-based techniques are subject to both positive and negative artifacts during sampling, as well as during analysis, particularly for semi-volatile species. For example, positive artifacts can arise from the adsorption of semi-volatile species in the gas phase onto the filter, whereas evaporation of species on the filter results in negative arti-facts (Turpin et al., 2000). Many of the PAHs emitted during wood combustion are semi-volatile (Hytonen et al., 2009). For example, using a modified partitioning model of Pankow (Pankow, 1994; Donahue et al., 2006), 26 % of pyrene is ex-pected to be in the gas phase at 294 K, assuming a pyrene ac-tivity coefficient in the organic mass of 1, a vapor pressure of 1.3×10⁻⁴Pa and a total organic aerosol mass concentration of 30 µg m−3, based on the non-wall-loss/dilution-corrected organic trace during the primary filter collection period of the high-load experiments. Positive artifacts are greatly reduced or eliminated by using a denuder upstream of the filter to re-move organic gases (Subramanian et al., 2004), but this pos-sibly results in substantial negative artifacts by altering the gas–particle equilibrium. For example, the negative artifact for OC on quartz filters with an upstream denuder was 43 % of the total OC for diesel exhaust, which like wood smoke contains semi-volatiles (Zhang et al., 2012). For individual PAHs, there was a 41–70 % difference between denuded and non-denuded samples (Zhang et al., 2012). However, only
PAHs with molecular weights (MWs) of 252 and 276 were reported (Zhang et al., 2012) and negative artifacts are ex-pected to be even higher for higher volatility PAHs. When measuring wood burning emissions, Hytonen et al. (2009) found that only 80 % of the true particulate PAH quantity of 15 measured PAHs (MW 152–276) were collected on the filter when using an upstream denuder, with pyrene, fluoran-thene, phenanthrene and anthracene most affected. As a de-nuder was used in the current experiments, filter artifacts are likely to be predominately negative. Also, although a large number of PAHs were quantified, the list is likely not ex-haustive (Table 3).
4 Results and discussion
For all experiments, primary particulate emissions were a mixture of organic and inorganic compounds and black car-bon (Table 1). Emission factors of various species in the chamber are given in Table 1 and corresponding concentra-tions in the chamber are presented in Table S1 in the Sup-plement. Organic contribution to the total particulate matter (PM) mass was substantial in all experiments, ranging from 22 to 87 % (Table 1), in agreement with the wide range re-ported in previous studies (Schauer et al., 2001; Hedberg et al., 2002; Fine et al., 2004b; Schmidl et al., 2008; Elsasser et al., 2013). Total PM concentrations were determined by summing BC and all species measured by AMS. Non-carbon elemental species were not measured during this study, and although they are known to be emitted from wood combus-tion, they are not expected to greatly influence the results, as previous studies have typically found contributions of less than 5 % to the fine PM mass (Schauer et al., 2001; Hedberg et al., 2002; Fine et al., 2004b).
The total PM emission factor was similar for each exper-iment, except experiment 1, for which it was over 3 times greater than the other burns due to increased organic emis-sions (Table 1). There were no obvious reasons why the total PM emission factor in experiment 1 was considerably higher than the other experiments. Although the MCEs were simi-lar for all burns (Table 1), this illustrates the real-world vari-ability of wood combustion emissions and the large range of possible emission factors from the same burner and operator. Variability is also observed in previous comparisons of high-and average-load burns. Orasche et al. (2013) found total PM emission factors were a factor of about 1.4 higher for high-load flaming conditions than for average high-loads, whereas El-sasser et al. (2013) found 4-times-higher PM emissions gen-erated under high-load conditions compared to average-load conditions. However, it is noted the Elsasser et al. (2013) re-sult was determined from a single measurement.
Table 3.PAHs quantified from offline GC-MS analysis of filter samples.
Experiment
Compound 1 1 3 3 4 4 5 5 6 6
Formula Nominal MW Primary Aged Primary Aged Primary Aged Primary Aged Primary Aged
Non-oxygenated PAHs PAH emission factor (µg kg−1)
Pyrene C16H10 202 42.2 14.7 9.9 16.7 125.6 10.9 29.7 11.9 57.0 10.1
Fluoranthene C16H10 202 39.8 24.5 10.0 9.3 99.7 24.3 37.7 24.4 60.6 17.9
Acephenanthrylene C16H10 202 8.0 6.5 < 2.7 < 3.8 26.0 < 1.6 < 8.5 < 2.9 14.2 1.6
2-Phenylnaphthalene C16H12 204 < 4.3 < 3.0 < 3.8 < 4.5 4.6 2.8 < 9.6 < 3.4 4.1 3.0
2-/8-Methylfluoranthene C17H12 216 < 3.0 < 3.1 < 2.7 < 4.0 8.0 < 1.7 < 8.6 < 3.0 5.9 < 1.2
1-/3-/7-Methylfluoranthene C17H12 216 < 3.0 < 3.1 < 2.7 < 4.0 21.4 < 1.7 < 8.6 < 3.0 11.0 < 1.2
Benzo[a]fluorene C17H12 216 < 3.0 < 3.1 < 2.7 < 4.0 9.0 < 1.7 < 8.6 < 3.0 4.1 < 1.2
Benzo[b]fluorene C17H12 216 < 3.0 < 3.1 < 2.7 < 4.0 6.3 < 1.7 < 8.6 < 3.0 4.1 < 1.2
4-Methylpyrene C17H12 216 < 3.0 < 3.1 < 2.7 < 4.0 4.6 < 1.7 < 8.6 < 3.0 3.4 < 1.2
2-Methylpyrene C17H12 216 < 3.0 < 3.1 < 2.7 < 4.0 8.7 < 1.7 < 8.6 < 3.0 5.7 < 1.2
1-Methylpyrene C17H12 216 < 3.0 < 3.1 < 2.7 < 4.0 7.1 < 1.7 < 8.6 < 3.0 6.7 < 1.2
Benzo[ghi]fluoranthene C18H10 226 52.7 11.0 8.4 8.6 73.1 8.6 25.2 15.8 64.7 19.3
Cyclopenta[cd]pyrene C18H10 226 31.9 < 3.7 5.0 < 4.9 48.0 < 2.1 9.5 < 3.6 48.0 2.1
Chrysene C18H12 228 137.7 < 6.8 36.9 < 7.4 197.5 10.6 49.6 < 5.7 184.8 39.1
Benz[a]anthracene C18H12 228 48.9 < 2.2 12.5 < 4.9 77.1 < 2.1 9.5 < 3.6 63.7 2.7
Benzo[c]phenanthrene C18H12 228 11.9 < 3.7 < 3.1 < 4.9 16.2 2.1 < 9.2 < 3.6 14.5 4.0
Benz[a]pyrene C20H12 252 147.6 < 6.9 36.9 < 7.3 109.0 < 3.2 101.8 < 5.2 74.0 < 2.3
Benz[e]pyrene C20H12 252 86.4 36.3 37.0 18.5 60.6 23.8 73.7 34.7 53.7 46.9
Perylene C20H12 252 18.1 < 6.16 < 5.0 < 7.4 11.9 < 3.2 < 15.8 < 5.4 9.7 < 2.4
Sum of benzo[b,j,k]fluoranthene C20H12 252 353.3 105.2 128.2 47.2 306.4 74.6 316.5 77.2 253.0 193.0
Anthanthrene C22H12 276 27.1 32.6 18.6 31.0 30.9 18.7 61.4 41.9 21.8 26.5
Benzo[ghi]perylene C22H12 276 55.1 10.2 30.7 37.2 35.5 10.2 69.5 41.0 31.1 22.1
Indeno[1,2,3-cd]pyrene C22H12 276 75.5 25.8 43.5 55.4 53.9 28.9 115.3 66.6 48.0 41.8
Dibenz[ah]anthracene C22H14 278 29.4 < 10.8 < 7.7 < 9.8 < 4.9 < 5.0 < 22.4 < 9.0 12.8 10.2
Coronene C24H12 300 < 7.3 < 6.5 < 9.2 < 10.8 < 4.0 < 4.3 < 14.1 < 5.4 < 2.7 < 3.0
Oxygenated PAHs
1-Hydroxynaphthalene C10H8O 144 < 26.8 < 33.5 < 26.8 < 44.1 < 19.6 40.1 < 68.3 < 28.4 < 7.6 41.1
2-Hydroxynaphthalene C10H8O 144 < 26.8 < 33.5 < 26.8 < 44.1 < 19.6 50.1 < 68.3 < 28.4 28.8 75.6
1(2H)-Acenaphthylenone C12H8O 168 14.8 34.4 < 7.4 33.4 24.4 61.6 29.3 111.6 12.3 58.1
2-Naphthoic acid C11H8O2 172 48.0 965.0 < 36.5 499.3 43.5 2897 < 137.2 2163 18.1 3142
9H-Fluoren-9-one C13H8O 180 21.2 158.3 46.8 144.1 134.7 274.1 111.5 400.2 77.9 170.5
1H-Phenalen-1-one C13H8O 180 178.8 25.0 17.7 24.6 161.2 39.2 52.0 39.6 166.6 128.9
Xanthone C13H8O2 196 30.2 30.5 < 7.4 13.2 12.4 28.6 < 18.4 28.9 12.5 28.6
1,8-Naphthalic anhydride C12H6O3 198 1434 1885 119.4 668.5 1411 3772 662.9 2373 977.5 2681
Cyclopenta(def)phenanthrenone C15H8O 204 132.9 152.6 36.6 65.8 153.4 114.3 67.4 117.0 135.3 150.5
9,10-Anthracenedione C14H8O2 208 115.5 121.4 < 38.5 173.9 125.1 140.9 < 144.9 140.5 96.9 177.6
Benzo[b]naphtho[1,2-d]furan C16H10O 218 < 8.3 < 5.8 < 7.4 < 8.6 12.3 < 3.5 < 18.4 < 6.7 12.0 < 2.6
Benzo[b]naphtho[2,3-d]furan C16H10O 218 < 8.3 < 5.8 < 7.4 < 8.6 18.7 4.9 < 18.4 < 6.7 11.9 5.6
2,3-5,6-Dibenzoxalene C16H10O 218 87.4 < 49.1 < 41.4 < 65.5 193.3 69.8 < 122.0 70.7 138.2 51.5
Benzo[kl]xanthene C16H10O 218 < 8.3 < 5.8 < 7.4 < 8.6 19.5 < 3.5 < 18.4 < 6.7 13.7 < 2.6
4-Oxapyrene-5-one C15H8O2 220 299.1 276.8 50.8 145.7 290.6 310.5 133.2 296.1 273.3 391.8
11H-Benzo[a]fluoren-11-one C17H10O 230 208.8 98.6 57.6 < 65.5 287.4 104.3 < 122.0 49.5 208.8 127.4
11H-Benzo[b]fluoren-11-one C17H10O 230 74.0 37.4 22.5 17.5 93.1 41.6 50.6 19.4 71.9 63.6
7H-Benz[de]anthracen-7-one C17H10O 230 161.3 88.4 52.6 33.4 195.5 114.5 85.9 67.9 155.4 170.7
7H-Benzo[c]fluorene-7-one C17H10O 230 126.0 67.9 51.9 < 65.5 143.0 60.7 < 122.0 < 47.3 95.0 89.6
6H-Benzo[cd]pyren-6-one C19H10O 254 65.9 46.6 36.3 35.7 64.8 52.1 87.8 80.8 45.2 63.7
Benz[a]anthracene-7,12-dione C18H10O2 258 8.7 < 0.9 < 7.9 < 9.4 5.8 9.3 < 21.7 < 6.9 6.6 8.4
Total* 4200 880 4800 2200 3600
Wall losses and dilution accounted for in reported emission factors.∗Sum of PAHs above detection limit.
than ambient measurements (Gianini et al., 2012) and some direct emission studies (e.g., McDonald et al., 2000; Fine et al., 2001, 2002a, 2004a, b; Schauer et al., 2001; Schmidl et al., 2008). Similar values to those found in this study were re-ported in measurements from previous chamber experiments (Grieshop et al., 2009b; Heringa et al., 2011) and other di-rect emission studies for flaming conditions with modern small-scale wood burning appliances (Lamberg et al., 2011; Eriksson et al., 2014). Variability in literature OM : BC
ratios. In addition, previous direct emission studies often used lower dilution ratios than used in this study and col-lected material on quartz fiber filters without the use of an upstream denuder (e.g., McDonald et al., 2000; Fine et al., 2001, 2002a, 2004a, b; Schauer et al., 2001), both of which can result in substantial positive artifacts, as discussed previ-ously (Subramanian et al., 2004). This would result in over-estimated OM : BC ratios.
AMS and offline filter measurements provide data on the effect of fuel loading on particulate composition. Figure 1 shows the average AMS mass spectrum of the primary emis-sions from each experiment. The mass spectral signal is sep-arated into different chemical classes (i.e., organic, PAH, ni-trate, sulfate, ammonium and chloride) as described in the data analysis section. There were significantly higher PAH contributions to the total organic signal for the high-load ex-periments compared to the average-load exex-periments (Fig. 1, Table 1). For the high-load experiments, PAHs contributed 14–17 % to the total organic signal, compared to only 3.4– 4.7 % for the average-load experiments (Table 1).
Higher PAH fractions of the total organic mass with higher wood loading are in agreement with Elsasser et al. (2013), who observed an increased signal at higher m/z values in AMS mass spectra under high-load conditions, compared to average-load conditions, and attributed this to PAHs. Eriks-son et al. (2014) measured PAH contributions to the total OA of 6–14 % under hot, air-starved conditions (generated using higher wood loadings) compared to only 2–4 % un-der nominal burn conditions during the flaming stage using AMS. Also, previous GC-MS analysis of primary filter sam-ples shows a contribution of PAHs to total PM mass of about 13 % during high-load burning, compared to less than 1 % during average-load burning of beech wood (Orasche et al., 2013).
As filter-based methods can be subject to considerable ar-tifacts and the analysis method used here for PAH quantifica-tion from HR-AMS data is novel, results from filter and AMS PAH analysis were compared. The total primary PAH emis-sion factors measured from the filters were 0.88 mg kg−1 (ex-periment 3) and 4.2 mg kg−1(experiment 1) for average-load experiments and ranged from 2.2 to 4.8 mg kg−1 for high-load experiments (Table 3). The primary PAH emission fac-tors measured by AMS ranged from 2.8 to 27 mg kg−1for average-load experiments and 5.4 to 13 mg kg−1 for high-load experiments. AMS PAH emission factors were higher than those determined from the filter analysis, but within a factor of 2–3 for all experiments, except experiment 1, which differed by a factor of 6. Due to uncertainties associated with both analysis methods, agreement within a factor of 2–3 is satisfactory.
As a further comparison between the filter and AMS PAH analysis for primary aerosol, compounds with molecular weights corresponding to base ions measured by the AMS above the background level (i.e., 202, 226, 230, 252 and 276 including all associated ions) were compared (Fig. S4
in the Supplement). With the uncertainties associated with both methods, good agreement was observed for molecular weights of 230, 252 and 276, with AMS : filter ratios rang-ing from∼0.9 to 2 for the primary emissions. However, for MW 202 and 226, the filter measurements were a factor of
∼6–15 lower than the AMS measurements. The discrepan-cies between the filter and AMS measurements were highest for the highest volatility compounds compared, suggesting negative artifacts during the filter sampling, attributed to the use of the denuder.
Discrepancies between the filter and AMS measurements increased with aging (Fig. S4 in the Supplement), particu-larly for the higher volatility compounds (i.e., MW 202 and 226). The AMS : filter ratios for MW 230, 252 and 276 were 0.9–4, whereas AMS : filter ratios increased drastically for MW 202 and 262 to 13–43. The increased AMS : filter ratios during aging could be due to the formation of oxygenated PAHs, which are more likely to fragment in the AMS than unfunctionalized compounds, and could contribute to the base ion and/or associated ions. Thus, it is not clear whether the AMS signals during aging correspond solely to the com-pounds identified in the filter samples. During aging, gas-phase compounds are oxidized and partition to the particles and the AMS : filter ratios for the lower volatility compounds, which are already predominately in the particle phase, would not change as much during aging as higher volatility com-pounds, as observed.
The primary organic emission factors for the average-load experiments were a factor of 0.8–18 times higher than for the high-loading experiments. Although there were higher PAH fractions of the organic mass in the high load cases, there were generally higher primary organic emission fac-tors for the average-load burns compared to the higher load burns, resulting in comparable PAH emission factors. The PAH emission factors in this study are considerably lower than the 196 mg kg−1 found by Orasche et al. (2013) under stable burning conditions of beech wood in an overloaded burner; however, total PM mass determined by Orasche et al. (2013) by weighing dried filter samples was also con-siderably higher. The higher emission factors observed by Orasche et al. (2013) may be due to differences in burner technologies or sampling methods. The emission dilution ratio affects the partitioning of semi-volatile species, with higher dilution ratios shifting the distribution to the gas phase and thus decreasing particle emission factors (Lipsky and Robinson, 2005). The dilution ratios were only a factor of 4 in Orasche et al. (2013), compared to ∼70–300 in this study. Also, their lack of a denuder upstream of the filter may have resulted in positive artifacts (Subramanian et al., 2004; Orasche et al., 2013).
7.6×10⁻⁷Pa at 263 K, activity coefficient in the organic mass of 1 and a total organic aerosol mass concentration of 30 µg m−3)(Pankow, 1994; Donahue et al., 2006). These ex-periments were conducted at 294 K; however, most residen-tial wood combustion occurs when outdoor temperatures are well below this. Thus, if these experiments had been con-ducted at lower temperatures, particulate PAH emission fac-tors would be higher.
The ion C2H4O+2 is used as a biomass burning tracer in ambient AMS data. Interestingly, the fraction of C2H4O+2 relative to the total primary OA (fC2H4O+2)was higher in the average-load experiments, ranging from 0.050 to 0.094, compared to the high load experiments, ranging from 0.012 to 0.029. As summarized by Fitzpatrick et al. (2007), lower burn temperatures favor the formation of products from the pyrolysis of lignin and carbohydrates, including levoglu-cosan. As the burn temperature increases, the relative con-tribution of these compounds decreases and products such as polycyclic oxygenates and PAHs dominate. The higher
fC2H4O+2 and lower fPAHs in the average-load experi-ments suggests that the variability in fC2H4O+2 was due to lower burn temperatures in the average-load experiments, likely due to different fuel / air ratios.
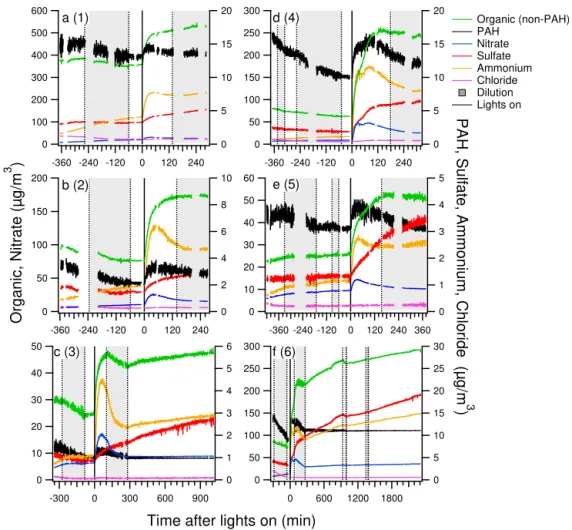
The chemical differences in organic emissions from high-and average-load cases lead to differences in the evolution of these emissions with aging, which has not previously been investigated. Figure 2 shows the evolution of the compo-nents measured by AMS, corrected for wall losses and di-lution, with photochemical aging. In all experiments, a sig-nificant increase in organic mass was observed with pho-tochemistry. At the peak during aging, or at the end of the experiment for experiment 6, OA increased by a fac-tor of 2.3–3.4 for high loads, whereas by only a facfac-tor of 1.4–1.8 for average loads. There was also an increase in PAH concentration with initial aging followed by a decrease with extended aging and eventual stabilization. As shown in Fig. S5 in the Supplement, PAHs abovem/z200 were stable or decreased with the initiation of photochemistry, whereas PAH signals at lower molecular weights increased. As dis-cussed previously, the PAH signals in the lowerm/z range are likely from PAHs that have undergone fragmentation in the AMS vaporization–ionization process. Functionalized PAHs are more likely to undergo fragmentation than non-functionalized PAHs (McLafferty and Turecek, 1993). In-creases in these lowerm/zPAH signals with aging are likely due to the formation of functionalized PAHs with sufficiently low volatility to partition to the particles.
Chemical composition provides additional insight into the evolution of organic aerosol with aging. Although SOA for-mation was observed in all experiments, the chemical com-position of the aged aerosol was different between the high-load and average-high-load experiments (Fig. 3). Figure 3 shows HR-AMS mass spectra of organic ions categorized by com-position. As discussed previously, mass above m/z 200 is
not fully included; however, the unaccounted mass is less than 4 % of the total organic mass. Mass spectra of the entire measuredm/zrange and all compound classes are shown in Fig. S6 in the Supplement. Experiments 1, 2, 4 and 5 were compared after an OH exposure of 1.6×10⁷molec cm−3h. The OH exposures were not measured during experiments 3 and 6, and the mass spectra in Fig. 3 correspond to 3 h aging, which is the average time after lights-on of exper-iments 1, 2, 4 and 5 corresponding to an OH exposure of 1.6×10⁷molec cm−3h.
In all mass spectra, the largest peak ism/z 44, largely from [CO2]+, formed from the decarboxylation of organic acids. For the high-load experiments, there are notable aro-matic signature ions separated by 12, 14 or 16 Da, starting at [C6H5]+(m/z77) (e.g., [C7H7]+(91), [C7H5O]+(105),
[C7H5O2]+(121), [C8H5O2]+(133)) (Fig. 3). Although
un-functionalized PAHs undergo minimal fragmentation in the AMS, functionalized aromatic compounds, including PAHs, are known to fragment when ionized by electron impact to produce other characteristic peaks in the lowerm/z region as well (i.e., <m/z77). Common fragment ions from PAHs containing electronegative substituents are at m/z 38, 39, 50, 51, 63–65 and 74–76 (McLafferty and Turecek, 1993). These peaks become more dominant with aging in the high-load mass spectra, suggesting an increase in functionalized PAHs with aging (Fig. S7 in the Supplement) (McLafferty and Turecek, 1993). There are also considerable quantities of oxygenated ions at higherm/zvalues in the high-load ex-periments (Fig. 3). For example, the fraction of total oxy-genated peaks, not including [CO2]+, at or abovem/z80 is
0.45 for high-load experiment 4, compared to only 0.15–0.20 for average-load experiment 2. This fraction is also higher than the < 0.15 observed during anα-pinene photooxidation experiment (unpublished data) (Fig. S8 in the Supplement).
300
250
200
150
100
50
0
1800 1200 600 0
30
25
20
15
10
5
0 60
50
40
30
20
10
0
-360 -240 -120 0 120 240 360 5
4
3
2
1
0 300
250
200
150
100
50
0
-360 -240 -120 0 120 240 20
15
10
5
0
50
40
30
20
10
0
900 600 300 0 -300
6
5
4
3
2
1
0 200
150
100
50
0
-360 -240 -120 0 120 240 10
8
6
4
2
0 600
500
400
300
200
100
0
-360 -240 -120 0 120 240 20
15
10
5
0
Time after lights on (min)
Organic (non-PAH) PAH
Nitrate Sulfate Ammonium Chloride
Dilution Lights on a (1)
b (2)
c (3)
d (4)
e (5)
f (6)
Organic, Nitrate (µg/m
3 )
PAH, Sulfate, Ammonium, Chloride (µg/m
3
)
Figure 2.Evolution of components measured by AMS after injection into the chamber until the end of the experiment for(a–c)average-load
experiments 1–3 and for(d–f)high-load experiments 4–6. Traces have been corrected for wall losses and dilution. The shaded areas indicate
chamber refilling (dilution) periods.
experiment (Fig. S9 in the Supplement). General PAH oxida-tion pathways are discussed in detail elsewhere (Finlayson-Pitts and (Finlayson-Pitts, 2000), as well as the formation pathways and identification of naphthalene oxidation products (Kautzman et al., 2010).
The Van Krevelen diagram provides information on the bulk organic aerosol composition and compositional changes with aging (Heald et al., 2010). Figure 5a shows that the primary emissions from the average- and high-load experi-ments occupy different regions of the plot, further illustrat-ing the bulk compositional differences between the different loading conditions. The primary emissions from the high-load experiments had a lower H : C (1.1±0.1) compared to the average-load experiments (1.47±0.09), due to the larger presence of PAHs (Fig. 5a). For example, [C16H10]+, the highest intensity primary PAH ion identified by the AMS, has an H : C of only 0.625. Primary O : C was similar for the high-load experiments (0.3±0.1) compared to the average load (0.4±0.1). With aging, all experiments showed an
ini-tial sharper decrease in H : C, followed by a more gradual decrease. Throughout aging, O : C steadily increased.
The evolution of the fraction of [CO2]+ (fCO+2) rela-tive to the fraction of [C2H3O]+ (fC2H3O+) to the to-tal organic signal also provides insight into changes in the chemical composition of the organic material with aging (Ng et al., 2011). In the AMS, [CO2]+ is formed from the
de-carboxylation of organic acids during vaporization, whereas [C2H3O]+ largely comes from fragmentation of
carbonyl-containing compounds, as well as alcohols and peroxides. Ng et al. (2011) found that the majority of atmospherically rele-vant SOA measurements fall within a certain space on thef44 vs.f43 plot. Wood combustion emissions typically lie near the left-hand side of this space, as observed here (Fig. 5b) (Heringa et al., 2011; Heringa et al., 2012).
0.06
0.04
0.02
0.00
Nitrate equivalent mass µg/m3 * 0 50 100 150 200 250 300
m/z 0.25 0.20 77 105 44 29 91 55 133 0.06 0.04 0.02 0.00
Nitrate equivalent mass µg/m3 * 0 50 100 150 200 250 300
m/z 0.26 0.24 55 44 77 29 0.06 0.04 0.02 0.00
Nitrate equivalent mass µg/m3 * 0 50 100 150 200 250 300
m/z 0.28 0.24 133 105 77 44 29 55 63 91 121 0.06 0.04 0.02 0.00
Nitrate equivalent mass µg/m3 * 0 50 100 150 200 250 300
m/z 0.16 0.14 44 29 55 73 85 99 0.06 0.04 0.02 0.00
Nitrate equivalent mass µg/m3 * 0 50 100 150 200 250 300
m/z 0.22 0.20 77 51 63 105 91 133 44 29 155 115 0.06 0.04 0.02 0.00
Nitrate equivalent mass µg/m3 * 0 50 100 150 200 250 300
m/z 0.20 0.18 55 44 29 73 Normalized intensity m/z m/z Cx CH CHO1 CHO>1 CHN CHO1N
CHO>1N
a (1) b (2) c (3) f (6) e (5) d (4)
Figure 3.AMS high-resolution mass spectra for average-load
ex-periments (a–c, experiments 1–3) and high-load experiments (d–
f, experiments 4–6). Mass spectra from experiments 1, 2, 4 and 5
correspond to an OH exposure of 1.6×10⁷molec cm−3h.
Experi-ments 3 and 6 correspond to 3 h of aging. The legend in(a)applies
to(a–f).
measured from the filters that increase with aging contain at least one carbonyl group. During aging,fCO+2 continued to increase, whereasfC2H3O+tended to decrease, supporting the more dominant formation of acids with increased aging.
The increase in functionalized naphthalene species mea-sured on the filters with aging suggests notable concentra-tions of naphthalene were in the gas phase prior to aging during the high-load experiments. Also, phenols, syringol and guaiacol are considerable fractions of wood burning emissions. For oxidation of naphthalene, phenols, syringol and guaiacol, Chhabra et al. (2011) observed near-vertical movement in f44 vs f43 space, similar to all experiments here. However, in the Van Krevelen diagram, Chhabra et al. (2011) observed movement with a slope close to−1 dur-ing oxidation of phenols, syrdur-ingol and guaiacol, whereas a smaller slope was observed during naphthalene oxidation. The slope after initial oxidation of the high-load experiments was−0.19±0.05, smaller than for the average-load experi-ments at−0.4±0.2. The smaller slope in the high-load ex-periments may be due to the higher fraction of PAHs, particu-larly oxidized naphthalene species, compared to the average-load experiments. Although there are clear differences
be-1 10 100 1000
PAH emission factor (
µ g/kg) Pyrene Fluoranthene Acephenanthrylene 2-Phenylnaphthalene Benzo[ghi]fluoranthene Cyclopenta[cd]pyrene sum Benzo[b,j,k]fluoranthene Chrysene Benz[a]anthracene Benzo[c]phenanthrene Benz[e]pyrene Anthanthrene Benzo[ghi]perylene
Indeno[1,2,3-cd]pyrene Dibenz[ah]anthracene 2-Hydroxynaphthalene
1(2H)-Acenaphthylenone
2-Naphthoic acid 9H-Fluoren-9-one
1H-Phenalen-1-one Xanthone 1,8-Naphthalic anhydride Cyclopenta(def)phenanthrenone 9,10-Anthracenedione Benzo[b]naphtho[2,3-d]furan 2,3-5,6-Dibenzoxalene 4-Oxapyrene-5-one
11H-Benzo[a]fluoren-11-one 11H-Benzo[b]fluoren-11-one 7H-Benz[de]anthracen-7-one 7H-Benzo[c]fluorene-7-one
6H-Benzo[cd]pyren-6-on Benz[a]anthracene-7,12-dione 300 200 100 0 -100
% change from primary to aged
Pyrene Fluoranthene Acephenanthrylene 2-Phenylnaphthalene Benzo[ghi]fluoranthene Cyclopenta[cd]pyrene sum Benzo[b,j,k]fluoranthene Chrysene Benz[a]anthracene Benzo[c]phenanthrene Benz[e]pyrene Anthanthrene Benzo[ghi]perylene
Indeno[1,2,3-cd]pyrene Dibenz[ah]anthracene 2-Hydroxynaphthalene
1(2H)-Acenaphthylenone
2-Naphthoic acid 9H-Fluoren-9-one
1H-Phenalen-1-one Xanthone 1,8-Naphthalic anhydride Cyclopenta(def)phenanthrenone 9,10-Anthracenedione Benzo[b]naphtho[2,3-d]furan 2,3-5,6-Dibenzoxalene 4-Oxapyrene-5-one
11H-Benzo[a]fluoren-11-one 11H-Benzo[b]fluoren-11-one 7H-Benz[de]anthracen-7-one 7H-Benzo[c]fluorene-7-one
6H-Benzo[cd]pyren-6-on
Benz[a]anthracene-7,12-dione
1.20x10⁴
1.00
Non-oxygenated PAHs Oxygenated PAHs
Non-oxygenated PAHs Oxygenated PAHs
a
b
Figure 4.Average(a)PAH emission factor and(b)percent change between primary and aged filter samples for each compound quan-titatively measured during filter analysis for high-load experiments.
tween the high- and average-load experiments in the Van Krevelen diagram, it is likely difficult to use these differences to determine wood burning or PAH contribution in ambient measurements, even when dominated by wood burning, due to variability during burns and varying burner parameters and technologies.
5 Conclusions
ex-0.30
0.25
0.20
0.15
0.10
0.05
0.00
f
CO
2
+
0.08 0.06 0.04 0.02 0.00
fC2H3O +
1.6
1.4
1.2
1.0
H:C
1.2 1.0 0.8 0.6 0.4 0.2
O:C
50x106
40
30
20
10
0
OH exposure (molec cm
-3
h)
2500
2000
1500
1000
500
0
Time after lights on (min)
0
-0.5
-2 -1
a
b
Experiment 1 Experiment 2 Experiment 3 Experiment 4 Experiment 5 Experiment 6 Primary before dilution
Figure 5. (a)Van Krevelen diagram and(b)fCO+2 as a function
offC2H3O+determined from HR-AMS analysis. Experiments 1,
2, 4 and 5 are colored by OH exposure. Experiments 3 and 6 are colored in greyscale by minutes after lights-on. Thick black markers indicate the primary point for each experiment, immediately after injection and prior to dilution. For comparison, the region in which OA measurements are typically located (Ng et al., 2011) is drawn
on(b).
ample, using yields from the oxidation of PAHs in the lab-oratory, Chan et al. (2009) estimated that gas-phase PAHs, despite being only half the concentration of light aromatics, produce 4 times more SOA during the first 12 h of oxidation of emissions from the burning of pine wood under normal conditions. The toxicological effects on human health of the primary emissions from average and higher load burning and the changes in chemical composition with aging will be de-tailed in a future publication.
The Supplement related to this article is available online at doi:10.5194/acp-15-2825-2015-supplement.
Acknowledgements. The research leading to these results has received funding from the European Community’s Seventh Framework Programme (FP7/2007–2013) under grant agreement no. 290605 (PSI-FELLOW), from the Competence Center En-vironment and Sustainability (CCES) (project OPTIWARES), from the Swiss National Science Foundation (WOOSHI, grant no. 140590), from EUROSTARS grant E!4825 FC Aeth, and from JR-KROP grant 3211-11-000519. Support from the German Science Foundation (DFG, WooShi-project, grant ZI 764/5-1) and the Virtual Helmholtz Institute HICE – Aerosol and Health (Helmholtz Association, Berlin, Germany) is acknowledged.
Edited by: A. Kiendler-Scharr
References
Aiken, A. C., Decarlo, P. F., Kroll, J. H., Worsnop, D. R., Huff-man, J. A., Docherty, K. S., Ulbrich, I. M., Mohr, C., Kimmel, J. R., Sueper, D., Sun, Y., Zhang, Q., Trimborn, A., Northway, M., Ziemann, P. J., Canagaratna, M. R., Onasch, T. B., Alfarra, M. R., Prévôt, A. S. H., Dommen, J., Duplissy, J., Metzger, A., Baltensperger, U., and Jimenez, J. L.: O / C and OM / OC ra-tios of primary, secondary, and ambient organic aerosols with high-resolution time-of-flight aerosol mass spectrometry, Envi-ron. Sci. Technol., 42, 4478–4485, 2008.
Allan, J. D., Delia, A. E., Coe, H., Bower, K. N., Alfarra, M. R., Jimenez, J. L., Middlebrook, A. M., Drewnick, F., Onasch, T. B., Canagaratna, M. R., Jayne, J. T., and Worsnop, D. R.: A generalised method for the extraction of chemically resolved mass spectra from Aerodyne aerosol mass spectrometer data, J. Aerosol Sci. 35, 909–922, 2004.
Andreae, M. O. and Merlet, P.: Emission of trace gases and aerosols from biomass burning, Global Biogeochem. Cy., 15, 955–966, 2001.
Atkinson, R. and Aschmann, S. M.: Kinetics of the reactions of naphthalene, 2-methylnaphthalene, and 2,3-dimethylnaphthalene
with OH radicals and with O3at 295±1 K, Int. J. Chem. Kinet.,
18, 569–573, 1986.
Bari, M. A., Baumbach, G., Brodbeck, J., Struschka, M., Kuch, B., Dreher, W., and Scheffknecht, G.: Characterisation of particu-lates and carcinogenic polycyclic aromatic hydrocarbons in win-tertime wood-fired heating in residential areas, Atmos. Environ., 45, 7627–7634, 2011.
Barmet, P., Dommen, J., DeCarlo, P. F., Tritscher, T., Praplan, A. P., Platt, S. M., Prévôt, A. S. H., Donahue, N. M., and Baltensperger, U.: OH clock determination by proton transfer reaction mass spectrometry at an environmental chamber, Atmos. Meas. Tech., 5, 647–656, doi:10.5194/amt-5-647-2012, 2012.
Bente, M., Sklorz, M., Streibel, T., and Zimmermann, R.: Thermal desorption-multiphoton ionization time-of-flight mass spectrom-etry of individual aerosol particles: a simplified approach for on-line single-particle analysis of polycyclic aromatic hydrocarbons and their derivatives, Anal. Chem., 81, 2525–2536, 2009. Bølling, A. K., Pagels, J., Yttri, K. E., Barregard, L., Sallsten, G.,
Boman, C., Nordin, A., Westerholm, R., and Pettersson, E.: Evalua-tion of a constant volume sampling setup for residential biomass fired appliances – influence of dilution conditions on particulate and PAH emissions, Biomass Bioenerg., 29, 258–268, 2005. Burtscher, H., Baltensperger, U., Bukowiecki, N., Cohn, P., Hüglin,
C., Mohr, M., Matter, U., Nyeki, S., Schmatloch, V., Streit, N., and Weingartner, E.: Separation of volatile and non-volatile aerosol fractions by thermodesorption: instrumental develop-ment and applications, J. Aerosol Sci. 32, 427–442, 2001. Chan, A. W. H., Kautzman, K. E., Chhabra, P. S., Surratt, J. D.,
Chan, M. N., Crounse, J. D., Kürten, A., Wennberg, P. O., Flagan, R. C., and Seinfeld, J. H.: Secondary organic aerosol formation from photooxidation of naphthalene and alkylnaph-thalenes: implications for oxidation of intermediate volatility or-ganic compounds (IVOCs), Atmos. Chem. Phys., 9, 3049–3060, doi:10.5194/acp-9-3049-2009, 2009.
Chhabra, P. S., Ng, N. L., Canagaratna, M. R., Corrigan, A. L., Rus-sell, L. M., Worsnop, D. R., Flagan, R. C., and Seinfeld, J. H.: El-emental composition and oxidation of chamber organic aerosol, Atmos. Chem. Phys., 11, 8827–8845, doi:10.5194/acp-11-8827-2011, 2011.
Crippa, M., DeCarlo, P. F., Slowik, J. G., Mohr, C., Heringa, M. F., Chirico, R., Poulain, L., Freutel, F., Sciare, J., Cozic, J., Di Marco, C. F., Elsasser, M., Nicolas, J. B., Marchand, N., Abidi, E., Wiedensohler, A., Drewnick, F., Schneider, J., Borrmann, S., Nemitz, E., Zimmermann, R., Jaffrezo, J.-L., Prévôt, A. S. H., and Baltensperger, U.: Wintertime aerosol chemical compo-sition and source apportionment of the organic fraction in the metropolitan area of Paris, Atmos. Chem. Phys., 13, 961–981, doi:10.5194/acp-13-961-2013, 2013.
DeCarlo, P. F., Kimmel, J. R., Trimborn, A., Northway, M. J., Jayne, J. T., Aiken, A. C., Gonin, M., Fuhrer, K., Horvath, T., Docherty, K. S., Worsnop, D. R., and Jimenez, J. L.: Field-deployable, high-resolution, time-of-flight aerosol mass spectrometer, Anal. Chem., 78, 8281–8289, 2006.
Donahue, N. M., Robinson, A. L., Stanier, C. O., and Pandis, S. N.: Coupled partitioning, dilution, and chemical aging ofsemivolatile organics, Environ. Sci. Technol., 40, 2635–2643, 2006. Dzepina, K., Arey, J., Marr, L. C., Worsnop, D. R., Salcedo, D.,
Zhang, Q., Onasch, T. B., Molina, L. T., Molina, M. J., and Jimenez, J. L.: Detection of particle-phase polycyclic aromatic hydrocarbons in Mexico City using an aerosol mass spectrome-ter, Int. J. Mass Spectrom., 263, 152–170, 2007.
Elsasser, M., Busch, C., Orasche, J., Schön, C., Hartmann, H., Schnelle-Kreis, J., and Zimmermann, R.: Dynamic changes of the aerosol composition and concentration during different burn-ing phases of wood combustion, Energ. Fuel., 27, 4959–4968, 2013.
Eriksson, A. C., Nordin, E. Z., Nystrom, R., Pettersson, E., Swi-etlicki, E., Bergvall, C., Westerholm, R., Boman, C., and Pagels, J. H.: Particulate PAH emissions from residential biomass com-bustion: time-resolved analysis with aerosol mass spectrometry, Environ. Sci. Technol., 48, 7143–7150, 2014.
Fine, P. M., Cass, G. R., and Simoneit, B. R. T.: Chemical char-acterization of fine particle emissions from fireplace combustion of woods grown in the northeastern United States, Environ. Sci. Technol., 35, 2665–2675, 2001.
Fine, P. M., Cass, G. R., and Simoneit, B. R. T.: Chemical charac-terization of fine particle emissions from the fireplace
combus-tion of woods grown in the southern United States, Environ. Sci. Technol., 36, 1442–1451, 2002a.
Fine, P. M., Cass, G. R., and Simoneit, B. R. T.: Organic compounds in biomass smoke from residential wood combustion: emissions characterization at a continental scale, J. Geophys. Res.-Atmos., 107, 8349, doi:10.1029/2001JD000661, 2002b.
Fine, P. M., Cass, G. R., and Simoneit, B. R. T.: Chemical charac-terization of fine particle emissions from the fireplace combus-tion of wood types grown in the midwestern and western United States, Environ. Eng. Sci., 21, 387–409, 2004a.
Fine, P. M., Cass, G. R., and Simoneit, B. R. T.: Chemical character-ization of fine particle emissions from the wood stove combus-tion of prevalent United States tree species, Environ. Eng. Sci., 21, 705–721, 2004b.
Finlayson-Pitts, B. J. and Pitts, J. N. J.: Chemistry of the Upper and Lower Atmosphere – Theory, Experiments, and Applications, Academic Press, San Diego, 2000.
Fitzpatrick, E. M., Ross, A. B., Bates, J., Andrews, G., Jones, J. M., Phylaktou, H., Pourkashanian, M., and Williams, A.: Emission of oxygenated species from the combustion of pine wood and its relation to soot formation, Process Saf. Environ., 85, 430–440, 2007.
Fu, P. P., Xia, Q., Sun, X., and Yu, H.: Phototoxicity and envi-ronmental transformation of polycyclic aromatic hydrocarbons (PAHs) – light-induced reactive oxygen species, lipid peroxida-tion, and DNA damage, J. Environ. Sci. Heal. C, 30, 1–41, 2012. Gelencsér, A., May, B., Simpson, D., Sánchez-Ochoa, A., Kasper-Giebl, A., Puxbaum, H., Caseiro, A., Pio, C., and Legrand,
M.: Source apportionment of PM2.5 organic aerosol over
Europe: primary/secondary, natural/anthropogenic, and fos-sil/biogenic origin, J. Geophys. Res.-Atmos., 112, D23S04, doi:10.1029/2006JD008094, 2007.
Gianini, M. F. D., Fischer, A., Gehrig, R., Ulrich, A., Wichser, A., Piot, C., Besombes, J. L., and Hueglin, C.: Comparative source apportionment of PM10 in Switzerland for 2008/2009 and 1998/1999 by Positive Matrix Factorisation, Atmos. Envi-ron., 54, 149–158, 2012.
Gorin, C. A., Collett, J. L., and Herckes, P.: Wood smoke contribu-tion to winter aerosol in Fresno, CA, J. Air Waste Manage., 56, 1584–1590, 2006.
Grieshop, A. P., Donahue, N. M., and Robinson, A. L.: Laboratory investigation of photochemical oxidation of organic aerosol from wood fires 2: analysis of aerosol mass spectrometer data, At-mos. Chem. Phys., 9, 2227–2240, doi:10.5194/acp-9-2227-2009, 2009a.
Grieshop, A. P., Logue, J. M., Donahue, N. M., and Robinson, A. L.: Laboratory investigation of photochemical oxidation of or-ganic aerosol from wood fires 1: measurement and simulation of organic aerosol evolution, Atmos. Chem. Phys., 9, 1263–1277, doi:10.5194/acp-9-1263-2009, 2009b.
Heald, C. L., Kroll, J. H., Jimenez, J. L., Docherty, K. S., DeCarlo, P. F., Aiken, A. C., Chen, Q., Martin, S. T., Farmer, D. K., and Artaxo, P.: A simplified description of the evolution of organic aerosol composition in the atmosphere, Geophys. Res. Lett., 37, L08803, doi:10.1029/2010GL042737, 2010.

![Table 2. PAH base ions included in the AMS analysis. Ion Nominal m/z [C 10 H 8 ] + 128 [C 11 H 7 ] + 139 [C 12 H 8 ] + 152 [C 13 H 7 ] + 163 [C 13 H 9 ] + 165 [C 12 H 8 O] + 168 [C 14 H 8 ] + 176 [C 14 H 10 ] + 178 [C 15 H 9 ] + 189 [C 13 H 8 O 2 ] + 196 [](https://thumb-eu.123doks.com/thumbv2/123dok_br/17146169.239858/6.918.485.825.107.537/table-base-ions-included-ams-analysis-ion-nominal.webp)