A
rti
g
o
*e-mail: [email protected]
APPLICATION OF PARAFAC AND OPLS-DA ANALYSES ON HPLC FINGERPRINTS FOR THE CHARACTERIZATION OF Hibiscus sabdariffa CALYXES
Freddy A. Bernal, Luisa L. Orduz-Díazand Ericsson Coy-Barrera*
Departamento de Química, Facultad de Ciencias Básicas y Aplicadas, Universidad Militar Nueva Granada, AA 49300, Cundinamarca, Colombia
Recebido em 16/05/2015; aceito em 13/10/2015; publicado na web em 22/01/2016
The calyxes of Hibiscus sabdariffa are used in traditional medicine around the world. However, quality assurance protocols and chemical variability have not been previously analyzed. In the present study, chemical characterization of a set of samples of H. sabdariffa calyxes commercialized in Colombia was accomplished with the aim to explore the chemical variability among them. Chemometrics-based analyses on the data obtained from the HPLC-UV-DAD-derived profiles were then performed. Thus, the pre-processed single-wavelength data were subjected to principal component analysis (PCA). The PCA-derived results evidenced different groups which were well-correlated to the corresponding total phenolic and total anthocyanin contents. Multi-wavelength chromatographic (HPLC-UV-DAD surfaces) data were additionally examined via parallel factor analysis (PARAFAC) as data reduction method and the obtained loadings were subsequently submitted to PCA and orthogonal partial least squares discriminant analysis (OPLS-DA). Results were thus consistent with those from single-wavelength data. PCA loadings were employed to determine those chemical components responsible for the data variance and OPLS-DA model, constructed from PARAFAC loadings, and indicated differentiation according total anthocyanin contents among samples. The present chemometric analysis therefore demonstrated to be an excellent tool for differentiation of H. sabdariffa calyxes according to their chemical composition.
Keywords: H. sabdariffa; Roselle; chemometrics; fingerprinting; PARAFAC.
INTRODUCTION
Hibiscus sabdariffa is popularly known as ‘Roselle’ or ‘Flor de Jamaica’ around the world. The calyxes of this plant have been em-ployed in the preparation of medicinal teas in order to treat several health disorders.1-3H. sabdariffa calyxes have been reported as an important anthocyanin-containing plant material.3-6 Other chemical constituents are included such as phenolic acids and flavonol glycosi-des.3,6-8 Anthocyanin and phenolic contents are directly related to the maturity degree9 as well as to the seasonal changes.4 These compounds confer a markedly high antioxidant power to the decoctions of their calyxes.10 Spite of the biological activity and the increasing demand of the H. sabdariffa calyxes worldwide, there is lack of information on chemical variability and its effect on biological effectiveness. In Colombia, H. sabdariffa calyxes are employed to prepare both cold and hot beverages attributing them significant medicinal benefits. Due to the great demand of Roselle in Colombia, their cultivation has rapidly increased and extended to several zones of the country. However, there are not quality control procedures. Even the variability within cultivars around the country has not been analyzed.
A practical method to ensure consistency of the herbal medicines can be accomplished by employing the concept of phytoequivalence, which involves fingerprint analysis. In other words, with the help of the fingerprints, the authentication and identification of the herbal medicines can be obtained. Moreover, both evident and minor di-fferences between the fingerprints in combination with multivariate analysis could be established. The application of chemometrics to quality assurance of herbal medicines has increased in recent years and then reviewed.11 Several reports have been published regarding to the usefulness of chemometrics in natural product and food che-mistry.12-16 Among these, HPLC-DAD has been demonstrated as a useful tool to accomplish fingerprinting.
Therefore, the present work shows the chemical profiling of Colombian calyxes of H. sabdariffa by means of HPLC-DAD. Unsupervised and supervised chemometrics based on PCA, PARAFAC and OPLS-DA analyses are applied to two different data sets of chromatographic profiles in order to demonstrate similarities and/or differences throughout them. So far, there is not previously report focusing on the chemical characterization and differentiation of H. sabdariffa calyx extracts using chromatographic data and che-mometrics. Moreover, the present study might be taken as the first step in a quality control strategy to Colombian samples.
EXPERIMENTAL Reagents
Gallic acid and cyanidin 3-O-glycoside were purchased from Sigma-Aldrich Chemical Co. Folin-Ciocalteu reagent, BHT (3,5-di--tert-butyl-4-hydroxytoluene), formic acid, and ethanol were acquired from Merck Chemical Co.
Plant material and extraction
H. sabdariffa calyxes (n = 22) were randomly purchased on local markets and healthfood stores at Bogotá, Colombia in August 2012. All samples corresponded to Sudan cultivar-derived reddish calyxes cultivated in Colombia. Samples were obtained as dried raw material. Each sample was powdered and stored at 4 °C until analyses.
Total Phenolic content
Folin-Ciocalteu reagent assay was used to determine total pheno-lic content (TPC).17 Briefly, sample solution was diluted with water (1:25). Dilution (400 µL) was mixed with freshly, diluted (1:10) Folin-Ciocalteu reagent (800 µL), was then kept during 3 min and 7.5% Na2CO3 (3.0 mL) was added. After 2 h of incubation at room temperature in the dark, absorbance at 765 nm was measured. Each measurement was performed in triplicate. TPC was calculated as mg gallic acid equivalent per g dried sample (mg GAE/g DS) by employing a calibration curve.
Total Anthocyanin content
The pH differential method was employed to measure total anthocyanin content (TAC).18 Briefly, test dilutions (3.0 mL) were separately prepared mixing fresh sample solution (100 µL) with buffer pH 1.0 and pH 4.5 (1:30), and the absorbance at 520 nm and 700 nm was then measured. Each measurement was performed in triplicate. TAC was calculated as mg cyanidin 3-O-glycoside equivalent per g dried sample (mg C3GE/g DS) as follows:
mgC3GE/g DS =A×MW×DF×V×10 3
e×l×SW
where A = (A520nm – A700nm)pH 1.0 – (A520nm – A700nm)pH 4.5; MW as mole-cular weight for cyanidin 3-O-glycoside (C3G) (449.2 g/mol); DF = dilution factor; V = total volume of sample solution after extraction, in L; 103 = factor for conversion from g to mg; ε (molar extinction coefficient) = 26,900 L mol-1 cm-1, for C3G; l = path length, in cm; and SW = sample weight used for extraction, in g.
Chromatographic Analyses HPLC-UV-DAD analysis
HPLC profiles were recorded on a Shimadzu UFLC Prominence system. A Shimadzu Premier® C18 column (150 x 4.6 mm; 5 µm) was used (0.6 mL/min flow rate; 30 °C column oven temperature). 1% formic acid in acetonitrile and 1% formic acid in water were employed as mobile phases A and B, respectively, in gradient elution as follows: 0 min, 0% A; 7 min, 20% A; 10 min, 25% A; 13 min, 0% A; 20 min, 0% A. Data were acquired each 1.2 nm between 200 – 900 nm. The monitoring wavelength was selected to 520 nm. Extracts were diluted in 1:20 ratio and then 50 µL were injected.
HPLC-ESI-MS analysis
HPLC- MS profiles were recorded on a Liquid Chromatograph Mass Spectrometer LCMS-2020 (Shimadzu Corp, Japan) system equipped with a single quadrupole analyzer and an electrospray ion source (ESI). A Synergi RP C18 (Phenomenex) (150 x 4.6 mm; 4 µm) was employed (1.0 mL/min flow rate; 30°C column oven temperature). 1% formic acid in acetonitrile and 1% formic acid in water were used as mobile phases A and B, respectively, in gradient elution as follows: 0 min, 0% A; 10 min, 10% A; 11 min, 10% A; 15 min, 30% A; 17 min, 0% A. Extracts were diluted in 1:20 ratio and then 5 µL were injected. ESI was simultaneously operated in positive and negative ion mode (scan 100 – 800 m/z; 250 °C CDL temperature; 1.2 kV detector voltage; 1.5 L min−1 nebulizing gas flow rate; 9.0 L min−1 drying gas flow rate).
Data Analysis
Chromatographic data were divided in two different data sets. The first one, absorbance at 520 nm as function of time was exported
as 2D ASCII files for each sample and a matrix of 1876 x 22 points was then built. The second one, response surface obtained for each sample by HPLC-DAD was exported as 2D ASCII files and a three--way array was then built (951 x 491 x 22). All data analysis were performed using MATLAB R2013a (The Mathworks, Inc.) on a PC (Core i5 processor; 8 GB RAM; on Microsoft Windows 7).
Two-way array raw data were submitted to chromatographic peak alignment as first step of pretreatment prior to the statistical analysis. Correlation optimized warping (COW) algorithm was employed to the alignment process.19 COW algorithm from Warping Toolbox supplied by The Quality and Technology Website was used to this process.20 Normalization and Pareto Scaling processes21 were then applied on the data set by means of algorithms coded by authors.
Principal Component Analysis (PCA)22 was implemented on the two-way array after corresponding above-mentioned pre-treatment. Results were presented as score plots. The PCA algorithm included into Eigenvector PLS Toolbox for Matlab was employed.23
Parallel factor analysis (PARAFAC)24 was individually performed on each sample in the three-way array by means of the algorithm supplied by The Quality and Technology Website.20 Prior to analysis, core consistency diagnostic was implemented in order to provide an appropriate number of components. Three components were de-monstrated to be able to describe the PARAFAC model according to the core consistency diagnostic tool and the corresponding residual sum of squares. No restrictions on PARAFAC model were taken into account in the present research. Resultant first loadings were used to build a final two-way array (951 x 22) which was then submitted to PCA as described above. In addition, an OPLS-DA model was cons-tructed for classification of the samples using the PARAFAC-derived loadings. TPC and TAC ranges were used to define the classes (class 1: 12.5-25.0; class 2: 25.0-30.3 for TPC values; class 1: 7.0-12.0; class 2: 0.8-7.0 for TAC values). A single-Y OPLS model using TAC as Y variable was also constructed from the PARAFAC-derived loadings. OPLS-DA and OPLS models were created using SIMCA 14 software (Umetrics Inc.).
RESULTS AND DISCUSSION Chemical analysis
Chromatographic profiling
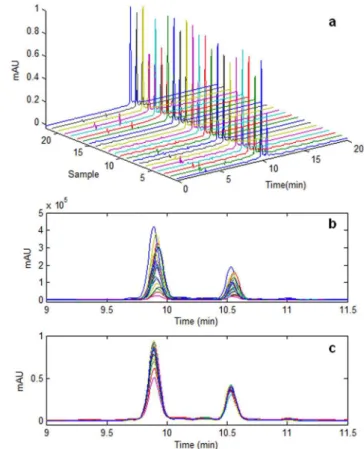
HPLC-UV-DAD profiles were monitored at 520 nm in order to detecwt anthocyanin-related compounds. This analysis was useful to demonstrate that there are two main anthocyanins in Colombian H. sabdariffa calyxes (Figure 1). These findings are in agreement with those previously reported to H. sabdariffa calyxes around the world.4,7,8
Statistical analysis
Data pre-processing
In order to improve the quality of the data as well as decrease their inconsistency and noise, three pre-processing algorithms were applied on the raw data. The alignment was accomplished by COW19 and the reference chromatographic profile was arbitrarily assigned as sample 1. The adequate parameters such as slack variable and segment length were achieved by means of the algorithm package supplied by The Quality and Technology Website.20 Figure 1a shows the aligned, normalized chromatographic profiles of the twenty-two Colombian Roselle extracts. Figure 1b and 1c (before and after peak alignment, respectively) indicated a perfect correction of the retention time shifting into LC-derived profiles after warping processing by COW. Additionally, Pareto scaling was applied to eliminate the unfavorable effects between LC profiles (e.g., variation due to injection of uneven concentrations).
Multivariate analysis to the two-way array (single-wavelength data)
PCA was applied on the pre-processed chromatographic data (two-way array) and the differences were then established. The PCA-derived score plot (Figure 2a) shows that samples 17 and 19 were
located distant from others demonstrating significant difference of these samples from the rest. However, the above mentioned samples were located in remote positions on the score plot so that these could be defined as outliers in the used model. Therefore, Hotelling’s T2 and Q residuals were analyzed. It let us to designate the outliers. Samples 12, 17 and 19 resulted as outliers and they were then discarded for further analyses. Figure 2 shows the PCA-derived score plots (PC1– PC2) of the normalized, aligned data before (a) and after (b) removal of the outliers. The two first PC on the constructed model were able to explain 85.78% and 83.36%, respectively, total variance of the variable set. The existence of these outliers could be a consequence of alterations in the plant conditions involving soil type, ecological environment, weather, collecting season, among others. Once the outliers were discarded, samples were remained in similar distribu-tion on the PC score plane but relative grouping from Hierarchical Clustering Analysis (HCA) was changed. PCA score plots showed explicit differentiation between some samples (at least five groups). Thus, samples 12, 13, 15, 16, 20 and 10 resulted spatially far from samples 6, 2, 7 and 9 (together with 17 and 19), demonstrating a direct relationship with their TPC values. The first group exhibited high TPC values while the second one had low TPC values. TPC for groups A, B and C were not significantly different (at 95% level). Multivariate analysis to the three-way array (multi-wavelength data)
In order to obtain larger information regarding the chemical composition variability to be responsible for the above-mentioned results, HPLC-UV-DAD surfaces were employed. As the first step, PARAFAC model was applied. Three components were required to explain all variance according to the residual sum of squares and the core consistency diagnostics. The first loading of the model Table 1. Total phenolic and total anthocyanin contents of extracts of
Colom-bian H. sabdariffa calyxes
Sample TPC (mg GAE/g DS) TAC (mg C3GE/g DS)
1 28.7 ± 1.4abc 6.0 ± 0.4abcde
2 23.0 ± 0.6ef 3.5 ± 0.2cde
3 23.6 ± 1.9def 4.4 ± 0.2cde
4 24.6 ± 1.1bcde 3.9 ± 0.2cde
5 30.3 ± 2.4a 4.7 ± 0.2bcde
6 17.1 ± 2.0gh 1.7 ± 0.3de
7 26.3 ± 3.3abcde 4.6 ± 0.1bcde
8 26.1 ± 1.6abcde 3.9 ± 1.3cde
9 22.9 ± 0.6ef 3.6 ± 0.3cde
10 26.8 ± 1.2abcde 8.3 ± 2.9abcd
11 24.5 ± 1.2cde 8.8 ± 1.9abc
12 24.6 ± 1.4cde 8.5 ± 2.2abc
13 29.4 ± 0.4ab 11.7 ± 7.7a
14 26.5 ± 2.6 abcde 6.3 ± 4.3abcde
15 28.4 ± 1.0abcd 11.7 ± 2.1a
16 28.2 ± 1.2abcd 12.0 ± 0.6a
17 19.6 ± 0.6fg 1.7 ± 0.4de
18 24.9 ± 0.7bcde 7.7 ± 1.2abcd
19 12.5 ± 0.1h 0.8 ± 0.1e
20 22.2 ± 2.3ef 11.2 ± 0.2ab
21 19.0 ± 1.1fg 4.8 ± 0.0bcde
22 19.2 ± 0.1fg 8.9 ± 0.3abc
Values represent the mean of triplicates ± standard deviation. Different letters in the same column indicate statistical difference by Tukey test (p<0.05).
Figure 1. HPLC profiles (520 nm) of the extracts of Colombian Hibiscus
retained chromatographic profile information, generating an extracted chromatogram from all range of analyzed wavelength and the data mining was thus achieved (Figure 3a). Observed peaks in Figure 3a represented compounds with significant UV-Vis absorption in the 250-800 nm range. As expected, peaks corresponding to the two main anthocyanin-type compounds resulted to be present. A new matrix with these data was assembled and the PCA was then performed. Two first PC on the constructed model were able to explain 54.83% and 17.91%, respectively, total variance of the variable set. Pareto scaling was also carried out before analysis. Moreover, peak alignment was evaluated; however the algorithm was demonstrated to be inadequate and it was not therefore included.
Figure 3a shows the PARAFAC-derived first loading to samples 13, 8, 18 and 17, which correspond to representative high TPC, medium TPC and low TPC values-possessing samples, respectively (Table 1). Clear differences can be found in that figure regarding to the presence/absence of certain compounds as well as in the relative proportion of some of them. Score plots appear in Figure 3b. Five groups were also defined here from HCA (I-V denoted by colored ellipses). PCA from three-way data exhibited a similar number of clusters than that by two-way data. Significantly differences to samples 17 and 19 from the rest were again demonstrated (Figure 3b). In the same way, samples 10, 20, 16 and 13 were grouped in the PCA score plot (group I) being these samples those with higher TPC values. Therefore, PCA clustering is evidently supported on the chemical composition of the analyzed samples, which might be useful in further studies. Moreover, the presence of several groups
with high to medium TPC let us to confirm that chemical composi-tion of analyzed samples were very variable regarding to chemical constituents possessing UV-Vis absorption.
UV-Vis and MS on-line acquired spectra of these components were analyzed to get structural information regarding the compounds responsible of the chemical variability of the Colombian Roselle samples (denoted by bold numbers). The structural assignment of the detected compounds was proposed (shown in Table 2) by com-parison of the obtained UV and MS spectra with previously reported chemical components of H. sabdariffa calyxes.7,8 The most variable components within analyzed samples were established as anthocya-nins and chlorogenic acid-related derivatives. Our analyses on the PCA score plot and the extracted chromatograms from PARAFAC model (Figure 3) let us to infer that samples with low TPC values (no grouped in PCA) are rich in compounds 1, 3 and 6. All of them were not anthocyanin-related substances (Table 2). Meanwhile, anthocyanin-type compounds (4 and 5) were present in higher quan-tities in samples with higher TPC (group I).
Additionally, PCA-derived first loading were compared with the input data of the three-way array (illustrated in Figure 4a). The explained variance was supported on the four main constituents along with at least the six minor ones. Variability of the analyzed profiles resulted to be affected by compounds 4 and 5 towards the negative side of the PC1-axis while compounds 1 and 6 were related towards
Figure 2. PC1-PC2 score plots of the fingerprints of the 22 samples of Hibiscus
sabdariffa (a) and without outliers (b)
Figure 3. Extracted chromatograms from PARAFAC for representative samples
the positive one (blue line in Figure 4a). Influence of compounds 1-10 on the PC’s was analyzed and presented as a loading bar plot (Figure 4b). This plot confirmed that the first principal component (PC1) was highly, positively influenced by the compounds 1 and 6 while it was negatively influenced by peaks 4 and 5. Similarly, discrimination across the second principal component (PC2) was due to higher levels of compounds 1 and 5, influencing the PC2 in the negative direction. Compound 3 influenced the PC2 across the positive direction. Further analysis of the data reveals that samples 6,
17 and 19 contain higher levels of 1, 3, 5 and 6. Samples 17 and 19 contain lower levels of 2, 4, 7-10. Additionally, samples 13 and 10 contain higher levels of 3, 4 and 5 while 6-10 appear in lower levels. Compounds 1 and 2 were presented in very low levels or even absent in samples 13 and 10, which influenced the PC1 in positive direction. Anthocyanins 4 and 5 resulted to be present in very low level in the samples with lower TPC and TAC values as mentioned above. This effect was complemented with increased quantities of 1, 3 and 6 (all weighting for the positive direction of PC1). Sample 17 also presented a very low level of 5 and high level of 6. This fact was a decisive discriminating factor along PC2 as above mentioned and therefore it was responsible for the differentiation of samples 5, 2 and 6 from 17. Finally, samples 10, 20, 13 and 16 possess higher levels of 4 than that for the rest of the samples being compound 4 the main responsible of the explained variability between them. The PC2 is strongly, negatively influenced by compounds 1 and 5 meanwhile it is positively influenced by compound 3 (Figure 4b). Therefore, high TPC and TAC measurements are directly related to high contents of compounds 4 and 5, meanwhile low TPC and TAC contents can be related to high contents of compounds 1 and 6. Moreover, intra--group differentiation (i.e., between samples 20 and 1) can be due to differences on the concentration/level of compounds 1, 3 and 5. Thus, group I is completely different from group V by compounds 1, 3, 4, 5 and 6. For their part, group II and III are mainly differentiated by compounds 3 and 5.
An explanation to the inverse relationship between level/concen-tration of 4 and 6 in the extracts may be inferred from their general biosynthetic pathways. In this way, the biosynthetic pathway of 4 is related to that of 6 by a simple C6C3 scaffold: p-coumaric acid. From this intermediate, caffeic acid is produced and subsequently it is coupled to quinic acid affording 6.25 The p-coumaric acid is a fundamental intermediate to produce aromatic polyketides which are later converted in flavonoids including anthocyanins such as 4.25 Thereof, compounds 4 and 6 can be inversely related due to two discriminating metabolic pathways with p-coumaric acid as a pivotal common intermediate. Nevertheless, it is not clear how is preferred one way or what is the discriminating factor for it. Similarly, differentiation across PC2 is due to variable quantities of 4 and 5. These compounds are commonly produced simultaneously, although regulation or selective metabolite production could be limited from naringenin and dihydrokaempferol as key intermediate.26,27
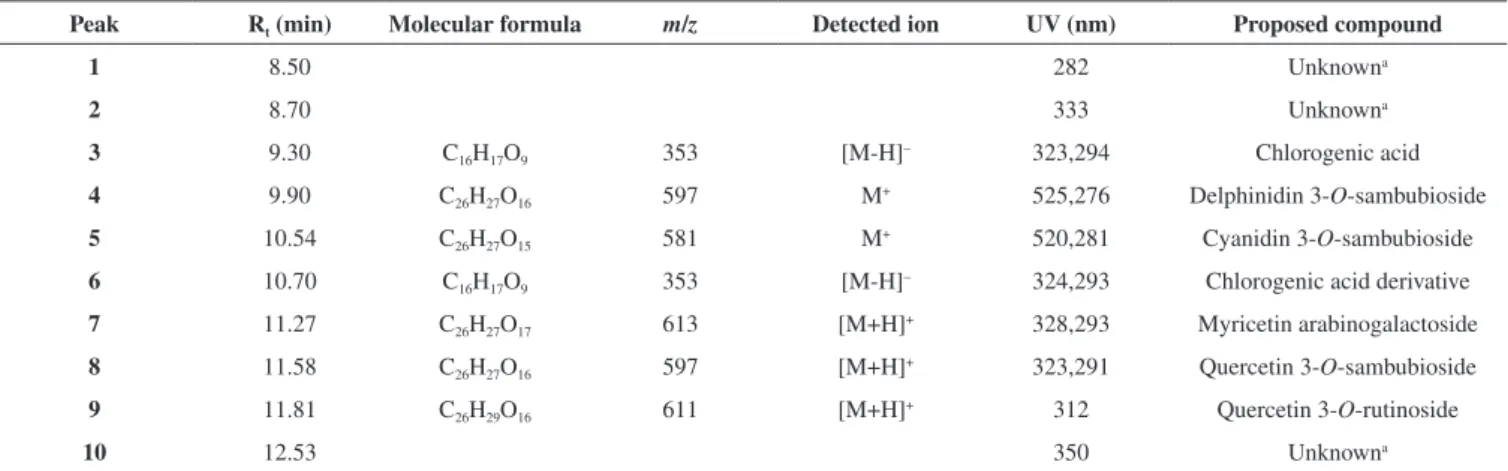
Apparent discrimination of samples according to PCA from PARAFAC extracted information let us to infer that supervised me-thods can be suitable for characterization of the chemical variability of H. sabdariffa. In this way, three-way array–derived data was Table 2. Identified secondary metabolites detected by LC-ESI-MS
Peak Rt (min) Molecular formula m/z Detected ion UV (nm) Proposed compound
1 8.50 282 Unknowna
2 8.70 333 Unknowna
3 9.30 C16H17O9 353 [M-H]– 323,294 Chlorogenic acid
4 9.90 C26H27O16 597 M
+ 525,276 Delphinidin 3-O-sambubioside
5 10.54 C26H27O15 581 M+ 520,281 Cyanidin 3-O-sambubioside
6 10.70 C16H17O9 353 [M-H]– 324,293 Chlorogenic acid derivative
7 11.27 C26H27O17 613 [M+H]
+ 328,293 Myricetin arabinogalactoside
8 11.58 C26H27O16 597 [M+H]+ 323,291 Quercetin 3-O-sambubioside
9 11.81 C26H29O16 611 [M+H]
+ 312 Quercetin 3-O-rutinoside
10 12.53 350 Unknowna
aNot identified by means of UV-Vis and MS spectra.
Figure 4. Effect of the compounds 1-10 on the PC’ first loading (blue line)
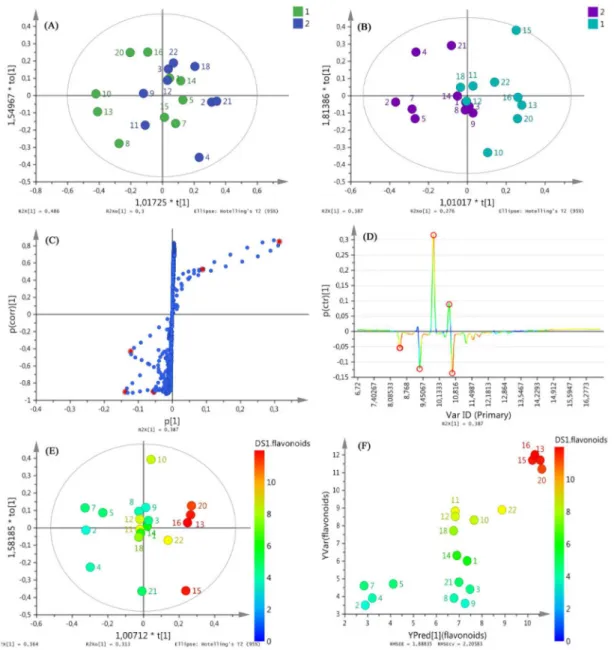
Figure 5. Supervised analyses to the three-way array (multi-wavelength data). OPLS-DA score plot using TPC classes (A); OPLS-DA score plot using TAC classes (B); OPLS-DA-derived S-plot using TAC classes (C); OPLS-DA-derived S-line using TAC classes (D); Single-Y OPLS score plot using TAC as Y variable (E); OPLS-derived Observed vs. Predicted plot using TAC as selected response (F)
then submitted to Orthogonal Partial Least Squares – Discriminant Analysis (OPLS-DA). Such analysis was accomplished in terms of TPC and TAC values as classification variables as described in experi-mental section. The resulting score plots are exposed in Figure 5a and 5b, respectively. TPC demonstrated to be inappropriate classification variable for the tested samples. In other words, H. sabdariffa samples were not discriminated as function of TPC classes. In contrast, TAC was found to be a more suitable classification variable although incomplete discrimination was observed for samples 18, 11, 12, 14, 1, 8, 3, and 9. An S-plot derived from discrimination across TAC was obtained in OPLS-DA (Figure 5c) which can be related with the corresponding loading line plot (Figure 5d). Peaks responsible for discrimination in OPLS-DA are shown in red circles on Figure 5d. Samples arranged along the positive first component corresponded to those with higher TAC values while samples along the negative first component resulted to be those with lower values. Compounds 4 and 5 were demonstrated as responsible for the discrimination towards the positive direction of the first OPLS-DA component. Therefore, the presence of the two antocyanins resulted in a key factor for
OPLS (Figure 5f). Only samples 3, 8 and 9 exhibited a deviated behavior from the model.
CONCLUSIONS
In this study, HPLC fingerprints of Colombian H. sabdariffa calyxes were developed. The use of total chromatographic raw data matrix afforded a holistic strategy for examining the possible diffe-rences between samples in a particular production batch and even among different crops around Colombia when it is coupled to using PARAFAC analysis. The present strategy can result improved in com-parison to the existing authentication protocols based on few chemical markers commonly ignoring minor compounds. This work illustrates how the use of chemometrics methods combined with hyphenated techniques offers an excellent analysis way for complex mixtures and enables exploratory comparisons. The product composition distinctions in Colombian H. sabdariffa calyxes may be translated in significant quality differences of individual products. Therefore, the importance of easy and effective quality assurance protocols for H. sabdariffa calyxes from Colombia was thus evidenced. Furthermore, the present protocol is sound and indeed the method has the advantage of being simple and cheap, hence virtually affordable by any lab for the analysis and authentication of H. sabdariffa calyxes.
ACKNOWLEDGEMENTS
Authors thank MU Nueva Granada by financial support. The present work is a product derived by the Project IMP-CIAS-1567 fi-nanced by Vicerrectoría de Investigaciones at UMNG - Validity 2014. REFERENCES
1. Amin, I.; Emmy, H. K. I.; Halimatul, S. M. N.; Food 2008, 2, 1. 2. Hopkins, A. L.; Lamm, M. G.; Funk, J. L.; Ritenbaugh, C.; Fitoterapia
2013, 85, 84.
3. Borrás-Linares, I.; Fernández-Arroyo, S.; Arráez-Roman, D.; Palmeros-Suárez, P. A.; Del Val-Díaz, R.; Andrade-Gonzáles, I.; Fernández-Gutiérrez, A.; Gómez-Leyva J. F.; Segura-Carretero, A.; Ind. Crops Prod. 2015, 69, 385.
4. Juliani, H. R.; Welch, C. R.; Wu, Q.; Diouf, B.; Malainy, D.; Simon, J. E.; J. Food Sci. 2009, 74, S113.
5. Tsai, P. J.; McIntosh, J.; Pearce, P.; Camden, B.; Jordan, B. R.; Food Res. Int. 2002, 35, 351.
6. Sáyago-Ayerdi, S. G.; Arranz, S.; Serrano, J.; Goñi, I.; J. Agric. Food Chem. 2007, 55, 7886.
7. Fernández-Arroyo, S.; Rodríguez-Medina, I. C.; Beltrán-Debón, R.; Pasini, F.; Joven, J.; Micol, V.; Segura-Carretero, A.; Fernández-Gutiérrez, A.; Food Res. Int. 2011, 44, 1490.
8. Rodríguez-Medina, I. C.; Beltrán-Debón, R.; Micol, V.; Alonso-Villaverde, C.; Joven, J.; Menéndez, J. A.; Segura-Carretero, A.; Fernández-Gutiérrez, A.; J. Sep. Sci. 2009, 32, 3441.
9. Christian, K. R.; Jackson, J. C.; J. Food Compos. Anal. 2009, 22, 663. 10. Awe, F. B.; Fagbemi, T. N.; Ifesan, B. O.; Badejo, A. A.; Food Res. Int.
2013, 52, 490.
11. Gad, H. A.; Ahmady, El- S. H.; Abou-Shoer, M. I.; Al-Azizi, M. M.;
Phytochem. Anal. 2012, 24, 1.
12. Liang, X.; Wu, H.; Su, W.; Food Anal. Methods 2014, 7, 197. 13. Liu, H.; Lai, H.; Jia, X.; Liu, J.; Zhang, Z.; Qi, Y.; Zhang, J.; Song, J.;
Wu, C.; Zhang, B.; Xiao, P.; Phytomedicine 2013, 20, 1135.
14. Farag, M. A.; El-Ahmady, S. H.; Elian, F. S.; Wessjohann, L. A.; Phyto-chemistry 2013, 95, 177.
15. Acevska, J.; Stefkov, G.; Petkovska, R.; Kulevanova, S.; Dimitrovska, A.; Anal. Bioanal. Chem. 2012, 403, 1117.
16. Peng, L.; Wang, Y.; Zhu, H.; Chen, Q.; Food Chem. 2011, 125, 1064. 17. Bernal, F. A.; Cuca-Suárez, L. E.; Yamaguchi, L. F.; Coy-Barrera, E. D.;
Rec. Nat. Prod. 2013, 7, 152.
18. Lee, J.; Durst, R. W.; Wrolstad, R. E.; J. AOACInt. 2005, 88, 1269. 19. Nielsen, N-P. V.; Carstensen, J.; Smedsgaard, J.; J. Chromatogr. A. 1998,
80, 517.
20. http://www.models.life.ku.dk/algorithms#C, accessed October 2013. 21. van den Berg, R. A.; Hoefsloot, H. C.; Westerhuis, J. A.; Smilde, A. K.;
van der Werf, M. J.; BMC Genomics 2006, 7, 142.
22. Beebe, K. R.; Pell, R. J.; Seasholtz, M. B.; Chemometrics: A practical guide, John Wiley and Sons, Inc.: New York, 1998.
23. Bro, R.; Chemometr. Intell. Lab. Syst. 1997, 38, 149.
24. http://www.eigenvector.com/software/pls_toolbox.htm, accessed March 2014.
25. Dewick, P. M.; Medicinal natural products: A biosynthetic approach; 3rd
ed. John Wiley and Sons, Inc.: Chichester, 2009.
26. He, F.; Mu, L.; Yan, G-L.; Liang, N-N.; Pan, Q-H.; Wang, J.; Reeves, M. J.; Duan, C. Q.; Molecules 2010, 15, 9057.