www.biogeosciences.net/9/5199/2012/ doi:10.5194/bg-9-5199-2012
© Author(s) 2012. CC Attribution 3.0 License.
Biogeosciences
Methane emissions associated with the conversion of marshland to
cropland and climate change on the Sanjiang Plain of northeast
China from 1950 to 2100
T. Li1, Y. Huang2, W. Zhang1, and Y.-Q. Yu1
1State Key Laboratory of Atmospheric Boundary Layer Physics and Atmospheric Chemistry, Institute of Atmospheric Physics, Chinese Academy of Sciences, Beijing 100029, China
2The State Key Laboratory of Vegetation and Environmental Change, Institute of Botany, Chinese Academy of Sciences, Beijing 100093, China
Correspondence to:W. Zhang ([email protected])
Received: 17 March 2012 – Published in Biogeosciences Discuss.: 24 May 2012
Revised: 7 November 2012 – Accepted: 21 November 2012 – Published: 18 December 2012
Abstract.Wetland loss and climate change are known to al-ter regional and global methane (CH4) budgets. Over the last six decades, an extensive area of marshland has been con-verted to cropland on the Sanjiang Plain in northeast China, and a significant increase in air temperature has also been observed there, while the impacts on regional CH4 bud-gets remain uncertain. Through model simulation, we es-timated the changes in CH4 emissions associated with the conversion of marshland to cropland and climate change in this area. Model simulations indicated a significant reduc-tion of 1.1 Tg yr−1 (0.7–1.8 Tg yr−1) from the 1950s to the 2000s in regional CH4emissions. The cumulative reduction of CH4from 1960 to 2009 was estimated to be∼36 Tg (24– 57 Tg) relative to the 1950s, and marshland conversion and the climate contributed 86 % and 14 % of this change, respec-tively. Interannual variation in precipitation (linear trend with
P >0.2) contributed to yearly fluctuations in CH4 emis-sions, but the relatively lower amount of precipitation over the period 1960–2009 (47 mm yr−1lower on average than in the 1950s) contributed∼91 % of the reduction in the area-weighted CH4 flux. Global warming at a rate of 0.3◦ per decade (P <0.001) has increased CH4 emissions signifi-cantly since the 1990s. Relative to the mean of the 1950s, the warming-induced increase in the CH4flux has averaged 19 kg ha−1yr−1over the last two decades. In the RCP (Rep-resentative Concentration Pathway) 2.6, RCP 4.5, RCP 6.0 and RCP 8.5 scenarios of the fifth IPCC assessment report (AR5), the CH4 fluxes are predicted to increase by 36 %,
52 %, 78 % and 95 %, respectively, by the 2080s compared to 1961–1990 in response to climate warming and wetting.
1 Introduction
Methane (CH4) is recognized as one of the most potent greenhouse gases; it is 25 times more powerful than car-bon dioxide (CO2)in terms of its global warming potential (IPCC, 2007). Although natural wetlands cover only 5–8 % of the Earth’s land surface area (Ramsar Convention Secre-tariat, 2004; Mitsch and Gosselink, 2007), they contribute 20–25 % of the total annual CH4 emissions (IPCC, 2007; Mitsch and Gosselink, 2007).
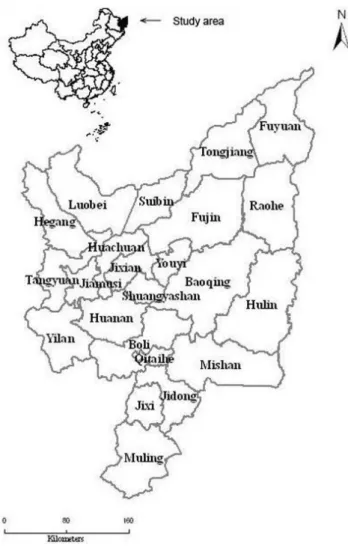
Fig. 1.The study area on the Sanjiang Plain of northeast China, covering 23 counties and 3 administrative farms.
The Sanjiang Plain, located in northeast China, was for-merly the largest marshland complex in China (Huang et al., 2010; Wang et al., 2006). In the 1950s, the wetland area of the Sanjiang Plain (Liu and Ma, 2000) accounted for ∼70 % of Heilongjiang province and ∼40 % of north-east China (Ning et al., 2008). However, an extensive area of marshland has been converted to cropland over the last six decades in this region (Liu and Ma, 2000; Zhang et al., 2003; Huang et al., 2010). Meanwhile, a significant increase in the surface air temperature has been detected (Ding and Cai, 2007), occurring at a rate of 0.3◦ per decade, and an-nual precipitation declined at a rate of 15 mm per decade from 1950 to 2000 in northeast China (Zhao et al., 2009). Furthermore, significant warming has been predicted to oc-cur under different scenarios by the end of the 21st century (SRES A2, B2 for IPCC AR4 and RCPs for IPCC AR5; Edi-torial Committee of China’s National Assessment Report on Climate Change, 2007; Bernie, 2010). By 2100, the tempera-ture is projected to increase by 4.5◦or 6.1◦, while precipita-tion will increase by 12 % or 13 % in northeast China under
the SRES B2 and A2 scenarios, respectively (Editorial Com-mittee of China’s National Assessment Report on Climate Change, 2007).
Researchers have attempted to understand the effects of temperature and precipitation on seasonal variation in CH4 fluxes in site-specific studies (Yang et al., 2006a; Song et al., 2009) to estimate regional CH4 emissions by extrapo-lating field measurements to the region (Cui, 1997; Ding et al., 2004; Ding and Cai, 2007) and to quantify regional CH4 emissions associated with marshland conversion on the San-jiang Plain (Huang et al., 2010), whereas less attention has been given to an integrated evaluation of CH4emissions in relation to marshland conversion and climate change.
Recognizing the significance of wetlands in regional CH4 budgets, this study focuses on quantifying the variation in CH4emissions on the Sanjiang Plain of northeast China via model simulations. The objectives of this study are to esti-mate the change in regional CH4emissions associated with the conversion of marshland to cropland and climate change and to identify the contributions of the conversion of marsh-land to cropmarsh-land and climatic factors to the changes in CH4 emissions over the period of 1950–2009. We also make pre-dictions regarding the impact of climate change on the CH4 flux from the marshland extending to the year 2100.
2 Materials and methods
2.1 Research area
The research area lies on the Sanjiang Plain, situated in the eastern part of Heilongjiang Province, northeast China (Fig. 1). It is located between 43◦50′N and 48◦28′N latitu-dinally and between 129◦11′E and 135◦05′E longitudinally, with a total area of 11.89 million ha (Zhang et al., 2006) cov-ering 23 counties and 3 administrative farms (see supplemen-tary material A for more details).
The study area is characterized by a temperate humid and subhumid continental monsoon climate with an annual mean temperature of∼2.5◦. Annual rainfall ranges from 350 to 770 mm, with 80 % occurring from May to September. The freshwater marsh is mainly dominated byCarexplants and
Deyeuxia angustifolia, which generally begin growing in late May and senesce in late September. The aboveground biomass ranges from 260 to 700 g m−2 (Guo et al., 2008; Hao, 2006; He, 2001; Ni, 1996; Wang et al., 1993; Yang et al., 2002; Yang et al., 2006b; Zhou et al., 2006; Zhou et al., 2009; Zhang et al., 2007).
2000–2009 was 6.4 t ha−1 (Heilongjiang Provencal Bureau of Statistics, 2010).
2.2 The modeling approach
Two biogeophysical models, CH4MOD and
CH4MODwetland, were used to simulate CH4 flux from an area of irrigated rice cultivation and a natural marshland, respectively. Both models have the potential for scaling up because they have been validated with field observations from various types of rice paddies and natural wetlands, respectively. To quantify the individual factorial impact on CH4 fluxes from marshland, we performed several simulation experiments using CH4MODwetland.
2.2.1 CH4MOD for irrigated rice cultivation
CH4MOD was developed to predict methane fluxes from rice paddy soils. The model associated this process with rice growth, organic C depletion and environmental fac-tors (Huang et al., 2004). The model’s input parameters in-cluded the rice grain yield, the soil sand percentage, the amount of organic amendment, the water management pat-tern, and the daily air temperature. The outputs are the daily and annual rates of CH4 production and emissions. The model was validated against a total of 94 field ob-servations that covered the main rice cultivation regions from northern (Beijing, 40◦30′N, 116◦25′E) to southern (Guangzhou, 23◦08′N, 113◦20′E) China and from east-ern (Hangzhou, 30◦19′N, 120◦12′E) to southwestern (Tuzu, 29◦40′N, 103◦50′E) China. This model can reasonably sim-ulate CH4flux from irrigated rice fields (Huang et al., 2004). In the rice paddy, after conversion from marshlands, we used CH4MOD to simulate CH4fluxes from the rice paddy of the Sanjiang Plain. We paid major attention to the im-pacts of human activities on CH4emission. The main agri-culture practices involving methane processes in rice paddies include organic matter amendment, irrigation and harvest-ing. In CH4MOD, decomposition of the added organic mat-ter (such as rice straw or green manure) was thought to be part of the predominant source of methanogenic substrates (Huang et al., 2004). But substrates derived from the decom-position of soil organic matter contributed little in compari-son to the fresh carbon and is not considered in CH4MOD (Huang et al., 2004). Irrigation strongly influenced the water fluctuation, which was one of the most sensitive environmen-tal factors to CH4flux (Boon et al., 1997; Ding et al., 2002). In CH4MOD, we cataloged five patterns of water manage-ment for rice cultivation in China. The intermittent flooding as well as intermittent irrigation was used to control the water level for single rice in northern China (Huang et al., 2004).
2.2.2 CH4MODwetlandfor natural wetlands
CH4MODwetlandwas developed based on CH4MOD to pre-dict CH4 flux from natural wetland (Li et al., 2010). The
model adopted the rationale of CH4MOD and focused on the supply of methanogenic substrates in natural wetlands that differs significantly from that in rice paddy. The in-put variables included environmental variables, soil prop-erties and plant growth-related controls. The outputs were the daily and annual rates of CH4 production and emis-sions. CH4MODwetland was validated against independent field measurements of CH4 fluxes from different wetland sites, including a marshland on the Sanjiang Plain (north-east China), a peatland on the Ruoergan Plateau (southwest China), a fen in Saskatchewan (Canada) and bogs in Michi-gan (USA). Model validation showed that CH4MODwetland was generally capable of simulating the seasonal and interan-nual variations in CH4fluxes from different sites, especially in northeast China (Li et al., 2010).
Before cultivation, we used CH4MODwetland to simulate CH4fluxes from the marshland of the Sanjiang Plain. In com-parison with CH4MOD, we paid more attention in the natu-ral processes of plant growth and water table fluctuation, as well as the decomposition of soil organic matter (Li et al., 2010) in CH4MODwetland. Unlike in rice paddies, plants in marshlands are not harvested at the end of the growing sea-son. The decomposition of plant litter supplies substrates for methanogens. Besides, marshland ecosystems accumulate great amounts of organic matter in a thick sod layer (Bert-ness, 1988; Frolking et al., 2001; Gorham et al., 2003; Zhang et al., 2008) that also becomes a source of methanogenic sub-strates. We paid special attention to the substrates derived from the decomposition of above- and belowground plant litter and soil organic matter in the CH4MODwetland (Li et al., 2010). The water table fluctuation was a series of natu-ral processes that are controlled by the water input (such as precipitation and surface inflow, etc.) and water output (such as evapotranspiration and runoff, etc.) (Zhang et al., 2002). A previous study employed daily standing water depth ob-servation to drive CH4MODwetland (Li et al., 2010). When applying this model on a regional scale, empirical equations were used to estimate water table changes (Li et al., 2004). Water table dynamics (WT, in cm) are determined directly by the balance between the water input (Sin, cm), runoff (Fout, cm) and evapotranspiration (ET, cm). No runoff occurs dur-ing the period of freezdur-ing temperatures from November to March:
1WT=
Sin−Fout−ET(Apr∼Oct)
P-ET (Nov∼Mar), (1)
WTi=WTi−1+1WT, (2)
The net radiation (Rn), which was used to calculate ET in the Priestley–Taylor model, was calculated using the equa-tions of the modified Penmann–Monteith model (Allen et al., 1998). When the water table position value was less than zero, the standing water depth (WD) in CH4MODwetlandwas considered to be zero.
The experimental constants (α0,a1, a2, D1, D2) in the functions calculatingSinandFoutfrom Wetland-DNDC were calibrated by trial and error (Zhang et al., 2002). The values of the experimental constants for the main types of marsh-land on the Sanjiang Plain are shown in supplementary ma-terial B (Table B1).
2.2.3 Sensitivity analysis
A sensitivity analysis of CH4MODwetlandwas performed to reveal the effects of the environmental drivers and model in-puts on CH4fluxes from theDeyeuxia angustifoliaandCarex lasiocarpasites from the year 2003 and 2004. The sensitivity of CH4MODwetlandwas tested for the environmental drivers’ air temperature (Tairin◦)and standing water depth (WD in cm); the plant input parameter of the maximum aboveground biomass (Wmax in g m−2), the vegetation index (VI), and the required growing degree days (GDD) for reaching max-imum biomass (GDDmaxin◦d); and the soil input parame-ters of the sand fraction (SAND), the soil bulk density (ρ in g cm−3)and the concentration of soil organic matter (SOM in g kg−1). The sensitivity of a given factor to the model’s output was quantified as the ratio of the change in total sea-sonal CH4flux (1CH4=CH4-CH4 baseline)to the CH4flux at baseline (CH4 baseline).
2.2.4 Uncertainty analysis
In this study, we paid more attention on the uncertainties in-duced by the input of key parameters by using the extreme condition approach for uncertainty propagation (Du and Chen, 1999). The main input parameters for CH4MOD in-cluded soil sand percentage (SAND), organic matter amend-ment (OM in g m−2), rice grain yield (GY in kg ha−1), water management pattern and rice cultivar index (RVI). Because of the limited data in water management pattern, the other four parameters (Table C1 in supplementary material C) were chosen and 16 simulations were carried out for the rice paddy in each county or administrative farm. For CH4MODwetland, totally six parameters (Table C1) were chosen and 64 simu-lations were carried out for theCarex lasiocarpamarshland and theDeyeuxia angustifoliamarshland in each county or administrative farm, respectively. The parameters included VI, Wmax, GDDmax, SAND, ρ and SOM. The maximum and minimum values of the input parameters represented the range of the corresponding parameters on the Sanjiang Plain.
2.2.5 Simulating climatic factor impacts
The climatic factors in CH4MODwetland and the empirical water table model include air temperature (Tair), precipita-tion (P )and net radiation (Rn). To quantify the impacts of climatic factors on the change in regional CH4 emissions and area-weighted CH4 fluxes from marshland on the San-jiang Plain, simulations were conducted under both real cli-mate conditions and different clicli-mate scenarios (Table 1) us-ing CH4MODwetland. Table 1 provides a description of the real climate condition and four climate scenarios. The real climate condition (AT ,P ,Rn)means that observed data were
used for all of the climatic factors (Table 1).ST ,P ,Rnassumed
that the annual meanTair,P andRnof the last five decades were the same as in the 1950s, as if there was no climate change during the last six decades (Table 1).ST ,P assumed thatTair andP from 1960 to 2009 were the same as in the 1950s, while observed data were used forRn(Table 1). Sim-ilarly,ST andSP assumed that onlyTairorP was the same as in the 1950s, respectively (Table 1).
ST ,P (Table 1) is used as an example to explain how we simulated the annual CH4 flux for each county or admin-istrative farm and annual regional CH4 emissions from the marshland of the Sanjiang Plain under the specified scenario. First, we randomly selected one year from 1950 to 1959 a total of 50 times and used the daily air temperature and the daily precipitation data series for the selected years to re-place the corresponding climate data series of 1960–2009. The new Tair andP data series and the observed dailyRn data series for 1950–2009 were used to drive the model to simulate the annual CH4flux for each county or administra-tive farm. Then, the above program was repeated 10 times to reduce the uncertainty caused by random selection. The average result of the 10 simulations is the annual CH4flux under ST ,P for the k-th county or administrative farm in thei-th yearFSi,k
T ,P (kg ha
−1yr−1). The area-weighted CH 4
flux (Fi in kg ha−1yr−1)is calculated by dividing the total emission of the entire region with the total marshland area in 1950. So the area-weighted CH4 flux is only the result of climate change, while the regional CH4emission, includ-ing changes in methane flux and marshland area, is therefore driven by both climate change and the marshland conversion.
TSi
T ,P (Tg yr
−1)represents the regional CH
4emissions in the i-th year underST ,P, which is calculated using the following equation:
TSi
T ,P =
23 X
k=1 FSi,k
T ,P×(A
i−1,k−ACi−1,k)/
109, (3)
whereAi−1,k (ha) represents the marshland area of the k -th county or administrative farm in -the (i−1)-th year, and
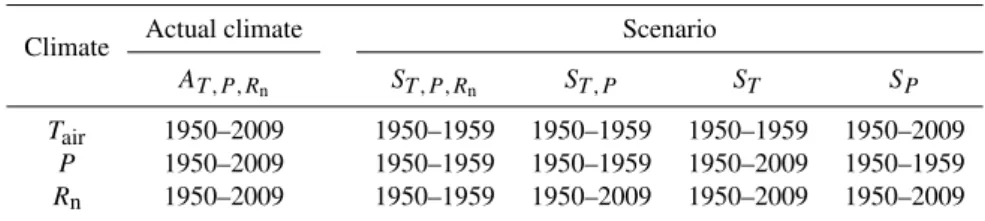
Table 1.Description of the climate conditions for simulating CH4emissions from 1950–2009.
Climate Actual climate Scenario
AT ,P ,Rn ST ,P ,Rn ST ,P ST SP
Tair 1950–2009 1950–1959 1950–1959 1950–1959 1950–2009 P 1950–2009 1950–1959 1950–1959 1950–2009 1950–1959
Rn 1950–2009 1950–1959 1950–2009 1950–2009 1950–2009
Similarly, the annual regional CH4 emissions under sce-narioST ,P ,Rn (T
i
ST ,P ,Rn in Tg yr
−1),S
T (TSiT in Tg yr −1)and SP (TSiP in Tg yr−1)(Table 1) can be calculated in the same way as scenarioST ,P.
The difference in simulated CH4emissions (including the area-weighted CH4 flux and regional CH4 emissions) un-derAT ,P ,Rncompared to the appointed climate scenario
(Ta-ble 1) could represent the impact of the corresponding cli-matic factors on CH4emissions (Eqs. 4 and 5). The differ-ence in the simulated CH4 emissions under AT ,P ,Rn
com-pared toST ,P ,Rn is considered to be the impact ofTair,P and
Rnon CH4emissions. Similarly, the difference in simulated CH4 emissions underAT ,P ,Rn compared toST ,P is
consid-ered to be the impact ofTairandP on CH4 emissions. The differences in simulated CH4emissions underAT ,P ,Rn
com-pared toST andSP are considered to be the impacts ofTair andP on CH4emissions, respectively.
When analyzing the impact of climatic factors on regional CH4 emissions, the concomitant impact of marshland con-version could not be isolated. The impact of the specified climatic factors on the change of the regional CH4emissions in thej-th decade (I TCFj in Tg per decade) was calculated by:
I TCFj =X i
(TAi
T ,P ,Rn−T
i
SCF), (4)
whereTAi
T ,P ,Rn (Tg yr
−1)andTi
SCF (Tg yr
−1)represent the annual regional CH4 emissions under AT ,P ,Rn and the
ap-pointed climate scenario (indicated by the subscriptSCF)in thei-th year, respectively. The subscript CF inI TCFj (Tg per decade) andSCFrepresents the specified climatic factors. For example, when CF representsTair,P andRn,I TT ,P ,Rj n (Tg per decade) represents the impact ofTair,P andRnon re-gional CH4emissions, andTSiT ,P ,R
n (Tg yr
−1)represents the annual regional CH4emissions under scenarioST ,P ,Rn.
When analyzing the independent impacts of climatic fac-tors on the area-weighted CH4 flux, we sought to isolate the impact of marshland conversion. The area-weighted CH4 flux (Fi in kg ha−1yr−1)was used to calculate the indepen-dent impact of the climatic factors on the CH4flux as fol-lows:
I FCFi =FAi
T ,P ,Rn−F
i
SCF, (5)
PCFj = I F j CF
FA1950s
T ,P ,Rn
, (6)
whereI FCFi (kg ha−1yr−1)represents the impact of the spec-ified climatic factors (indicated by the subscript CF) on the change in the area-weighted CH4 flux in thei-th year, and FAi
T ,P ,Rn (kg ha
−1yr−1) and Fi
SCF (kg ha
−1yr−1) represent the area-weighted CH4 flux underAT ,P ,Rn and the climate
scenario (indicated by the subscriptSCF)in thei-th year, re-spectively.I FCFj (kg ha−1yr−1)represents the average im-pact of climatic factors on the area-weighted CH4 flux in the j-th decade. FA1950s
T ,P ,Rn (kg ha
−1yr−1)represents the av-erage area-weighted CH4 flux underAT ,P ,Rn in the 1950s,
assuming that no marshland conversion occurred.PCFj rep-resents the proportion ofI FCFj to the average area-weighted CH4flux underAT ,P ,Rnin the 1950s in thej-th decade. The
subscript CF inI FCFi ,SCF,PCFj andI FCFj is the same as in Eq. (3).
2.2.6 Predictions of the impact of climate change on
CH4flux
In order to predict the independent impact of climate change on methane fluxes in the future, we assumed that other an-thropogenic drivers that affect methane emissions remain as in the present. The climate change scenarios used in this study were RCP 2.6, RCP 4.5, RCP 6.0 and RCP 8.5, which were projected by the Flexible Global Ocean-Atmosphere-Land System climate model (FGOALS, Yu et al., 2002, 2004). More information about the RCP scenarios is given in supplementary material D.
(Prudhomme et al., 2002; Wilby et al., 2004), as this is the standard World Meteorological Organization period (Hulme et al., 1995). The simulated average area-weighted CH4flux for 1961–1990 represents the baseline CH4 flux from the marshland of the Sanjiang Plain. We focused on the future time horizons of the 2030s (2011–2040), 2050s (2041–2070) and 2080s (2071–2100). CH4fluxes were simulated for each county or administrative farm using CH4MODwetland, which was driven by the downscaled output data from FGOALS. The area-weighted CH4flux for 2010–2100 is derived from the proportion of the marshland area in each county or ad-ministrative farm within the whole area of the Sanjiang Plain in 2009. The changes in the average area-weighted CH4 fluxes for the 2030s, 2050s and 2080s relative to the baseline CH4flux represent the predicted impact of climate change on CH4fluxes from the marshland of the Sanjiang Plain.
2.3 Data sources
2.3.1 Changes in marshland and rice paddy areas
It is reported that wetland loss in northeast China is mainly caused by reclamation (Liu and Ma, 2000; Gong et al., 2010; An et al., 2007). According to Wang et al. (2009), an esti-mated 2.58 M ha of marshland was converted to cropland on the Sanjiang Plain over the period from 1954–2005, which is compared to an increase of the cropland area from the official statistical reports (Su and Zhang, 2008) from the 1950s to the 2000s. Therefore, we used the yearly increase in cropland area taken from the annual statistical reports for a county or at the scale of an administrative farm (Su and Zhang, 2008) to calculate the yearly area of marshland con-verted to cropland from 1950 to 2009. The marshland area in each county in 1950 was calculated by totaling the cropland area (Su and Zhang, 2008) and marshland area (Wang et al., 2002) in 1980 and then subtracting the cropland area from 1950 (Su and Zhang, 2008). The marshland area on admin-istrative farms in 1950 was obtained from the local chron-icles of the reclamation system of Heilongjiang province (http://www.zglz.gov.cn/nongken/index.html). According to Cui (1997), the marshland area is mainly vegetated with
Deyeuxia angustifoliaandCarexplants, which account for approximately 20 % and 80 % of the vegetation on the San-jiang Plain, respectively.
The yearly acreage and yields of irrigated rice from 1950 to 2009 were obtained from the statistical yearbook of Hei-longjiang province at the scale of a county or an administra-tive farm.
2.3.2 Model input data
The environmental drivers of CH4MODwetland include the daily air temperature and standing water depth (Li et al., 2010). Meteorological datasets from 7 meteorological stations across the Sanjiang Plain from 1950–2009 were
acquired from the China Meteorological Administration (CMA) (http://cdc.cma.gov.cn/). Daily standing water depth data were calculated using the empirical water table model. We used the water table states to be the initial water table value of 1950. The water table states were obtained by a 1-year spin-up simulation by the water table empirical model, the forcing for which were the average climate data of 1950– 1959. Inputs for the empirical water table model, such as daily precipitation, hours of sunshine, maximum/minimum temperatures, and relative humidity, were also obtained from the CMA. The projected meteorological datasets were out-puts of FGOALS, which were provided by the State Key Lab-oratory of Numerical Modeling for Atmospheric Sciences and Geophysical Fluid Dynamics (LASG), the Institute of Atmospheric Physics (IAP), the Chinese Academy of Sci-ences (CAS). For counties or administrative farms for which meteorological data were not available, we used the data from the neighboring site. The key parameters of plant and soil of CH4MODwetlandfor all of the years from 1950 to 2100 were described as the baseline value in Table C1 in supple-mentary material C. More details about input parameters of CH4MODwetlandwere described in Li et al. (2010).
For the uncertainty analysis on the key parameters of CH4MODwetland, the maximum and minimum values of VI were supposed to be±10 % of the baseline value (Table C1). The maximum and minimum values of the maximum above ground biomass of Carex lasiocarpa andDeyeuxia angus-tifolia marshland were from the published observed data (Table C1). According to Ma et al. (1996) and Yang et al. (2002), the maximum value of aboveground biomass ap-pears from July to August. Correspondingly, the range of average GDDmaxwas around 1200–2500◦d. The maximum and minimum values of SAND and SOM were referred to the soil database developed by the Institute of Soil Sciences, Chinese Academy of Sciences when it was not reported. The bulk densityρwas related to the SOM value.
to make a comparison to the simulated range of the annual area-weighted CH4 fluxes from the marshland of the San-jiang Plain by the uncertainty analysis. The literature (Ding et al., 2004; Hao et al., 2004; Zhou et al., 2006; Wang et al., 2003b) reported CH4fluxes during May to October. To obtain annual fluxes, these datasets were corrected using the method of Huang et al. (2010).
For CH4MOD, the environmental driver is the daily air temperature. The database of input parameters was described by Huang et al. (2006). For the uncertainty analysis, the max-imum and minmax-imum values of RVI, GY and OM were sup-posed to be±10 % of the baseline value. The range of the soil sand fraction was the same as in the CH4MODwetland. The GY, OM and SAND were at the scale of a county or an administrative farm. More details about the range of parame-ter values for uncertainty analysis are described in Table C1.
3 Results and discussion
3.1 Model validation and sensitivity analysis
CH4MODwetland coupled with the empirical water table model can basically simulate the seasonal variations in stand-ing water depth (Fig. E1a and b) and CH4fluxes (Fig. E1c and d). The performance of CH4MODwetlandwas also good for the total annual/seasonal CH4fluxes (Fig. E2b). Details of model validation and sensitivity analysis of CH4MODwetland are described in supplementary material E.
3.2 Temporal and spatial CH4 variation from 1950–
2009
3.2.1 Changes in marshland area due to the conversion
of marshland to cropland
The marshland area on the Sanjiang Plain decreased by 3.2 M ha due to intensive cultivation over the period from 1950– 2009 (Fig. 2). Extensive conversion of marshland to cropland occurred in the 1950s and 1970s when cropland increased at a rate of 0.05–0.06 M ha yr−1, and marshland loss occurred at a rate of∼0.06 M ha yr−1. From 1960 to 1966, cropland increased by 0.54 M ha, and the loss of marshland was se-rious. However, from 1966 to 1970, grievous natural dis-asters (Group of Chinese Wetland Resources Development and Environmental Protection, 1998) caused farmers to lose their enthusiasm of cultivation and to abandon large areas of cropland (Ma, 1999). We assumed that the abandoned crop-land was reverted to marshcrop-land; thus, the marshcrop-land area in-creased during the period from 1966–1970. From 1980 to 1999, marshland decreased at a rate of 0.03 M ha yr−1. Dur-ing the 2000s, cropland increased extensively (Fig. 2), and marshland decreased by∼1.1 M ha (Fig. 2).
The proportion of the area of irrigated rice was rela-tively low when marshland was converted to cropland before the mid-1990s, though it increased substantially thereafter
Fig. 2.Conversion of marshland to cropland on the Sanjiang Plain.
(Fig. 2). In the 2000s, the irrigated rice area accounted for 33 % of the total cultivated area (Heilongjiang Provencal Bu-reau of Statistics, 2010). Table F1 (supplementary material F) shows the spatiotemporal changes in the marshland and irri-gated rice areas on the Sanjiang Plain.
Marshland on the Sanjiang Plain was converted for dif-ferent land uses over the period 1949–2000, including for cropland, grassland, woodland and urbanization (Wang et al., 2003a; Zhang et al., 2010), which were unavailable for quan-tification not only in the yearly sequence from 1950 to 2009 but also at the county scale (Fig. 1). This study only focuses on the conversion of marshland to cropland (Fig. 2). Based on data retrieved from remote sensing images from 1976, 1986, 1995, 2000 and 2005, an estimated 2.58 M ha of marshland was converted to cropland on the Sanjiang Plain over the pe-riod of 1954–2005 (Wang et al., 2009), which agrees with our estimate of 2.45 M ha (from 1950–2005).
3.2.2 Temporal variation of CH4emissions
Based on the models and the statistical area datasets, the mean annual area-weighted CH4 fluxes and the variation in regional CH4 emissions in the marshland and rice paddies of the Sanjiang Plain were estimated for the past 6 decades (Table 2). The variation in the mean annual area-weighted CH4 flux from the marshland was mainly influenced by the climate. The minimum area-weighted CH4 flux from the marshland occurred in the 1970s (Table 2), together with the lowest precipitation (Fig. 4b). After the 1970s, due to the higher air temperatures and precipitation in the 1980s and 1990s (Fig. 4a and b), the area-weighted CH4flux reached its maximum value of 611.8±122.7 kg ha−1yr−1(374.6± 64.9–888.9±165.1 kg ha−1yr−1)in the 1990s (Table 2). Al-though the mean annual temperature was still high (3.93◦)
(Fig. 4a), the mean annual area-weighted CH4flux was re-duced to 505.6±109.8 kg ha−1yr−1(312.7±58.2–730.9±
154.9 kg ha−1yr−1)(Table 2) due to the lower precipitation in the 2000s (Fig. 4b). Under the conditions of marshland be-ing converted to cropland and climate change, the mean an-nual regional CH4emissions decreased by 1.3 Tg yr−1(0.8– 2.1 Tg yr−1)in the 2000s compared with the average in the 1950s, with a ∼55 % reduction of the simulated average regional CH4 emissions in the 1950s from the marshland (Table 2). The average reduction rate was∼0.26 Tg (0.17– 0.42 Tg) per decade over the past 6 decades.
After marshland was converted to rice paddies, the CH4 fluxes reduced remarkably (Table 2). This corresponds to the measurements which indicated that marshland conversion to rice fields decreased CH4fluxes significantly, with a reduc-tion of 28–73 % on the Sanjiang Plain (Huang et al., 2010). In rice fields, the mean annual area-weighted CH4flux has increased by∼150 % over the past 6 decades (Table 2). The two most important reasons for this increase were that the grain yield in the 2000s was approximately 2 times higher than that in the 1950s, and the observed air temperature has increased significantly over the last 50 years (Editorial Com-mittee of China’s National Assessment Report on Climate Change, 2007). A significant increase in the mean annual regional CH4emissions from rice fields has been observed since the 1980s (Table 2), which corresponds to the increase in the area of rice fields (Table 2).
As a result, the mean annual regional CH4 emissions from the Sanjiang Plain decreased by 1.1 Tg yr−1 (0.7– 1.8 Tg yr−1) during the past 6 decades, about half of the levels in the 1950s (Table 2). The cumulative reduction in regional CH4 emissions totaled 36 Tg (24–57 Tg) over the past 5 decades relative to the average emissions in the 1950s (Table 2). The cumulative reduction of CH4by∼25 Tg (16– 40 Tg), resulting from the conversion of marshland to crop-land and climate change over the 1960s–1990s (Table 2), is comparable with the previous estimate of 27 Tg (Huang et al., 2010).
3.2.3 Spatial variation of regional CH4emissions
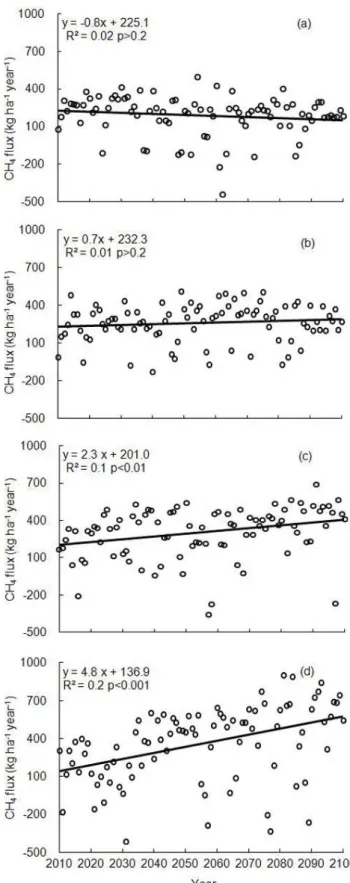
Fig. 3.Uncertainty analysis of CH4fluxes from marshland and rice
paddies on the Sanjiang Plain.
the spatial variation of CH4emissions are given in supple-mentary material G.
3.2.4 Uncertainty analysis of CH4fluxes
Figure 3 shows the uncertainty of the area-weighted CH4 fluxes over the marshland (Fig. 3a and b) and the rice paddy (Fig. 3c). The shaded area represents the simulated range of CH4 fluxes over the marshland (Fig. 3a and b) by 64 simulations and over the rice paddy (Fig. 3c) by 16 sim-ulations, respectively. The maximum annual area-weighted CH4 fluxes were 807.3 (496.1–1139.4) kg ha−1yr−1 for Carex lasiocarpa marshland (Fig. 3a) and 720.5 (459.1– 1214.6) kg ha−1yr−1 for Deyeuxia angustifolia marshland (Fig. 3b) in 1994. The maximum CH4 fluxes were mainly due to the higher temperature (4.0◦in Fig. 4a) and the high-est precipitation (797 mm in Fig. 4b). The minimum area-weighted CH4fluxes were 167.7 (129.0–265.4) kg ha−1yr−1 for Carex lasiocarpa marshland (Fig. 3a) and 62.1 (39.4– 191.2) kg ha−1yr−1 for Deyeuxia angustifolia marshland (Fig. 3b) in 1954. The minimum values were attributed to the
Fig. 4.Variations in the area-weighted air temperature(a), precip-itation(b) and net radiation(c)on the Sanjiang Plain from 1950 to 2009. Solid lines represent the interannual variations; the trian-gles represent the interdecadal variations, and the vertical bars are standard deviations of 10 yr of each decade.
lower temperature (3◦in Fig. 4a) and precipitation (399 mm in Fig. 4b).
angustifolia marshland (Fig. 3b). Correspondingly, the ob-served CH4 fluxes were 493.7–991.8 kg ha−1yr−1 in the Carex lasiocarpamarshland (Fig. 3a) (Ding et al., 2004; Hao et al., 2004) and 368.9 in theDeyeuxia angustifolia marsh-land (Fig. 3b) (Huang et al., 2010). During a dryer year in 2003, with an annual precipitation of 427 mm (Fig. 4a), the simulated annual area-weighted CH4 flux was lower than in 2002. The annual area-weighted CH4 fluxes were 269.1–611.3 kg ha−1yr−1 in the Carex lasiocarpa marsh-land (Fig. 3a) and 83.6–454.4 kg ha−1yr−1 in theDeyeuxia angustifoliamarshland (Fig. 3b). The observed CH4 fluxes were also lower in 2003 than in 2002, with the values of 313.5–416.6 kg ha−1yr−1in theCarex lasiocarpamarshland (Fig. 3a) (Song et al., 2007; Zhou et al., 2006) and 122.9– 209.3 kg ha−1yr−1 in theDeyeuxia angustifolia marshland (Fig. 3b) (Song et al., 2007; Zhou et al., 2006; Huang et al., 2010).
There was no significant trend of CH4flux from marshland from 1950 to 2009, although a strong interannual variation was shown (Fig. 3a and b). However, a significant increasing trend of CH4fluxes from rice paddies from 1950 to 2009 was observed (Fig. 3c). During the past 60 years, the significant increasing rate of annual area-weighted CH4flux was 2.95 (1.3–4.3) kg ha yr−1(P <0.001) from rice paddies.
Uncertainties may come from a lot of imperfections, such as the assumptions in model structure and key parameters, limited abundance of the model input data and spatial res-olution etc. (King et al., 1991; van Bodegom et al., 2000). Comprehensive uncertainty analysis is the major concern in modeling studies (Ogle et al., 2003, 2010). In this study, we induced the uncertainty of CH4 flux via the input of key parameters. However, when simulating regional CH4 emis-sions associated with marshland conversion to cropland on the Sanjiang Plain from 1950 to 2009, there are several other limitations in the models and data that need further improve-ment in future. First, we used the available meteorological data from seven counties. For other counties or administra-tive farms, we used data from a neighboring site. This coarse spatial replacement may conceal the detailed spatial varia-tion of climatic parameters to some extent. However, the dif-ferences in climate between the sites that cover the Sanjiang Plain were not significant. The standard deviations for pre-cipitation and the air temperature were 33 mm (∼6 % of the average annual mean precipitation from 1950–2009 at the 7 sites) and 0.35◦(∼10 % of the average annual mean air tem-perature from 1950–2009 at the 7 sites), respectively. There-fore, there may be some slight uncertainty caused by this coarse spatial replacement and a finer resolution of meteoro-logical data might be needed when using the model at a larger scale in the future. Second, there may be uncertainty in esti-mating the conversion area from marshland to cropland. And it might induce uncertainties in the estimated regional CH4 emissions. However, it is difficult to carry out comprehen-sive uncertainty analysis of CH4 emissions associated with marshland conversion, because the sufficient data of
marsh-land conversion is unavailable in annual sequence from 1950 to 2009 at a higher spatial resolution. At present, the ob-tained data of marshland conversion can only support a base-line simulation of the annual methane emission changes at a lower spatial resolution. We will pay more attention on the uncertainty induced by the marshland conversion area when more data are available in future. Last but not least, the lim-itation of model structure and coefficients might cause un-certainty. For example, during the conversion of marshland to rice paddy, either biological substrate or physiochemical processes might change (Xu and Tian, 2012). The model ap-proach could simulate CH4 flux before marshland conver-sion by CH4MODwetland, and after the marshland conversion to rice paddies by CH4MOD. However, neither model could simulate the process of marshland converted to rice paddy. Moreover, the CH4MODwetland could not simulate the CH4 flux in response to the elevated CO2, nor could it simulate the impact of climate change on marshland loss. All of the limitations about model approach might induce uncertainties in simulating CH4 emissions. Improvements on the model structure will be needed in the future.
3.3 Impact of marshland conversion and climate change
on CH4emissions from marshland from 1950–2009
3.3.1 Changes in climatic factors from 1950–2009
Figure 4 shows the interannual and interdecadal variations in the area-weighted air temperature (Fig. 4a), precipita-tion (Fig. 4b) and net radiaprecipita-tion (Fig. 4c) on the Sanjiang Plain from 1950 to 2009. There was a significant increasing trend in the mean annual air temperature (linear trend with
P <0.001), with an increase rate of 0.3◦per decade. An ob-vious increase in the air temperature has occurred since the 1980s, and the maximum mean annual temperature occurred in the 1990s (Fig. 4a). The mean annual precipitation and net radiation showed great interannual variation, but without an obvious trend (linear trend withP >0.05) (Fig. 4b and c). The minimum mean annual precipitation was observed in the 1970s, followed by the 2000s (Fig. 4b). The net radiation was low in the 1980s and 1990s (Fig. 4c).
Table 3.Impact of climatic factors on CH4variation.
Decade Impact on regional CH4emissions (Tg)
a Impact on area-weighted CH
4fluxb
I TT I TP I TT ,P I TT ,P ,Rn PT PP PT ,P PT ,P ,Rn
1960s −1.10 0.16 −0.56 −0.24 −5.7 % 1.7 % −2.6 % −1.0 % 1970s −1.08 −4.09 −4.32 −4.10 −5.6 % −21.1 % −22.7 % −21.6 % 1980s −0.01 −1.78 −1.24 −0.75 −0.2 % −9.4 % −6.5 % −3.9 % 1990s 0.82 0.11 0.96 1.57 5.1 % 0.4 % 7.2 % 10.8 % 2000s 0.13 −2.80 −2.15 −1.86 1.7 % −21.1 % −14.9 % −12.2 %
aUsed Eq. (4), positive/negative values represent increase/decrease regional CH
4emissions.
bUsed Eq. (5), positive/negative values represent increase/decrease area-weighted CH
4flux.
I TT: Impact of air temperature on regional CH4emissions.
I TP: Impact of precipitation on regional CH4emissions.
I TT ,P: Impact of air temperature and precipitation on regional CH4emissions.
I TT ,P ,Rn: Impact of air temperature, precipitation and net radiation on regional CH4emissions.
PT: Impact of air temperature on area-weighted CH4flux.
PP: Impact of precipitation on area-weighted CH4flux.
PT ,P: Impact of air temperature and precipitation on area-weighted CH4flux.
PT ,P ,Rn: Impact of air temperature, precipitation and net radiation on area-weighted CH4flux.
3.3.2 Impact of marshland conversion and climate
change on regional CH4emissions
Both marshland conversion and climate change have con-tributed to regional CH4decreases over the past 6 decades in the marshland of the Sanjiang Plain. If no climate change had taken place, marshland conversion alone could account for a cumulative CH4reduction of 33.6 Tg from 1960 to 2009 rel-ative to the 1950s (calculated based on the simulated annual regional CH4 emissions under scenario ST ,P ,Rn). Climate
change alone could account for a cumulative CH4reduction of 5.4 Tg from 1960 to 2009 relative to the 1950s (calculated based on the difference between the simulated annual re-gional CH4emissions underAT ,P ,Rn and scenarioST ,P ,Rn).
Table 2 shows that the simulated cumulative CH4reduction under the conditions of climate change and marshland con-version was 39.0 Tg in the marshland (Table 2). Thus, marsh-land conversion contributed 86 % of the regional reduction in CH4 emissions, and climate change contributed 14 % from the marshland.
3.3.3 Impact of climatic factors on regional CH4 emissions
The impact of climatic factors on the variation in regional CH4 emissions is shown in Table 3. As the air temperature increased (Fig. 4a), the impact of the air temperature on re-gional CH4emissions showed a linear increase of 0.44 Tg per decade (R=0.83,P =0.08). The increasing air temperature enhanced regional CH4emissions significantly in the 1990s and 2000s (Table 3), corresponding to the obvious increase in air temperature in the 1990s and 2000s (Fig. 4a). The impact of precipitation and net radiation on regional CH4emissions showed obvious interdecadal variation. Precipitation was the main contributor to regional CH4 variation because it con-trolled the water table position, which can markedly affect
CH4flux (Fig. E1) (Boon et al., 1997; Ding et al., 2002). The maximum reduction in regional CH4emissions amounted to 4.09 Tg in the 1970s, followed by 2.80 Tg in the 2000s (Ta-ble 3), due to the lower precipitation in 1970s and 2000s (Fig. 4b). The influence of the interannual/interdecadal varia-tion in precipitavaria-tion on regional CH4emissions may obscure the acceleration of CH4 emissions caused by the increasing air temperature. Therefore, the concurrent influence of air temperature and precipitation (ITT ,P)showed a similar trend to the influence of precipitation alone (ITP)on regional CH4 emissions (Table 3).
3.3.4 Impact of climatic factors on area-weighted CH4
flux
The decadal and annual impacts of climatic factors on the area-weighted CH4 flux in the marshland of the Sanjiang Plain are described in Table 3 and Fig. 5, respectively. A lin-ear increase of 1.3 kg ha−1yr−1 was found with respect to the impact of the air temperature on the CH4flux over the past 6 decades (Fig. 5a). The negative impact on the CH4 flux became lower, whereas significant positive impact on the CH4flux has occurred since the 1990s (Table 3). Rela-tive to the mean of the 1950s, the warming-induced increase in the area-weighted CH4flux averaged 19 kg ha−1yr−1over the last two decades.
Fig. 5.Impact of air temperature(a), precipitation(b), air temperature and precipitation(c), air temperature, precipitation and net radiation(d)
on area-weighted CH4flux. EstimatedI FCFi by Eq. (4).
precipitation was the main contributor to the reduction of the area-weighted CH4flux. We estimated that the relatively lower amount of precipitation over the period of 1960–2009 (averaging 47 mm yr−1lower than in the 1950s) contributed ∼91 % of the reduction in the area-weighted CH4flux among the climatic factors. This contribution of 91 % was calculated using the equation I F
1950∼2009
P I F1950∼2009
P +I FT1950∼2009
, whereI FP1950∼2009
andI FT1950∼2009(kg ha−1yr−1)(Eq. 5) represented the aver-age impact of precipitation and air temperature on the area-weighted CH4flux from 1950–2009.
According to this analysis, although the air temperature increased continuously from the 1950s to the 1980s, it did not enhance the area-weighted CH4flux (Table 3). The rea-son was that the air temperature mainly increased during the growing season (April to October), rather than in win-ter (November to March), which reduced the number of days from germination to the occurrence of maximum above-ground biomass. An obvious rising trend was detected in the mean temperature of the growing season, which increased at a rate of 2.2◦per decade (linear trend withP <0.05) from 1950 to 1979, whereas no trend was found in winter tem-peratures (linear trend withP >0.2) during the same period. In northeast China, the required values of GDD are 50◦d and 2000◦d for plant germination and for approaching the maximum value, respectively (Li et al., 2010). The varia-tion in temperature resulted in a decrease in the length of the days from germination to the occurrence of maximum aboveground biomass at a rate of 2.1 days per decade
(lin-ear trend withP <0.05). According to the logistic equation that was used to calculate the daily aboveground biomass in CH4MODwetland, the aboveground biomass will become in-finitely close to the input maximum value as GDD reaches 2000◦d. The greater the number of days between germina-tion and the occurrence of the maximum value, the closer the actual maximum aboveground biomass becomes to the input value. Therefore, the decrease in the number of days from germination to the maximum value resulted in a reduc-tion of the actual maximum aboveground biomass value and, furthermore, decreased the maximum CH4flux value.
3.4 Projected impact of climate change on CH4 fluxes by 2100
3.4.1 Projected climate change in the RCP scenarios
The climate projected by FGOALS shows a trend of becom-ing warmer and wetter in the RCP scenarios. The annual mean precipitation will increase in the range of 9 % to 12 % (46 and 63 mm) in the 2030s, 7 % to 17 % (38 and 90 mm) in the 2050s, and 12 % to 24 % (62 and 122 mm) in the 2080s relative to 1961–1990 (Table 4). No significant trend in pre-cipitation was observed within the period from 2010–2100 in the RCP scenarios (Fig. H1).
The annual mean area-weighted air temperature will increase by 49 % (1.5◦yr−1), 96 % (2.9◦yr−1), 150 % (4.6◦yr−1)and 238 % (7.3◦yr−1)by the 2080s relative to 1961–1990 in RCP 2.6, RCP 4.5, RCP 6.0 and RCP 8.5, respectively (Table 4). In RCP 2.6 scenario, the increase of mean annual area-weighted air temperature shows a de-creased trend with a rate of. 0.1◦ per decade (P <0.1) (Fig. H1a), corresponding to the trend of radiative forcing (Moss et al., 2008). Under the “high pathway” (RCP 8.5) scenario, the projected change in the air temperature from 2010–2100 relative to 1961–1990 shows an obvious linear increase of 0.7◦ per decade (P <0.001) (Fig. H1d). There is also an increasing trend in the projected change in the air temperature in the RCP 6.0 scenario, with a rate of 0.2◦per decade (P <0.001) (Fig. H1c).
3.4.2 Impact of projected climate change on CH4fluxes
by 2100
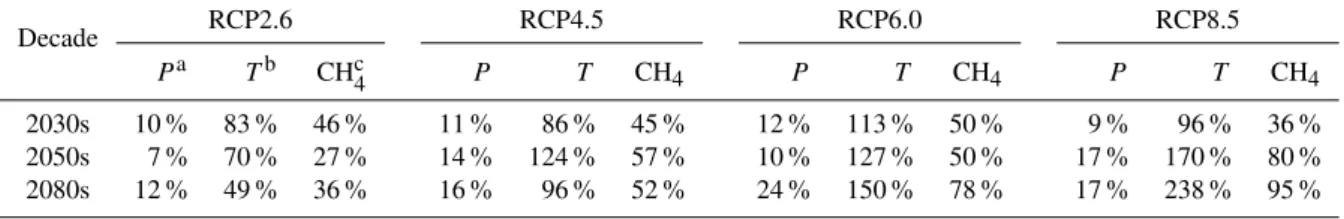
The projected area-weighted CH4 fluxes are expected to be increased in the future due to rising air temperature and pre-cipitation (Table 4). In the “near term” – the 2030s (Moss et al., 2008), the differences between the increases of the area-weighted CH4fluxes in the four RCP scenarios are in-conspicuous (Table 4). However, in the “long term” – the 2080s (Moss et al., 2008), the increase in the area-weighted CH4 flux is obviously higher under RCP 8.5 than the other RCP scenarios (Table 4). As the “high pathway” scenario, the RCP 8.5 scenario predicts that the area-weighted CH4 flux will increase by 36 % in the 2030s, 80 % in the 2050s and 95 % in the 2080s compared with 1961–1990 (Table 4). In the RCP 6.0 scenario, the area-weighted CH4flux will increase by 50 % in the 2030s and 2050s and by 78 % in the 2080s (Table 4). Linear trends in the increase of CH4 fluxes from 2010–2100 relative to 1961–1990 are shown in the RCP 6.0 and RCP 8.5 scenarios with rates of 23 kg ha−1yr−1 and 48 kg ha−1yr−1, respectively (Fig. 6c and d), which is con-sistent to the trend of the air temperature (Fig. H1). However, there is no significant trend of the increase of area-weighted CH4fluxes in RCP 2.6 and RCP 4.5 (P >0.2) (Fig. 6a and b). In the RCP 4.5 scenario, the increase of the area-weighted CH4 flux is stabilized during the 21st century (Table 4 and
Fig. 6.Projected change of CH4fluxes relative to 1961–1990 on
Table 4.Projected increases in area-weighted CH4flux relative to 1961–1990.
Decade RCP2.6 RCP4.5 RCP6.0 RCP8.5
Pa Tb CHc4 P T CH4 P T CH4 P T CH4
2030s 10 % 83 % 46 % 11 % 86 % 45 % 12 % 113 % 50 % 9 % 96 % 36 % 2050s 7 % 70 % 27 % 14 % 124 % 57 % 10 % 127 % 50 % 17 % 170 % 80 % 2080s 12 % 49 % 36 % 16 % 96 % 52 % 24 % 150 % 78 % 17 % 238 % 95 %
aIncrease in precipitation relative to the baseline of 1961–1990 (515 mm).
bIncrease in temperature relative to the baseline of 1961–1990 (3.07◦).
cIncrease in the simulated area-weighted CH
4flux relative to the baseline of 1961–1990 (513 kg ha−1yr−1).
Fig. 6b). In the RCP 2.6, the increase in the area-weighted CH4flux first reaches 46 % in the 2030s and then declines in the 2050s and 2080s in the RCP 2.6 scenario (Table 4).
The projected area-weighted CH4fluxes in the four RCP scenarios show obvious interannual variation (Fig. 6) due to the yearly fluctuation of precipitation (Fig. H1). The extreme high and low values of the area-weighted CH4 fluxes are mainly attributed to the extreme high and low area-weighted precipitation, respectively. For example, in the RCP 2.6 sce-nario, the decreases of the area-weighted precipitation are 215 and 213 mm in 2061 and 2062, respectively (Fig. H1a). Correspondingly, the decrease in area-weighted CH4 fluxes are 226.8 and 443.4 kg ha−1yr−1 relative to the average 1961–1990 in 2061 and 2062, respectively (Fig. 6a). The increase of the area-weighted precipitation is 510.4 mm in 2033 in RCP 6.0 (Fig. H1c). Correspondingly, the increase in area-weighted CH4flux is 437 kg ha−1yr−1relative to the average 1961–1990 in 2033 (Fig. 6c).
Using a modeling approach, Zhuang et al. (2006) pro-jected that CH4 emissions from the wetlands in northern high latitudes would more than double over the century in a scenario of projected atmospheric CO2 mole fraction of approximately 1152 ppm by 2100. In the present study, the projected CH4 flux will be ∼2.1 times over the century, from 505 kg ha−1yr−1in the 2000s to 1060 kg ha−1yr−1in 2100, in the RCP 8.5 scenario of projected CO2 concentra-tions of 1370 ppm. This increase is close to the increment re-ported by Zhuang et al. (2006). In the doubled CO2scenario (∼700 ppm), increases of 56 % (Christensen and Cox, 1995) and 110 % (Shindell et al., 2004) have been estimated for the CH4 flux in the northern high latitude region. The doubled CO2 scenario is similar to the range between the RCP 6.0 scenario and RCP 8.5 scenario (650 ppm–850 ppm, supple-mentary material D). Our results show increases of 56 % (from 505 kg ha−1yr−1 in the 2000s to 790 kg ha−1yr−1 in 2100) and 84 % (from 505 kg ha−1yr−1 in the 2000s to 930 kg ha−1yr−1 in 2100) under the RCP 4.5 scenario and RCP 6.0 scenario, respectively. These results are close to that of Christensen and Cox (1995), but lower than the estimate of Shindell et al. (2004). Thus, there is qualitative agreement among the existing studies that climate change can greatly enhance methane emissions from wetlands in the future, but
the magnitude is uncertain. If the model considers the pro-moting effects of climate warming on snowmelt and the ele-vated CO2on plant growth, the projected CH4flux in the 21st century may be higher than the estimates presented here.
In this study, we estimated the area-weighted CH4 flux from the marshland in the projected climate scenarios from 2010 to 2100. The regional CH4emissions from the marsh-land of the Sanjiang Plain depend on the CH4flux and the marshland area. However, it is hard to estimate the change of marshland area in the future. This is because both of the cli-mate change and the government’s policy will influence the development of the marshland area in the future. During the past 60 years, the marshland area on the Sanjiang Plain de-creased by 3.2 M ha (Fig. 2). This decrease was mainly due to intensive cultivation. There may not be intensive marshland cultivation in the future. The wetland conservation policy might increase the marshland area. However, the increased air temperature will cause a marshland loss by increasing the evapotranspiration. Simulating the development of marsh-land is important in future work.
4 Conclusions
An estimated cumulative reduction of∼36 Tg (24–57 Tg) in regional CH4 emissions from the Sanjiang Plain of north-east China occurred from 1960 to 2009 relative to the 1950s. Approximately 86 % of the reduction was attributed to ex-tensive conversion of marshland to cropland over a total area of 3.2 M ha. Relatively low precipitation also contributed to the reduction in CH4emissions, while an increase in temper-ature obviously enhanced CH4 emissions over the last two decades. In the RCP scenarios, it is predicted that climate change will greatly enhance methane flux from marshland on the Sanjiang Plain in the future.
Acknowledgements. This work was supported by the National Nat-ural Science Foundation of China (Grant No. 31000234, 41075107 and 41021004), the Chinese Academy of Sciences (CAS) strategic pilot technology special funds (Grant No. XDA05020204) and the External Cooperation Program of the Chinese Academy of Sciences (Grant No. GJHZ1213). We are grateful to the members at the Sanjiang Wetland Experimental Station, the Chinese Academy of Sciences for their contribution to the measurements of CH4 emission, water table position and the plant biomass. We would also like to thank the National Meteorological Information Center of the China Meteorological Administration and the State Key Laboratory of Numerical Modeling for Atmospheric Sciences and Geophysical Fluid Dynamics of the Institute of Atmospheric Physics, Chinese Academy of Sciences for providing data. Edited by: P. Stoy
References
Allen, R. G., Pereira, L. S., Raes, D., and Smith, M.: Crop evapotranspiration: Guidelines for computing crop water re-quirements, in: Irrigation and Drainage Paper No. 56, FAO, Rome, Italy, available at: http://www.fao.org/docrep/X0490E/ X0490E00.htm, 1998.
An, S. Q., Li, H. B., Guan, B. H., Zhou, C. F., Wang, Z. S., Deng, Z. F., Zhi, Y. B., Liu, Y. L., Xu, C., Fang, S. B., Jiang, J. H., and Li, H. L.: China’s natural wetlands: past problems, current status, and future challenges, Ambio, 36, 335–342, 2007.
Beldring, S., Engen-Skaugen, T., Førland, E. J., and Roald, L. A.: Climate change impacts on hydrological processes in Norway based on two methods for transferring regional climate model re-sults to meteorological station sites, Tellus A, 60, 439–450, 2008. Bernie, D.: Temperature implications from the IPCC 5th assessment Representative Concentration Pathways (RCP), Work stream 2, Report 11 of the AVOID programme (AV/WS2/D1/R11), avail-able at: www.avoid.uk.net, 2010.
Bertness, M. D.: Peat accumulation and the success of marsh plants, Ecology, 69, 703–713, 1988.
Bridgham, A. D., Megonigal, J. P., Keller, J. K., Bliss, N. B., and Trettin, C.: The carbon balance of North American wetlands, Wetlands, 26, 889–916, 2006.
Boon, P. I., Mitchell, A., and Lee, K.: Effects of wetting and dry-ing on methane emissions from ephemeral floodplain wetlands in southeastern Australia, Hydrobiologia, 357, 73–87, 1997. Cao, M. K., Gregson, K., and Marshall, S.: Global methane
emis-sion from wetlands and its sensitivity to climate change, Atmos. Environ., 32, 3293–3299, 1998.
Charmann, D. J. and Hendon, D.: Long-term changes in soil water tables over the past 4500 years: relationships with climate and north Atlantic atmospheric circulation and sea surface tempera-ture, Clim. Change, 47, 45–59, 2000.
Christensen, T. R. and Cox, P.: Response of methane emission from arctic tundra to climate change: results from a model simulation, Geophys. Res. Lett., 31, L04501, doi:10.1029/2003GL018680, 1995.
Cui, B. S.: CH4emission from wetland in Sanjiang Plain, Sci. Ge-ogr. Sin., 17, 93–95, 1997 (in Chinese with English abstract). Cui, B. S., Ma, X. H., and Zhang, M. X.: Regularity and
estima-tion of methane emission from marshland in the Sanjiang Plain,
Chinese Geogra. Sci., 8, 74–84, 1998.
Ding, W. X. and Cai, Z. C.: Methane emission from natural wet-lands in China: Summary of years 1995–2004 studies, Pedo-sphere, 17, 475–486, 2007.
Ding, W. X., Cai, Z. C., Tsuruta, H., and Li, X. P.: Effect of standing water depth on methane emissions from freshwater marshes in northeast China, Atmos. Environ., 36, 5149–5157, 2002. Ding, W. X., Cai, Z. C., and Wang, D. X.: Preliminary budget of
methane emissions from natural wetlands in China, Atmos. Env-iron., 38, 751–759, 2004.
Du, X. and Chen, W.: Towards a better understanding of modeling feasibility robustness in engineering design, 1999 ASME design technical conference, Paper No. DAC-8565, Las Vegas, Nevada, September 1999.
Editorial Committee of China’s National Assessment Report on mate Change (Eds.): China’s National Assessment Report on Cli-mate Change, Science Press, Beijing, China, 2007 (in Chinese). Frolking, S., Roulet, N. T., Moore, T. R., Richard, P. J. H., Lavoie,
M., and Muller, S. D.: Modeling northern peatland decomposi-tion and peat accumuladecomposi-tion, Ecosystems, 4, 479–498, 2001. Gong, P., Niu, Z. G., Cheng, X., Zhao, K. Y., Zhou, D. M., Guo,
J. G., Liang, L., Wang, X. F., Li, D. D., Huang, H. B., Wang, Y., Wang, K., Li, W. N., Wang, X. W., Ying, Q., Yang, Z. Z., Ye, Y. F., Li, Z., Zhuang, D. F., Chi, Y. B., Zhou, H. Z., and Yan, J.: China’s wetland change (1990–2000) determined by remote sensing, Sci. China Ser. D-Earth Sci., 53, 1036–1042, doi:10.1007/s11430-010-4002-3, 2010.
Gorham, E., Janssens, J. A., and Glaser, P. H.: Rates of peat accu-mulation during the postglacial period in 32 sites from Alaska to Newfoundland, with special emphasis on northern Minnesota, Can. J. Bot., 81, 429–438, 2003.
Gedney, N., Cox, P. M., and Huntingford, C.: Climate feed-back from wetland methane emissions, Geophys. Res. Lett., 31, L20503, doi:10.1029/2004GL020919, 2004.
Group of Chinese Wetland Resources Development and Environ-mental Protection: Development history of the Sanjiang Plain, Territ. Nat. Resour. Study, 1, 15–19, 1998 (in Chinese). Guo, X. L., Lv, X. G., Dai, G. H.: Aboveground biomass
dynam-ics within wetlands along a water level gradient in the Sanjiang Plain, Ecol. Environ., 17, 1739–1742, 2008 (in Chinese with En-glish abstract).
Hao, Q. J.: Effect of land-use change on greenhouse gases emis-sions in freshwater marshes in the Sanjiang Plain, Ph.D. thesis, Institute of Atmospheric Physics, Chinese Academy of Sciences, Beijing, 205 pp., 2006 (in Chinese with English abstract). Hao, Q. J., Wang, Y. S., Song, C. C., Liu, G. R., Wang, Y. Y., and
Wang, M. X.: Study of CH4emission from wetlands in Sanjiang
Plain, J. Soil Water Conservation, 18, 194–199, 2004 (in Chinese with English abstract).
Hay, L. E., Wilby, R. T., and Leavesley, G. H.: A comparison of delta change and downscaled GCM scenarios for three moun-tainous basins in the United States, J. Am. Water Resour. As., 36, 387–397, 2000.
Hulme, M., Conway, D., Jones, P. D., Jiang, T., Barrow, E. M., and Turney, C.: Construction of a 1961–1990 European climatology for climate change modelling and impact applications, Int. J. Cli-matol., 15, 1333–1363, 1995.
Grassland China, 23, 11–16, 2001 (in Chinese with English ab-stract).
Heilongjiang Provencal Bureau of Statistics (Eds.): Heilongjiang Provencal Bureau of Statistics, 2010, China Statistical Press, Bei-jing, China, 2010 (in Chinese).
Huang, Y., Zhang, W., Zheng, X. H., Li, J., and Yu, Y. Q.: Modeling methane emission from rice paddies with vari-ous agricultural practices, J. Geophys. Res., 109, D08113, doi:10.1029/2003JD004401, 2004.
Huang, Y., Zhang, W., Zheng, X. H., Han, S. H., and Yu, Y. Q.: Estimates of methane emissions from Chinese rice paddies by linking a model to GIS database, Acta Ecological Sinca, 26, 980– 988, 2006.
Huang, Y., Sun, W., Zhang, W., Yu, Y., Su, Y., and Song, C.: Marsh-land conversion to cropMarsh-land in northeast China from 1950 to 2000 reduced the greenhouse effect, Glob. Change Biol., 16, 680–695, 2010.
IPCC: Climate Change 2007: The Physical Science Basis, Sum-mary for Policymakers, Contribution of Working Group I to the Fourth Assessment Report of the Intergovernmental Panel on Climate Change, Intergovernmental Panel on Climate Change, Paris, France, 2007.
Jia, Z. J., Zhang, W., Huang, Y., Song, C. C., and Zhao, X. S.: Ef-fects of marshland reclamation on evapotranspiration in the San-jiang Plain, Environ. Sci., 31, 833–842, 2010 (in Chinese with English abstract).
King, A. W., Johnson, A. R., and O’Neill, R. V.: Transmutation and functional representation of heterogeneous landscapes, Land-scape Ecol., 5, 239–253, 1991.
Li, C. S., Cui, J. B., Sun, G., and Trettin, C.: Modeling impacts of management on carbon sequestration and trace gas emissions in forested wetland ecosystems, Environ. Manage., 33, 176–186, 2004.
Li, T. T., Huang, Y., Zhang, W., and Song, C. C.: CH4MODwetland:
A biogeophysical model for simulating CH4emissions from nat-ural wetland, Ecol. Model., 221, 666–680, 2010.
Liu, X. T. and Ma, X. H.: Influence of large scale reclamation on natural environment and regional environmental protection in the Sanjiang Plain, Sci. Geogr. Sin., 20, 14–19, 2000 (in Chinese with English abstract).
Ma, Z.: Protection, development and economic evaluation of the Sanjiang Plain, Ph.D. thesis, Renmin University of China, Bei-jing, 1999 (in Chinese with English abstract).
Ma, X. H., Lu, X. G., Yang, Q., and Yan, M. H.: Carbon cycle of a marsh in Sanjiang Plain, Scientia Geographica Sin., 16, 323–330, 1996 (in Chinese English abstract).
Mitsch, J. W. and Gosselink, J. G.: Wetlands, 4th edn, John Wiley and Sons Inc, Hoboken, NJ, 2007.
Moss, R., Babiker, M., Brinkman, S., Calvo, E., Carter, T., Ed-monds, J., Elgizouli, I., Emori, S., Erda, L., Hibbard, K., Jones, R., Kainuma, M., Kelleher, J., Lamarque, J. F., Manning, M., Matthews, B., Meehl, J., Meyer, L., Mitchell, J., Nakicenovic, N., O’Neill, B., Pichs, R., Riahi, K., Rose, S., Runci, P., Stouffer, R., van Vuuren, D., Weyant, J., Wilbanks, T., van Ypersele, J. P., and Zurek, M.: Towards new scenarios for analysis of emissions, climate change, impacts, and response strategies, Technical sum-mary, Intergovernmental Panel on Climate Change, Geneva, 25 pp., 2008.
Ni, H. W.: Study on the biomass of above–ground organs and layer structure of Deyeuxia angustifolia in typical mdeadow on San-jiang Plain, Bull. Bot. Res., 16, 356–362, 1996 (in Chinese with English abstract).
Ning, J., Zhang, S. W., Li, Y., and Wang, L.: Analysis on wetland shrinking characteristics and its cause in Heilongjiang province for the last 50 years, J. Nat. Resour., 23, 79–86, 2008 (in Chinese with English abstract).
Ogle, S., Breidt, F., Eve, M., and Paustian, K: Uncertainty in esti-mating land use and management impacts on soil organic carbon storage for US agricultural lands between 1982 and 1997, Global Change Biol., 9, 1521–1542, 2003.
Ogle, S., Breidt, F., Easter, M., Williams, S., Killian, K., and Paus-tian, K.: Scale and uncertainty in modeled soil organic carbon stock changes for US croplands using a process–based model, Global Change Biol., 16, 810–822, 2010.
Priestley, C. H. B. and Taylor, R. J.: On the assessment of surface heat flux and evaporation using large-scale parameters, Mon. Weather Rev., 100, 81–92, 1972.
Prudhomme, C., Reynard, N., and Crooks, S.: Downscaling of global climate models for flood frequency analysis: where are we now?, Hydrol. Processes, 16, 1137–1150, 2002.
Ramsar Convention Secretariat (Eds.): Ramsar Handbook for the Wise Use of Wetlands, 2nd Edition, Handbook 10, Wetland In-ventory: A Ramsar Framework for Wetland Inventory, Ramsar secretariat, Gland, Switzerland, 2004.
Revenga, C., Brunner, J., Henninger, N., Kassem, K., and Payne, R. (Eds.): Pilot Analysis of Global Ecosystems: Freshwater Sys-tems, World Resources Institute, Washington, D.C., 65 pp, 2000. Shindell, D. T., Walter, B. P., and Faluvegi, G.: Impacts of cli-mate change on methane emissions from wetlands, Geophys. Res. Lett., 31, L21202, doi:10.1029/2004GL021009, 2004. Shuttleworth, W. J.: Evaporation, in: Handbook of Hydrology 4.1–
4.53, edited by: Maidment, D. R., McGraw-Hill, New York, USA, 1992.
Song, C. C., Zhang, J. B., Wang, Y. Y., Wang, Y. S., and Zhao, Z. C.: Emission of CO2, CH4and N2O from freshwater marsh in
northeast of China, J. Environ. Manage., 40, 6879–6885, 2007. Song, C. C., Xu, X. F., Tian, H. Q., and Wang, Y. Y.:
Ecosystem-atmosphere exchange of CH4and N2O and ecosystem
respira-tion in wetlands in the Sanjiang Plain, Northeastern China, Glob. Change Biol., 15, 692–705, 2009.
Strack, M., Waddington, M., Turetsky, M., Roulet, N. T., and Byrne, K. A.: Northern peatlands, greenhouse gas exchange and climate change, in: Peatlands and climate change, Chapter 2, edited by: Strack, M., International Peat Society, Vapaudenkatu Jyv¨askyl¨a, Finland, 44–69, 2008.
Su, Y. H. and Zhang, W.: Building up annual series of cropland acreage in Sanjiang Plain in the last 50 years, Geogr. Geo-Information Science, 24, 72–75, 2008 (in Chinese with English abstract).
Sun, L. and Song, C. C.: Evapotranspiration from a freshwater marsh in the Sanjiang Plain, Northeast China, J. Hydrol., 352, 202–210, 2008.
Updegraff, K., Bridgham, S. D., Pastor, J., Weishampel, P., and Harth, C.: Response of CO2and CH4emissions from peatlands
van Bodegom, P. M., Leffelaar, P. A., Stams, A. J. M., and Wass-mann, R.: Modeling methane emissions from rice fields: Vari-ability, uncertainty, and sensitivity analysis of processes in-volved, Nutr. Cycl. in Agroecosys., 58, 231–248, 2000. Vepraskas, M. J. and Caldwell, P. V.: Interpreting morphological
features in wetland soils with a hydrological model, Catena, 73, 153–165, 2008.
Wang, A. H., Zhang, S. Q., and He, Y. F.: Study on dynamic change of mire in Sanjiang Plain based on RS and GIS, Sci. Geogr. Sin., 22, 636–640, 2002 (in Chinese with English abstract).
Wang, A. H., Zhang, S. Q., and Zhang, B.: A study on the change of spatial pattern of wetland in the Sanjiang Plain, Acta Ecological Sinca, 23, 237–243, 2003a (in Chinese with English abstract). Wang, D. X., Ding, W. X., Wang, Y. Y.: Influence of major
envi-ronmental factors on difference of methane emission from Zoige plateau and Sanjiang Plain wetland, Wetland Sci., 1, 63–67, 2003b (in Chinese with English abstract).
Wang, Y. J., Wang, J. X., Lin, J., Zhou, R. C., Wang, C. Z.: Study on the above-ground biomass of four species of herbaceous plant on the Sanjiang Plain, Territ. Nat. Resour. Stud., 2, 73–76, 1993 (in Chinese).
Wang, Z. M., Zhang, B., Zhang, S. Q., Li, X. Y., Liu, D. W., Song, C. C., Li, J. P., Li, F., and Duan, H. T.: Changes of land use and of ecosystem service values in Sanjiang Plain, northeast China, Environ. Monit. Assess., 112, 69–91, 2006.
Wang, Z. M., Song, K. S., Liu, D. W., Zhang, B., Zhang, S. Q., Li, F., Ren, C. Y., Jin, C., Yang, T., and Zhang, C. H.: Process of land conversion from marshland into cropland in the Sanjiang Plain during 1954–2009, Wetland Sci., 7, 208–217, 2009 (in Chinese with English abstract).
Wilby, R. L., Charles, S. P., Zorita, E., Timbal, B., Whetton, P., and Mearns, L. O.: Guidelines for use of climate scenarios developed from statistical downscaling methods, Supporting material of the Intergovernmental Panel on Climate Change, available from the DDC of IPCC TGCIA, 27, 2004.
Xu, X. F. and Tian, H. Q.: Methane exchange between the marsh-land and the atmosphere over China during 1949–2008, Glob. Biogeochem. Cy., 26, GB2006, doi:10.1029/2010GB003946, 2012.
Yang, J. S., Liu, J. S., Wang, J. D., Yu, J. B., Sun, Z. G., and Li, X. H.: Emissions of CH4and N2O from a wetland in the
San-jiang Plain, J. Plant Ecol., 30, 432–440, 2006a (in Chinese with English abstract).
Yang, W. Y., Song, C. C., Zhang, J. B.: Dynamics of methane emis-sions from a freshwater marsh of northeast China, Sci. Total En-viron., 371, 286–292, 2006b.
Yang, Y., Wang, S., He, T., Tian, K., and Yang, B.: Study on plant biomass and its seasonal dynamics of typical wetland ecosystems in the Sanjiang Plain, Grassland China, 24, 1–7, 2002 (in Chinese with English abstract).
Yu, Y., Yu, R., Zhang, X., and Liu, H.: A flexible coupled ocean-atmosphere general circulationmode1, Adv. Atmos. Sci., 19, 169–190, 2002.
Yu, Y., Zhang, X., and Guo, Y.: Global coupled ocean-atmosphere general circulation models in LASG/IAP, Adv. Atmos. Sci., 21, 444–455, 2004.
Zhang, J., Ma, K., and Fu, B.: Wetland loss under the impact of agri-cultural development in the Sanjiang Plain, NE China, Environ. Monit. Assess., 166, 139–148, 2010.
Zhang, L. H., Song, C. C., Zheng, X. H., Wang, D. X., and Wang, Y. Y.: Effects of nitrogen on the ecosystem respiration, CH4and N2O emissions to the atmosphere from the freshwater marshes
in northeast China, Environ. Geol., 52, 529–539, 2007.
Zhang, S. Q., Wang, A. H., Zhang, J. Y., and Zhang, B.: The spatial temporal dynamic characteristics of the marsh in the Sanjiang Plain, J. Geogr. Sci., 13, 201–207, 2003.
Zhang, S. W., Zhang, Y. Z., L, Y., and Chang, L. P.: Spatial and temporal variations in marshlands and its ecological effects, in: Analysis of the spatial and temporal characteristics of landuse and cover in the northeast, Chapter 7, edited by: Zhang, S. W., Zhang, Y. Z., L, Y., and Chang, L. P., Science Press, Beijing, China, 279–312, 2006 (in Chinese).
Zhang, W. J., Xiao, H. A., Tong, C. L., Su, Y. R., Xiang, W. S., Huang, D. Y., Syers, J. K., and Wu, J. S.: Estimating organic carbon storage in temperate wetland profiles in Northeast China, Geoderma, 146, 311–316, 2008.
Zhang, Y., Li, C. S., Trettin, C. C., Li, H., and Sun, G.: An inte-grated model of soil, hydrology, and vegetation for carbon dy-namics in wetland ecosystems, Glob. Biogeochem. Cy., 16, 1061, doi:10.1029/2001GB001838, 2002.
Zhao, C. Y., Ren, G. Y., Zhang, Y. F., and Wang, Y.: Climate change of the northeast China over the past 50 years, J. Arid Land Re-sour. Environ., 23, 25–30, 2009 (in Chinese with English ab-stract).
Zhao, X. S., Huang, Y., Jia, Z. J., Liu, H. Z., Song, T., Wang, Y. S., Shi, L. Q., Song, C. C., and Wang, Y. Y.: Effects of the conver-sion of marshland to cropland on water and energy exchanges in northeastern China, J. Hydrol., 355, 181–191, 2008.
Zhou, D. M., Gong, H. L., Wang, Y. Y., Khan, S., and Zhao, K. Y.: Driving forces for the marsh wetland degradation in the honghe national nature reserve in Sanjiang Plain, northeast China, Envi-ron. Model Assess., 14, 101–111, 2009.
Zhou, W. M., Wang, J. D., and Liu, J. S.: Study on the relation of plant biomass and CH4, N2O emission in the wetland of Sanjiang
Plain, Journal of the Graduate School of the Chinese Academy of Sciences, 23, 736–743, 2006 (in Chinese with English abstract). Zhuang, Q. L., Mellillo, J. M., Sarofim, M. C., Kicklighter, D. W., McGuire, A. D., Felzer, B. S., Sokolov, A., Prinn, R. G., Steudle, P. A., and Hu, S. M.: CO2 and CH4 exchanges