ACPD
8, 3405–3430, 2008Climate and emission changes over Canada
and Mexico
E. Tagaris et al.
Title Page
Abstract Introduction
Conclusions References
Tables Figures
◭ ◮
◭ ◮
Back Close
Full Screen / Esc
Printer-friendly Version
Interactive Discussion
EGU
Atmos. Chem. Phys. Discuss., 8, 3405–3430, 2008 www.atmos-chem-phys-discuss.net/8/3405/2008/ © Author(s) 2008. This work is licensed
under a Creative Commons License.
Atmospheric Chemistry and Physics Discussions
The role of climate and emission changes
in future air quality over southern Canada
and northern Mexico
E. Tagaris1, K.-J. Liao1, K. Manomaiphiboon1,*, S. He2, J.-H. Woo2,**, P. Amar2, and A. G. Russell1
1
School of Civil and Environmental Engineering, Georgia Institute of Technology, 311 Ferst Drive, Atlanta, GA 30332, USA
2
Northeast States for Coordinated Air Use Management (NESCAUM), 101 Merrimac Street, 10th Floor Boston, MA 02114, USA
*
now at: Joint Graduate School of Energy and Environment, King Mongkut’s University of Technology Thonburi, Bangkok, Thailand
**
now at: Department of Advanced Technology Fusion, Konkuk University, Seoul, Korea
Received: 13 November 2007 – Accepted: 14 January 2008 – Published: 18 February 2008
ACPD
8, 3405–3430, 2008Climate and emission changes over Canada
and Mexico
E. Tagaris et al.
Title Page
Abstract Introduction
Conclusions References
Tables Figures
◭ ◮
◭ ◮
Back Close
Full Screen / Esc
Printer-friendly Version
Interactive Discussion
EGU Abstract
Potential impacts of global climate and emissions changes on regional air quality over southern (western and eastern) Canada and northern Mexico are examined by
com-paring future summers’ (i.e., 2049–2051) average regional O3 and PM2.5
concentra-tions with historic concentraconcentra-tions (i.e., 2000–2002 summers). Air quality modeling
5
was conducted using CMAQ and meteorology downscaled from the GISS-GCM using MM5. Emissions for North America are found using US EPA, Mexican and Canadian inventories and projected emissions following CAIR and IPCC A1B emissions scenario. Higher temperatures for all sub-regions and regional changes in mixing height, inso-lation and precipitation are forecast in the 2049–2051 period. Future emissions are
10
calculated to be lower over both Canadian sub-regions, but higher over northern
Mex-ico. Global climate change, alone, is predicted to affect PM2.5 concentrations more
than O3: M8hO3 concentrations are estimated to be slightly different in all examined
sub-regions while PM2.5concentrations are estimated to be higher over both Canadian
sub-regions (8% over western and 3% over eastern) but 11% lower over northern
Mex-15
ico. Climate change combined with the projected emissions lead to greater change
in pollutant concentrations: M8hO3concentrations are simulated to be 6% lower over
western Canada and 8% lower over eastern Canada while PM2.5 concentrations are
simulated to be 5% lower over western Canada and 11% lower over eastern Canada. Although future emissions over northern Mexico are projected higher, pollutant
con-20
centrations are simulated to be lower due to US emissions reductions. Global climate
change combined with the projected emissions will decrease M8hO3 4% and PM2.5
17% over northern Mexico.
1 Introduction
Global climate and emissions changes are critical factors for future air quality. Although
25
ACPD
8, 3405–3430, 2008Climate and emission changes over Canada
and Mexico
E. Tagaris et al.
Title Page
Abstract Introduction
Conclusions References
Tables Figures
◭ ◮
◭ ◮
Back Close
Full Screen / Esc
Printer-friendly Version
Interactive Discussion
EGU
(e.g. Mickley et al., 2004; Hogrefe et al., 2004; Knowlton et al., 2004; Murazaki and Hess, 2006; Langner et al., 2005) and have been summarized by Tagaris et al. (2007)
there are limited studies examining the effect of long term emission changes on air
quality. Dentener et al. (2006) recently compared the global atmospheric environment
for the years 2000 and 2030 using global atmospheric chemistry models and different
5
emissions scenarios. Different emissions scenarios result in different global and
re-gional ozone levels, while climate change alone seems to play a minor role. Tagaris et al. (2007) examined the impacts of global climate and emissions changes on regional ozone and fine particulate matter concentrations over the United States. They found that the impacts of climate change alone on regional air quality over US are small
com-10
pared to the impacts from emission control-related reductions, although increases in pollutant concentrations due to stagnation events are found.
Most of the aforementioned studies focus on the US. However, it is equally important to investigate the impact of the climate and emissions changes to the border US re-gions, given that a large part of Mexican and Canadian population lives there and will
15
both affect and be affected by pollutant transport. These border regions are some of
the most dynamic regions of North America in economic, environmental, demographic and cultural terms. Extending the study by Tagaris et al. (2007), the impacts of global climate and emissions change on regional air quality over northern Mexico and
south-ern Canada are assessed. Future O3 and PM2.5 concentrations for northern Mexico
20
and southern Canada are compared to historic ones under two different cases: i) the
impacts of changes on regional air quality by climate change alone are examined by keeping emissions sources, activity levels and controls constant, and ii) the future pol-lutant concentrations are estimated based on changes in both climate and emissions using the IPCC A1B emission scenarios (IPCC, 2000) and planned controls. This is the
25
first study examining the impacts of climate and emissions changes in these regions
ACPD
8, 3405–3430, 2008Climate and emission changes over Canada
and Mexico
E. Tagaris et al.
Title Page
Abstract Introduction
Conclusions References
Tables Figures
◭ ◮
◭ ◮
Back Close
Full Screen / Esc
Printer-friendly Version
Interactive Discussion
EGU
2 Methods
Following the same methodology as described in details by Tagaris et al. (2007), and summarized below, we use the Goddard Institute of Space Studies (GISS) II’ (Rind et al., 1999) global results downscaled using the Penn State/NCAR Mesoscale Model (MM5) (Grell et al., 1994), forecast North American emissions and the Community
5
Multiscale Air Quality model (CMAQ) (Binkowski and Roselle 2003) to simulate historic
and future air quality. The primary difference between this study and the former is that
improved emissions became available for Canada and Mexico.
The Environment Canada’s 2000 inventory has been used for area and mobile
Canadian sources (http://www.epa.gov/ttn/chief/net/canada.html). For point sources,
10
the 2002 inventory that the New York State Department of Environmental Conserva-tion compiled using the Canadian NaConserva-tional PolluConserva-tion Release Inventory (NPRI) was scaled using Environment Canada’s state level summary. For Mexico, the US EPA’s 1999 Big Bend Regional Aerosol and Visibility Observational (BRAVO) Study Emis-sions Inventory was updated with the Mexico National EmisEmis-sions Inventory (NEI)
15
(http://www.epa.gov/ttn/chief/net/mexico.html). The 2001 Clean Air Interstate Rule (CAIR) emission inventory is used for the U.S. for the early 21st century, as well as
the basis for projected emissions up to 2020 (Woo et al., 2006, 20071). Far future
(2020–2050) projections of emissions are carried out based on the Netherlands Envi-ronmental Assessment Agency’s Integrated Model to Assess the Global Environment
20
(IMAGE). IMAGE uses widely accepted scenarios (i.e. Intergovernmental Panel on climate Change (IPCC) Special Report on Emissions Scenarios (SRES)) which are consistent with the scenario IPCC-A1B and the climate/meteorological modeling used here.
1
ACPD
8, 3405–3430, 2008Climate and emission changes over Canada
and Mexico
E. Tagaris et al.
Title Page
Abstract Introduction
Conclusions References
Tables Figures
◭ ◮
◭ ◮
Back Close
Full Screen / Esc
Printer-friendly Version
Interactive Discussion
EGU
Meteorological fields are derived from the GISS GCM II’, which was applied at a
horizontal resolution of 4◦
latitude by 5◦
longitude to simulate current and future cli-mate at global scale (Mickley et al., 2004). The simulation followed the IPCC-A1B emission scenario (IPCC, 2000) for greenhouse gases. Leung and Gustafson (2005) downscaled the GISS simulations for 1995–2005 and 2045–2055 using the Penn
5
State/NCAR Mesoscale Model (MM5) to the regional scale; no data assimilation has been used. Although there are uncertainties in using regionally downscaled climate in air quality simulations, this approach is necessary in air quality models that employ higher resolution meteorological fields produced by regional instead of global climate models (Gustafson and Leung, 2007). CMAQ with SAPRC-99 chemical mechanism is
10
used for the regional air quality modeling. O3 and PM2.5 concentrations for three
his-toric (2000–2002) summer (June–July–August) episodes are compared to three future (2049–2051) summer episodes. Regional concentrations are predicted for northern Mexico and western and eastern Canada (Fig. 1). To quantify the net impact of cli-mate change and the impact of clicli-mate change combined with projected emissions,
15
both the historic period and future cases are examined. Future cases are: i) using the 2001 emissions inventory for historic and future years to quantify the impact of climate change on air quality, and ii) using future forecast emissions along with forecast cli-mate to simulate future pollutant levels over northern Mexico and western and eastern Canada allowing the quantification of both impacts on future air quality.
20
3 Results and discussion
3.1 Meteorology
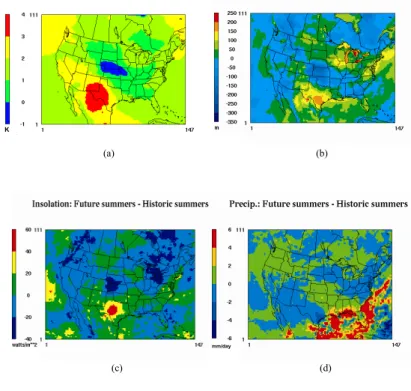
Statistics and spatial distributions for forecast temperature, mixing height, insolation and precipitation for northern Mexico and western and eastern Canada (Table 1 and Fig. 2a) show higher average temperatures. Northern Mexico is simulated to be the
25
tem-ACPD
8, 3405–3430, 2008Climate and emission changes over Canada
and Mexico
E. Tagaris et al.
Title Page
Abstract Introduction
Conclusions References
Tables Figures
◭ ◮
◭ ◮
Back Close
Full Screen / Esc
Printer-friendly Version
Interactive Discussion
EGU
perature is calculated 1.7 K and 1.5 K higher in western and eastern Canada, respec-tively. Locally changes up to 4 K in the northern Mexico and up to 3 K for Canada are forecast. The mixing heights are simulated to be higher in most of the northern
Mex-ico (average around +30 m). Maximum increases (around 200 m) are forecast near
the US border where the maximum temperature increase is also estimated. For both
5
the Canadian sub-regions mixing height is calculated to be lower in the majority of the
domain (average around−30 m) except the central part where a small increase is
esti-mated. The average insolation at the earth’s surface decreases by 10 Wm−2
in Canada
and increases by 3 Wm−2in Mexico. Insolation is simulated to be lower in most of the
Canadian sub-regions except the central part, while regional changes are expected in
10
the northern Mexico. Regional changes in daily precipitation are forecast with more precipitation in northern Mexico where the average daily change is up to 6 mm locally. Little change is expected for both Canadian sub-regions. Fewer rainy days are es-timated for the majority of the northern Mexican and western Canadian sub-regions in contrast to eastern Canada for which more rainy days are predicted (Fig. 2b). All
15
the mentioned local changes in climatic conditions will affect the future local pollutant
concentrations.
3.2 Emissions
Control strategies applied on anthropogenic Canadian sources result in significantly
lower NOx, SO2 and NH3 emissions in both Canadian sub-regions (Table 2). NOx
20
emissions are projected to be 32% and 50% lower in western and eastern Canada
respectively while SO2emissions are projected to be 64% and 74% lower in both areas,
respectively. NH3 emissions are projected to be 30% and 60% lower in western and
eastern Canada respectively. Emissions reduction of anthropogenic VOCs combined with the higher biogenic emissions in the warmer climate results in a small change
25
in VOC emissions: 6% higher in the western Canada and 10% higher in the eastern Canada.
ACPD
8, 3405–3430, 2008Climate and emission changes over Canada
and Mexico
E. Tagaris et al.
Title Page
Abstract Introduction
Conclusions References
Tables Figures
◭ ◮
◭ ◮
Back Close
Full Screen / Esc
Printer-friendly Version
Interactive Discussion
EGU
inventory is kept the same, emissions are not, since some pollutant emissions (e.g.,
biogenic and mobile) depend on meteorology. A minor increase in NOx emissions in
both Canadian sub-regions is calculated but VOC emissions will be higher in the future (up to 19% in western Canada) due to climate change alone (Table 2).
For Mexico, the growth of the industrial sector leads to significantly higher
emis-5
sions (Table 2). NOx, SO2, VOCs and NH3emissions are projected to be 99%, 88%,
24% and 220% higher in the future summers in the northern Mexico. For the case
where only climatic changes are considered a minor increase in NOx emissions is
calculated. VOC emissions are projected to be much higher in the future due to cli-mate change alone (around 24%), but slightly lower when emissions projection is used
10
caused by the higher projected VOC emissions by human activities. Spatial distri-bution plots of emissions rate changes for the historic and future summers are
pre-sented in auxiliary materials. http://www.atmos-chem-phys-discuss.net/8/3405/2008/
acpd-8-3405-2008-supplement.pdf
3.3 Air quality
15
3.3.1 Ozone
The impact of climate change alone and the combined effect of climate and emissions
changes on M8hO3 are illustrated in Fig. 3a. Under the impact of climate change
alone the average M8hO3 concentrations are estimated to be 0.1 ppb higher (0.1%)
over western Canada, 0.6 ppb lower (2%) over eastern Canada and 0.5 ppb higher
20
(1%) over northern Mexico (Fig. 3, Table 3). Global climate change combined with the projected emissions are calculated to reduce the atmospheric pollutant
concen-trations. Average M8hO3 concentrations are estimated to be 3 ppb lower (6%) over
western Canada, 3 ppb lower (8%) over eastern Canada and 2 ppb lower (4%) over northern Mexico (Fig. 3, Table 3). Interestingly, although future emissions over
north-25
ern Mexico are projected higher, pollutant concentrations are forecast to be lower. This
ACPD
8, 3405–3430, 2008Climate and emission changes over Canada
and Mexico
E. Tagaris et al.
Title Page
Abstract Introduction
Conclusions References
Tables Figures
◭ ◮
◭ ◮
Back Close
Full Screen / Esc
Printer-friendly Version
Interactive Discussion
EGU
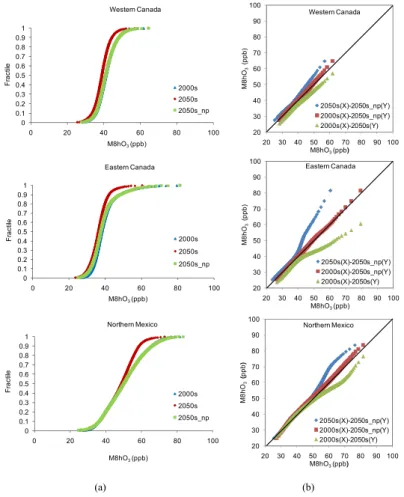
over Mexico (Figures are presented in auxiliary materials). Both Canadian sub-regions
are simulated to have lower future M8hO3 concentrations due to emissions reduction
(2050s) shown by their Cumulative Distribution Functions (CDFs) (Fig. 4). Significant reductions are expected for the concentrations above 50 ppb, especially over eastern
Canada. The same trend is found for M8hO3concentrations over northern Mexico with
5
significant reductions in concentrations above 60 ppb.
Here, boundary conditions for both historic and future periods are kept the same due to uncertainties in future global changes. Setting varying boundary conditions
affect our ability to isolate the impacts of regional climate and emissions changes.
Fur-ther, calculations were repeated excluding five grid cells deep of the outer perimeter of
10
modeling domain (Giorgi and Bates, 1989), with negligible change. Regional average concentrations are similar since the winds typically come from the west well away from the land.
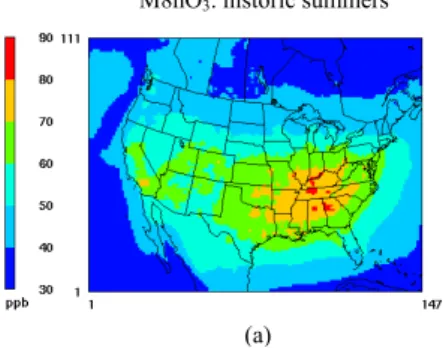
Over Canadian sub-regions, typical M8hO3concentrations are calculated to be
be-tween 30 and 50 ppb (Fig. 5a). Climate change alone is simulated to increase M8hO3
15
concentrations up to 1 ppb in the center of Canada but a reduction of up to 2 ppb is estimated for the rest of Canada (Fig. 5c). Emission controls are expected to reduce
M8hO3 concentrations up to 5 ppb in both Canadian sub-regions (Fig. 5d). The
com-bined effect of climate change and emissions changes is also found to reduce M8hO3
concentrations (up to 5 ppb) in both Canadian sub-regions (Fig. 5b). Over northern
20
Mexico, the highest forecast M8hO3 concentrations are calculated between 50 and
60 ppb near the US border (Fig. 5a). Climate change alone is simulated to increase
M8hO3concentrations up to 4 ppb in the east but to decrease it up to 3 ppb in the west
(Fig. 5c). Emissions changes are expected to reduce M8hO3 concentrations up to
5 ppb near the US border while it is expected an increase up to 5 ppb on the west coast
25
due to emission increases (Fig. 5d). The combined effect of climate change and
emis-sion changes are found to reduce M8hO3concentrations up to 5 ppb in the majority of
ACPD
8, 3405–3430, 2008Climate and emission changes over Canada
and Mexico
E. Tagaris et al.
Title Page
Abstract Introduction
Conclusions References
Tables Figures
◭ ◮
◭ ◮
Back Close
Full Screen / Esc
Printer-friendly Version
Interactive Discussion
EGU
3.3.2 Particulate matter
Global climate change alone has a significant effect on future summer PM2.5
con-centrations over western and eastern Canada and northern Mexico as compared to
O3, as changes in temperature and precipitation impact gas phase partitioning and
wet deposition of particulate matter. Average PM2.5 concentrations are estimated to
5
be 0.3µg/m3 higher (8%) over western Canada, 0.1 µg/m3higher (3%) over eastern
Canada and 0.4µg/m3 lower (11%) over northern Mexico (Fig. 3, Table 3). These
changes come mainly in SO=4 and OC over Canada (western Canada: SO=40.1µg/m3
higher (12%), OC 0.1µg/m3 higher (7%), eastern Canada: SO=40.01µg/m3 higher
(0.6%), OC 0.06µg/m3 higher (6%)) and from SO=4 over northern Mexico (0.3µg/m3
10
lower (14%)). PM2.5 composition will be slightly different due to climate change alone
(Fig. 6, Table 4). Global climate change combined with the projected emission changes
is simulated to reduce the atmospheric pollutant concentrations. Average PM2.5
con-centrations are estimated to be 0.2µg/m3lower (5%) over western Canada, 0.3µg/m3
lower (11%) over eastern Canada (Fig. 3, Table 3). PM2.5 composition is calculated
15
to be significantly modified setting OC as the dominant component followed by sulfate
(Table 4). Over northern Mexico, average PM2.5 concentrations are estimated to be
0.6µg/m3lower (17%) (Fig. 3, Table 3). No significant change in PM2.5composition is
expected with sulfate to be the dominant component (about 50%) (Table 4). Although
there is no change in the lower PM2.5concentrations (i.e., below 7µg/m
3
) there are
sig-20
nificant reductions in the higher levels in eastern Canada and northern Mexico when climate change and emissions projection are considered (Fig. 7).
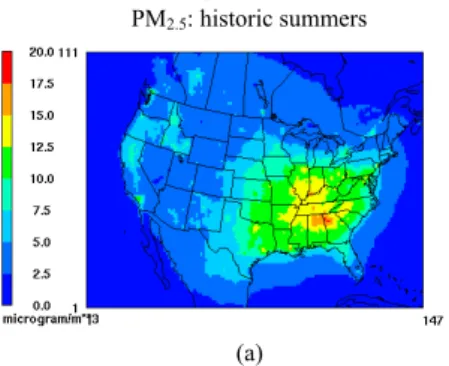
Spatial distribution plots for average PM2.5 concentrations for historic years and the
changes caused by climate and emission projection are presented in Fig. 8. Over the
majority of both Canadian sub-regions average PM2.5 concentrations are calculated
25
between 2.5 and 5.0µg/m3 (Fig. 8a). Climate change alone is simulated to increase
PM2.5concentrations up to 0.5µg/m
3
in the majority of Canadian sub-regions except
pro-ACPD
8, 3405–3430, 2008Climate and emission changes over Canada
and Mexico
E. Tagaris et al.
Title Page
Abstract Introduction
Conclusions References
Tables Figures
◭ ◮
◭ ◮
Back Close
Full Screen / Esc
Printer-friendly Version
Interactive Discussion
EGU
jection is expected to reduce PM2.5 concentrations up to 1µg/m
3
in the major part
of both Canadian sub-regions, but there are small areas with reductions up to 2µg/m3
(Fig. 8d). The combined effect of climate change and emissions projection is estimated
to reduce PM2.5concentrations up to 1µg/m
3
in both Canadian sub-regions but there
are small areas where increase up to 1µg/m3 is projected (Fig. 8b). Over Northern
5
Mexico average PM2.5 concentrations are simulated higher in the northeast part with
average concentrations up to 7.5µg/m3(Fig. 8a). Climate change alone is calculated
to decrease PM2.5concentrations up to 1µg/m
3
in the central part (Fig. 8c). Emissions
projection is expected to reduce PM2.5concentrations up to 1µg/m
3
near US borders
while an increase up to 1µg/m3is expected in the west coast (Fig. 8d). The combined
10
effect of climate change and emissions projection is estimate to reduce PM2.5
con-centrations up to 2µg/m3in the north eastern region close to US borders while small
increases are expected in the west (Fig. 8b).
Comparing the effects caused by climate and emission changes between the
sub-regions examined here and the US sub-sub-regions (Tagaris et al., 2007) it is revealed that
15
climate change alone is not expected to significantly modify summer M8hO3
concen-trations over Canadian, Mexican and US sub-regions. The effect of climate change on
PM2.5concentrations is expected to reduce summer concentrations over US and
Mex-ico, they are more important over the Plains, Midwest and Southeast US sub-regions
and Northern Mexico where significant reductions are expected in PM2.5 levels, but
20
over both Canadian sub-regions small increases are forecast. The combined effect
of climate change and projected emissions changes are simulated to reduce M8hO3
and PM2.5concentrations over Canadian and Mexican sub-regions, but this reduction
is much lower compared to the reduction simulated for the US sub-regions due to the projected greater emissions reductions in the latter.
ACPD
8, 3405–3430, 2008Climate and emission changes over Canada
and Mexico
E. Tagaris et al.
Title Page
Abstract Introduction
Conclusions References
Tables Figures
◭ ◮
◭ ◮
Back Close
Full Screen / Esc
Printer-friendly Version
Interactive Discussion
EGU
4 Conclusions
Global climate change impacts on air quality over western and eastern Canada and
northern Mexico are simulated to change future summer PM2.5concentrations but have
little impact on O3 levels. Global climate change combined with projected emission
changes is simulated to reduce pollutants concentrations in all examined sub-regions.
5
One of the most important findings of this study is that although future emissions over northern Mexico are projected to be higher, future pollutant concentrations are not as
reductions in the US provide benefits to the south. PM2.5composition is calculated to
be slightly different due to climate change alone but when projected emissions are
con-sidered, it is calculated to be significantly changed over Canadian sub-regions setting
10
OC as the dominant component followed by sulfate. Over northern Mexico sulfate is
simulated to continue to be the dominant PM2.5component.
Acknowledgements. This work was supported by US EPA Science To Achieve Results (STAR)
grants: RD83096001, RD82897602 , RD83183801 and RD83107601. The views expressed in this paper are those of the authors and do not necessarily reflect the views or policies of the
15
EPA. We would like to acknowledge L. Mickley from Harvard University for the GISS simulations, L. R. Leung from Pacific Northwest National Laboratory for MM5 data, Y. Hu and S.-K. Parker for their assistance and suggestions.
References
Binkowski, F. S. and Roselle, S. J.: Models-3 Community Multiscale Air Quality (CMAQ)
20
model aerosol component 1. Model description, J. Geophys. Res., 108(D6), 4183, doi:10.1029/2001JD001409, 2003.
Dentener, F., Stevenson, D., Ellingsen, K., Van Noije, T., Scultze, M. et al.: The global atmo-spheric environment for the next generation, Environ. Sci. Technol.,40, 3586–3594, 2006. Giorgio F. and Cates, G. T. : The climatological skill of a regional model over cpmpplex terrain,
25
ACPD
8, 3405–3430, 2008Climate and emission changes over Canada
and Mexico
E. Tagaris et al.
Title Page
Abstract Introduction
Conclusions References
Tables Figures
◭ ◮
◭ ◮
Back Close
Full Screen / Esc
Printer-friendly Version
Interactive Discussion
EGU
Grell, G., Dudhia, J., and Stauffer, D. R.: A description of the fifth generation Penn State/NCAR
mesoscale model (MM5), NCAR Tech. Note, NCAR/TN-398+STR, Natl. Center for Atmos.
Res., Boulder, Colorado, 1994.
Gustafson Jr., W. I. and Leung, L. R.: Regional downscaling for air quality assessment. A reasonable proposition?, B. Am. Meteorol. Soc., 2007, 1215–1227, 2007.
5
Hogrefe, C., Lynn, B., Civerolo, K., Ku, J-Y., Rosenthal, J., Rosenzweig, C., Goldberg, R.,
Gaffin, S., Knowlton, K., and Kinney, P. L.: Simulating changes in regional air pollution over
the eastern United States due to changes in global and regional climate and emissions, J. Geophy. Res., 109, D22301, doi:10.1029/2004JD004690, 2004.
IPCC (Intergovernmental Panel on Climate Change): Emissions Scenarios, Cambridge
Univer-10
sity Press, Cambridge, UK, 2000.
Knowlton, K., Rosenthal, J. E., Hogrefe, C., Lynn, B., Gaffin, S., Goldberg, R., Rosenzweig, C.,
Civerolo, K., Ku, J. Y., and Kinney, P. L.: Assessing ozone related health impacts under a changing climate, Environ. Health Perspect., 112(115), p. 1557, 2004.
Langner, J., Bergstrom, R., and Foltescu, V.: Impact of climate change on surface ozone and
15
deposition of sulphur and nitrogen in Europe, Atmos. Environ., 39, 1129–1141, 2005. Leung, L. R. and Gustafson Jr., W. I.: Potential regional climate and implications to U.S. air
quality, Geophys. Res. Lett., 32, L16711, doi:10.1029/2005GL022911, 2005.
Mickley, L. J., Jacobs, D. J., Field, B. D., and Rind, D.: Effects of future climate change
on regional air pollution episodes in the United States, Geophys. Res. Lett.,31, L24103,
20
doi:10.1029/2004GL021216, 2004.
Murazaki, K. and Hess, P.: How does climate change contribute to surface ozone change over the United States, J. Geophys. Res., 111, D05301, doi:10.1029/2005JD005873, 2006. Rind, D., Lerner, J., Shah, K., and Suozzo, R.: Use of on line tracers as a diagnostic tool
in general circulation model development: 2. Transport between the troposphere and the
25
stratosphere, J. Geophys. Res., 104, 9123–9139, 1999.
Tagaris, E., Manomaiphiboon, K., Liao, K. J., Leung, L. R., Woo, J. H., He, S., Amar, P., and Russell, A. G.: Impacts of global climate change and emissions on regional ozone and fine particulate matter concentrations over the United States, J. Geophys. Res., 112, D14312, doi:10.1029/2006JD008262, 2007.
30
In-ACPD
8, 3405–3430, 2008Climate and emission changes over Canada
and Mexico
E. Tagaris et al.
Title Page
Abstract Introduction
Conclusions References
Tables Figures
◭ ◮
◭ ◮
Back Close
Full Screen / Esc
Printer-friendly Version
Interactive Discussion
EGU
ventory Conference Reinventing Inventories New Ideas in New Orleans 16–18 May, New
Or-leans, Louisiana, available at: http://www.epa.gov/ttn/chief/conference/ei15/session4/woo2.
ACPD
8, 3405–3430, 2008Climate and emission changes over Canada
and Mexico
E. Tagaris et al.
Title Page
Abstract Introduction
Conclusions References
Tables Figures
◭ ◮
◭ ◮
Back Close
Full Screen / Esc
Printer-friendly Version
Interactive Discussion
EGU
Table 1.Regional average climatic parameters for the three historic and future summers.
Temperature Mixing height Insolation Daily Precipitation
(K) (m) (Watt/m2) (mm)
Historic Future Historic Future Historic Future Historic Future
Western Canada
287.3 289.0 867.4 837.8 188.1 179.8 2.1 2.0
Eastern Canada
287.9 289.4 919.3 884.8 168.7 158.1 2.5 2.5
Northern Mexico
ACPD
8, 3405–3430, 2008Climate and emission changes over Canada
and Mexico
E. Tagaris et al.
Title Page
Abstract Introduction
Conclusions References
Tables Figures
◭ ◮
◭ ◮
Back Close
Full Screen / Esc
Printer-friendly Version
Interactive Discussion
EGU
Table 2. Regional average emissions rates (tons/day) for historic and future summers us-ing emissions projections (Future) and no emissions projection (Future np*) and the relative change (%) based on the historic emissions.
*np: 2001 emission inventory and 2050 meteorology.
NOx(tons/day) SO2(tons/day) VOCs (tons/day) NH3(tons/day)
Historic Future Future np Historic Future Future np Historic Future Future np Historic Future Future np
Western 3.68 2.49 3.72 1.84 0.67 1.84 23.11 24.49 27.50 0.92 0.65 0.92
Canada (−32.4%) (1.0%) (−63.9%) (0.0%) (5.6%) (19.0%) (−29.6%) (0.0%)
Eastern 1.82 0.92 1.84 1.58 0.41 1.58 21.97 24.10 25.12 0.38 0.16 0.38
Canada (−49.8%) (0.6%) (−74.2%) (0.0%) (9.7%) (14.4%) (−59.2%) (0.0%)
Northern 2.32 4.60 2.39 1.88 3.53 1.88 29.61 36.81 36.78 1.22 3.89 1.22
ACPD
8, 3405–3430, 2008Climate and emission changes over Canada
and Mexico
E. Tagaris et al.
Title Page Abstract Introduction Conclusions References Tables Figures ◭ ◮ ◭ ◮ Back Close
Full Screen / Esc
Printer-friendly Version
Interactive Discussion
EGU
Table 3. Regional average M8hO3 and PM2.5 concentrations and PM2.5 composition for the historic and future summers using emissions projection (Future) and no emissions projection (Future np*) and the relative change (%) based on the historic emissions.
*np: 2001 emission inventory and 2050 meteorology.
Western Canada Eastern Canada Northern Mexico
Components (µg/m3) Historic Future Future np Historic Future Future np Historic Future Future np
M8hO3(ppb) 41.6 39.0
(−6.2%)
41.7 (0.1%)
39.4 36.2
(−8.1%)
38.8 (−1.6%)
50.4 48.6
(−3.5%)
50.9 (1.0%) PM2.5(µg/m
3) 3.44 3.26
(−5.0%)
3.71 (7.9%)
2.52 2.23
(−11.4%)
2.60 (3.3%)
3.71 3.09
(−16.7%)
3.31 (−10.6%)
PM2.5components (µg/m3)
SO=4 1.07 0.76
(−28.5%)
1.19 (11.7%)
0.99 0.68
(−31.7%)
1.00 (0.6%)
1.98 1.53
(−22.7%)
1.71 (−13.7%)
NH+
4 0.35 0.23
(−34.1%)
0.37 (7.7%)
0.19 0.13
(−30.2%)
0.19 (1.9 %)
0.64 0.58
(−9.5%)
0.57 (−11.4%)
NO−
3 0.09 0.04
(−57.8%)
0.08 (−9.5%)
0.02 0.00
(−78.6%)
0.02 (−7.6%)
0.02 0.05
(129.3%) 0.01 (−37.2%)
EC 0.08 0.05
(−37.5%)
0.08 (1.5%)
0.04 0.02
(−45.8%)
0.04 (2.6%)
0.07 0.04
(−34.8%)
0.07 (0.4%)
OC 1.16 1.19
(2.0%) 1.25 (7.2%) 0.93 0.93 (0.8%) 0.98 (6.2%) 0.46 0.41
(−10.2%)
0.43 (−6.8%)
OTHER 0.70 1.00
(43.5%) 0.74 (6.4%) 0.34 0.45 (32.8%) 0.36 (4.4%) 0.54 0.48
(−12.6%)
ACPD
8, 3405–3430, 2008Climate and emission changes over Canada
and Mexico
E. Tagaris et al.
Title Page
Abstract Introduction
Conclusions References
Tables Figures
◭ ◮
◭ ◮
Back Close
Full Screen / Esc
Printer-friendly Version
Interactive Discussion
EGU
Table 4. Regional average PM2.5composition (%) for the historic and future summers using emissions projection (Future) and no emissions projection (Future np*).
*np: 2001 emission inventory and 2050 meteorology.
Western Canada Eastern Canada Northern Mexico
Components ( %) Historic Future Future np Historic Future Future np Historic Future Future np
SO=4 31 23 32 39 31 38 53 50 52
NH+4 10 7 10 7 6 7 17 19 17
NO−
3 3 1 2 1 0 1 1 2 0
EC 2 2 2 2 1 2 2 1 2
OC 34 36 34 37 42 38 12 13 13
ACPD
8, 3405–3430, 2008Climate and emission changes over Canada
and Mexico
E. Tagaris et al.
Title Page
Abstract Introduction
Conclusions References
Tables Figures
◭ ◮
◭ ◮
Back Close
Full Screen / Esc
Printer-friendly Version
Interactive Discussion
EGU
ACPD
8, 3405–3430, 2008Climate and emission changes over Canada
and Mexico
E. Tagaris et al.
Title Page
Abstract Introduction
Conclusions References
Tables Figures
◭ ◮
◭ ◮
Back Close
Full Screen / Esc
Printer-friendly Version
Interactive Discussion
EGU
(a) (b)
(c) (d) K
mm/day
Fig. 2a. Spatial distribution plots of the average changes in climatic parameters between the
three historic and future summers(a): temperature,(b): planetary boundary level (PBL height),
ACPD
8, 3405–3430, 2008Climate and emission changes over Canada
and Mexico
E. Tagaris et al.
Title Page
Abstract Introduction
Conclusions References
Tables Figures
◭ ◮
◭ ◮
Back Close
Full Screen / Esc
Printer-friendly Version
Interactive Discussion
EGU
ACPD
8, 3405–3430, 2008Climate and emission changes over Canada
and Mexico
E. Tagaris et al.
Title Page
Abstract Introduction
Conclusions References
Tables Figures
◭ ◮
◭ ◮
Back Close
Full Screen / Esc
Printer-friendly Version
Interactive Discussion
EGU
(a)
(b)
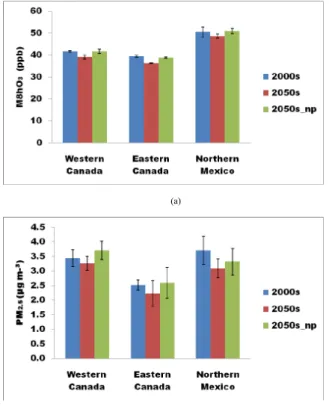
Fig. 3. (a) Mean maximum 8 h ozone concentrations (M8hO3) and standard deviations for
historic and future summers(b)Mean daily PM2.5 concentrations and standard deviations for
historic and future summers.
ACPD
8, 3405–3430, 2008Climate and emission changes over Canada
and Mexico
E. Tagaris et al.
Title Page Abstract Introduction Conclusions References Tables Figures ◭ ◮ ◭ ◮ Back Close
Full Screen / Esc
Printer-friendly Version Interactive Discussion EGU 0 0.1 0.2 0.3 0.4 0.5 0.6 0.7 0.8 0.9 1
0 20 40 60 80 100
Fr
act
ile
M8hO3(ppb)
Northern Mexico 2000s 2050s 2050s_np 0 0.1 0.2 0.3 0.4 0.5 0.6 0.7 0.8 0.9 1
0 20 40 60 80 100
Fr
act
ile
M8hO3(ppb)
Eastern Canada 2000s 2050s 2050s_np 0 0.1 0.2 0.3 0.4 0.5 0.6 0.7 0.8 0.9 1
0 20 40 60 80 100
F
ra
c
tile
M8hO3(ppb)
Western Canada 2000s 2050s 2050s_np 20 30 40 50 60 70 80 90 100
20 30 40 50 60 70 80 90 100
M8 h O3 ( ppb )
M8hO3(ppb)
2050s(X)-2050s_np(Y) 2000s(X)-2050s_np(Y) 2000s(X)-2050s(Y) Northern Mexico 20 30 40 50 60 70 80 90 100
20 30 40 50 60 70 80 90 100
M8
h
O3
(ppb)
M8hO3(ppb)
2050s(X)-2050s_np(Y) 2000s(X)-2050s_np(Y) 2000s(X)-2050s(Y) Eastern Canada 20 30 40 50 60 70 80 90 100
20 30 40 50 60 70 80 90 100
M8
h
O3
(ppb)
M8hO3(ppb)
Western Canada
2050s(X)-2050s_np(Y) 2000s(X)-2050s_np(Y) 2000s(X)-2050s(Y)
(a) (b)
Fig. 4.Daily maximum 8 h ozone concentration cumulative distribution function (CDF) plots(a)
for historic and future summers and the correlation(b)between the different examined cases.
ACPD
8, 3405–3430, 2008Climate and emission changes over Canada
and Mexico
E. Tagaris et al.
Title Page
Abstract Introduction
Conclusions References
Tables Figures
◭ ◮
◭ ◮
Back Close
Full Screen / Esc
Printer-friendly Version
Interactive Discussion
EGU
M8hO3: historic summers
(a)
M8hO3: future summers – historic summers
(b)
M8hO3: future_np summers – historic summers
(c)
M8hO3: future summers – future_np summers
(d)
Fig. 5. (a)Three-summer-average maximum 8 h ozone concentrations in historic years. (b)
Changes in concentrations under the impact of climate change and emission controls. (c)
Changes in concentrations under the impact of climate change alone.(d)Changes in
ACPD
8, 3405–3430, 2008Climate and emission changes over Canada
and Mexico
E. Tagaris et al.
Title Page
Abstract Introduction
Conclusions References
Tables Figures
◭ ◮
◭ ◮
Back Close
Full Screen / Esc
Printer-friendly Version
Interactive Discussion
EGU
Fig. 6.PM2.5composition for historic and future summers.
ACPD
8, 3405–3430, 2008Climate and emission changes over Canada
and Mexico
E. Tagaris et al.
Title Page Abstract Introduction Conclusions References Tables Figures ◭ ◮ ◭ ◮ Back Close
Full Screen / Esc
Printer-friendly Version Interactive Discussion EGU 0 0.1 0.2 0.3 0.4 0.5 0.6 0.7 0.8 0.9 1
0 5 10 15 20 25
Fr
act
ile
PM2.5(μg m-3)
Western Canada 2000s 2050s 2050s_np 0 0.1 0.2 0.3 0.4 0.5 0.6 0.7 0.8 0.9 1
0 5 10 15 20 25
Fr
a
c
ti
le
PM2.5(μg m-3)
Eastern Canada 2000s 2050s 2050s_np 0 0.1 0.2 0.3 0.4 0.5 0.6 0.7 0.8 0.9 1
0 5 10 15 20 25
Fr
a
c
ti
le
PM2.5(μg m-3)
Northern Mexico 2000s 2050s 2050s_np 0 5 10 15 20 25
0 5 10 15 20 25
PM 2. 5 ( μ g m -3)
PM2.5(μg m-3)
Western Canada 2050s(X)-2050s_np(Y) 2000s(X)-2050s_np(Y) 2000s(X)-2050s(Y) 0 5 10 15 20 25
0 5 10 15 20 25
PM 2. 5 ( μ g m -3)
PM2.5(μg m-3)
Eastern Canada 2050s(X)-2050s_np(Y) 2000s(X)-2050s_np(Y) 2000s(X)-2050s(Y) 0 5 10 15 20 25
0 5 10 15 20 25
PM 2. 5 ( μ g m -3)
PM2.5(μg m-3)
Northern Mexico
2050s(X)-2050s_np(Y) 2000s(X)-2050s_np(Y) 2000s(X)-2050s(Y)
(a) (b)
Fig. 7. Daily average PM2.5 concentration cumulative distribution function (CDF) plots(a)for
historic and future summers and the correlation(b)between the different examined cases.
ACPD
8, 3405–3430, 2008Climate and emission changes over Canada
and Mexico
E. Tagaris et al.
Title Page
Abstract Introduction
Conclusions References
Tables Figures
◭ ◮
◭ ◮
Back Close
Full Screen / Esc
Printer-friendly Version
Interactive Discussion
EGU
PM2.5: historic summers
(a)
PM2.5: future_np summers – historic summers
(c)
PM2.5: future summers – historic summers
(b)
PM2.5: future summers – future_np summers
(d)
Fig. 8. (a) Three-summer-average PM2.5 concentrations in historic years. (b) Changes in
concentrations under the impact of climate change and emission controls. (c) Changes in
concentrations under the impact of climate change alone.(d)Changes in concentrations under
the impact of emission changes alone.