270 Brazilian Journal of Physics, vol. 36, no. 2A, June, 2006
Analysis of Er
3
+
Incorporation in SnO
2
by Optical Investigation
Evandro A. de Morais∗, Luis V. A. Scalvi∗, M´arcio R. Martins∗, and Sidney J. L. Ribeiro†
∗Dep. F´ısica – Faculdade de Ciˆencias – POSMAT, UNESP- Universidade Estadual Paulista, Caixa Postal 473, 17033-360 Bauru – SP, Brazil †Instituto de Qu´ımica de Araraquara – UNESP Universidade Estadual Paulista,
Caixa Postal 355, 14801-970, Araraquara - SP, Brazil
Received on 4 April, 2005
Er3+emission in the wide bandgap matrix SnO2is observed either through a direct Er ion excitation process as well as by an indirect process, through energy transfer in samples codoped with Yb3+ ions. Electron-hole generation in the tin dioxide matrix is also used to promote rare-earth ion excitation. Photoluminescence spectra as function of temperature indicate a slight decrease in the emission intensity with temperature increase, yielding low activation energy, about 3.8meV, since the emission even at room temperature is rather considerable.
Keywords: Er3+emission; SnO
2; Photoluminescence spectra
I. INTRODUCTION
In the last decade, rare-earth doped materials earn a sig-nificant position in the challenge to finding new optoelec-tronic devices that can contribute for technological innova-tion. The behavior of rare-earth atom in semiconductor ma-terials is among the most interesting combination of potential communication devices.
In its threefold oxidation state, rare-earth ions exhibit lumi-nescence due to 4f core transition, which is practically inde-pendent of host matrix [1]. In the case of Er3+for instance, these transitions yield several emission lines from visible to infrared. In particular, the transition about 1540 nm is of great interest, since it coincides with the minimum optical absorp-tion from silica based optical fibers [1].
Many efforts have been done towards the increase of emis-sion about 1540nm, such as codoping with other trivalent rare-earth ions or oxygen, and the use of wide bandgap semicon-ductors as host [2]. Electronic structure of Er3+determines
the optical properties of the resulting material. Besides the oxygen codoping favors luminescence even at room temper-ature, due to suppression of thermal quenching [2,3]. By the other hand, the use of large wide bandgap matrix also reduces thermal quenching [4], resulting in a very intense lumines-cence, as observed by Masahi et. al. [3] for TiO2. SnO2is
a wide bandgap semiconductor (3.6eV) and shows high re-flectivity in the infrared and fair transparency in the visible, above 90%[5,6]. This feature combined with low electrical resistivity, due to n-type conduction originated from oxygen vacancies and adequate doping, leads to a very attractive ma-terial for transparent electrodes, among very many other ap-plications [6,7]. Conjunction of optical properties of SnO2
and emission from Er3+ion presents a potential applicability in optoelectronics devices.
Recently, waveguide properties have been observed in SnO2:Er thin films [8]. SnO2 based nanocomposites doped
with rare-earth trivalent ions, obtained by sol-gel route have shown efficient luminescence due to energy transfer processes, such as between Eu3+ and Tb3+ [9]. Er-doped SnO2can also be used in optical amplifiers and
electrolumi-nescent devices where electron-hole energy is transferred to Er3+ion. Besides, sol-gel route has shown many advantages
in preparing erbium doped waveguides amplifiers (EDWA) [10-11].
II. EXPERIMENTAL
Colloidal suspensions have been prepared by sol-gel process. The desired amount of ErCl3.6H2O was added to an
aqueous solution of SnCl4.5H2O (0.2 mol), under magnetic
stirring, followed by addition of NH4OH until pH reaches 11.
Resulting suspension was submitted to dialysis against dis-tilled water by about 10 days in order to eliminate Cl− and
NH+4 ions. This procedure leads to an stable suspension (sol) of SnO2:Er. Yb codoping was obtained by adding SnO2:Er
powder to an aqueous solution of YbCl3.6H2O. Xerogels were
obtained by just drying the sol at room temperature and pres-sure. For photoluminescence (PL) measurements at low tem-perature, the xerogel (powder) was treated at 1000oC during 6 hours and compressed down with 5×10³kgf/cm2of load to the shape of a pellet. PL results shown in this paper have been obtained according to two distinct set-ups: for room temper-ature data, it was used a xenon lamp of 450W, a fluorimeter SPEX F212I and a germanium detector North Coast Scient. Corporation model EO-8171. For low temperature PL, it was used a Ar+laser from Spectra Physics model 2017 for sample excitation and a monochromator Jobin Yvon model T64000. Sample cooling was done in a He closed-cycle cryostat from Janis. A germanium detector from Edinburgh Instruments was used for signal measuring and recording.
III. RESULTS
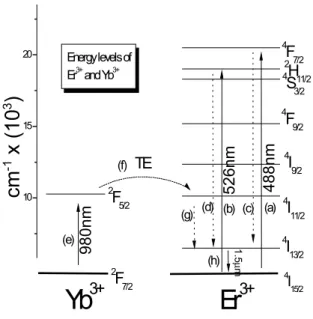
Figure 1 shows a diagram explaining the excitation mech-anism of SnO2xerogels doped with 2at% of Er and codoped
with the same amount of Yb. Direct excitation of Er+3ions can be obtained through many distinct process, for instance by direct irradiation with: (a) 488nm (4I
15/2→4F7/2)and (b)
526nm (4I
15/2→2H11/2). Non-radiative transitions may occur
between4F
7/2→4I13/2and2H11/2→4I13/2levels, which are
Evandro A. de Morais et al. 271
in Fig. 1) can be done with the Yb3+ 2F7/2→2F5/2 transi-tion (980nm), in codoped samples, since this transitransi-tion has en-ergy coincident with Er3+4I
11/2→4I15/2transition. Process
(f) shows this energy transfer from Yb3+ transition to Er3+ ion. Process (g) is the non-radiative decay4I11/2→4I13/2and
(h) is the emission which comes from4I13/2to the ground state 4I
15/2. In this work, photoluminescence spectra were obtained
under distinct excitation energies, according to some transi-tion shown in Fig. 1. Besides, generatransi-tion of electron-hole pairs from the SnO2matrix was provided with excitation with
328nm. Photoluminescence of excitation (PLE) were carried out from the ultraviolet to near infrared (300-1000 nm), with fixed emission at 1540 nm.
Figure 2 shows PL spectra for tin dioxide xerogel codoped with 2at% of Er and Yb. Three different excitation wave-lengths were used: 328nm (a), 526nm (b) and 980nm (c). In the inset, it is seen PLE with fixed emission at 1540nm.
10 15 20
(h)
(g) (d) (c)
Energy levels of
Er3+ and Yb3+
(a) (b) (f) (e) 980nm 526nm 488nm 2 F5/2 2 F7/2
Yb
3+
Er
3+
TE 1. 5 µ m 4 F7/2 2 H11/2 4 S3/2 4 F9/2 4 I9/2 4 I11/2 4 I13/2 4 I15/2
cm
-1
x
(1
0
3
)
FIG. 1: Energy levels diagram of Er3+and Yb3+.
A recent investigation of PL spectra [12] of SnO2:Er,Yb
xerogels with doping concentration of 0.1at% yield informa-tion on Er localizainforma-tion in the matrix. Two families of Er sites were found in SnO2: substitutional to Sn4+and segregated at
boundary layer. The second family is related to the solubil-ity limit of rare-earth (RE) ions in tin dioxide, which is about 0.05at%, and the doping excess become located at boundary layer as a RE2Sn2O7phase [13]. For the high doping
concen-tration (2%) of the samples reported here, it is expected very many Er complexes segregated at boundary layer. Figure 2 shows the emission efficiency of Er at room temperature, ex-cited either directly, curves (a) and (b), or by an energy trans-fer process form Yb3+to Er3+(2F
5/2+4I15/2→2F7/2+4I11/2),
curve (c). When pumping Yb3+ions with a monochromatic light of 980 nm of wavelength, Er emission is as observed in Fig. 2(c). In a previous paper [12], it was verified that codoping with Yb3+is efficient only for Er3+ions located at
400 800
0 1 2
1300 1400 1500 1600 1700 0
1 2
4 F7/2
SnO2 bandgap
4 F
9/2 2
H11/2
SnO2:Er,Yb (2%m ol)
P L E In te n s it y (a .u .)
W avelength (nm)
(c) (b) (a) P L In ten s it y ( a .u .)
W avelength (nm )
FIG. 2: Photoluminescence (PL) of SnO2:Er,Yb (2% at.) under exci-tation at: 328nm (a); 526nm (b) and 980nm (c). Inset: Photolumines-cence of excitation (PLE) for the same sample, with fixed emission at 1540nm.
grain boundary. The rare-earth ions located at Sn4+sites are
not substantially excited by this indirect procedure. The inset in Fig. 2 shows PLE for the same xerogel at room tempera-ture. It is observed a very strong absorption in the bandgap of SnO2matrix due to electron-hole generation, which in turn
promotes Er emission seen in Fig. 2(a). It is well known that emission from substitutional sites is easily observed via band-to-band excitation of SnO2 [12]. Then, the large band
ob-served by PLE is a strong indication that Er3+enters into the lattice, in substitution to Sn atoms. In the inset of Fig. 2 it is also observed intra-ff transitions from ground state 4I
15/2to
excited states 4F
7/2, 2H11/2, 4S3/2 e 4F9/2. Some of these
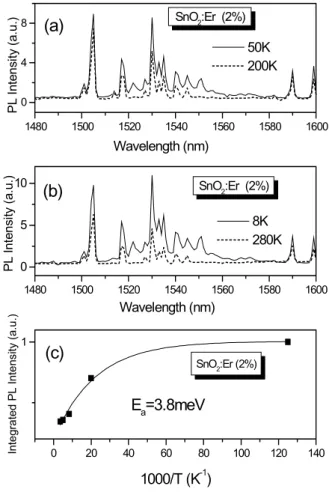
states are labeled in the inset of Fig. 2. A peak around 980 nm is also observed, which suggests absorption by Yb3+ions. Figure 3 shows temperature dependence of PL spectra in the range 8 K to 280 K for 2at% Er doped SnO2 xero-gel. Figure 3(a) shows curves measured at 50 K and 200 K and Fig. 3(b) for 8 K and 280 K. The Er3+ transition
4I
13/2 →4I15/2 around 1500nm is clearly evidenced by the
presence of several peaks. All the recorded spectra were ob-tained strictly under the same experimental conditions: slit opening in the entrance and the exit of the germanium detec-tor, Ar laser power irradiating the sample (15 mW), and ex-citation wavelength (488nm), which corresponds to transition of ground state to Er3+ 4F7/2.
lat-272 Brazilian Journal of Physics, vol. 36, no. 2A, June, 2006
tice vibration of SnO2, and then phonon assisted nonradiative
processes, which enhance light emission from Er3+core
tran-sition. It also can be noticed that details of the low temperature spectra are not observed at higher temperatures. In the mea-surement carried out at 8 K (Fig. 3(b)), it is clearly seen the presence of a peak about 1555nm, which is not observed at 280 K. This vanishing is probably related to lattice vibration. All the observed peaks are related to the transition of excited state4I13/2to the ground state4I15/2.
0 20 40 60 80 100 120 140
1
(c)
E
a=3.8meV
SnO2:Er (2%)
In
te
g
ra
te
d
P
L
In
te
n
s
ity
(a
.u
.)
1000/T (K-1)
1480 1500 1520 1540 1560 1580 1600
0 5 10
Wavelength (nm)
(a)
SnO2:Er (2%)
8K 280K
P
L
I
n
te
ns
it
y
(
a
.u
.)
Wavelength (nm)
1480 1500 1520 1540 1560 1580 1600
0 4 8
(b)
SnO2:Er (2%)
50K 200K
PL
In
te
ns
it
y
(
a
.u.
)
FIG. 3: Temperature dependence of PL for 2at% Er doped SnO2 xerogel. (a) Temperatures 50 K and 200K, (b) 8 K and 280K, (c) Integrated intensity of PL as function of reciprocal temperature.
The presence of several peaks can be attributed to the split-ting of 4I13/2and 4I15/2 levels due to the matrix crystalline
field. In Si matrix [14] the Er3+ 4I13/2 manifold has its
second and third levels located 4.2meV and 8.9 meV from the lowest lying level, respectively. Then a radiative transi-tion from the degenerate4I13/2state to the ground4I15/2state presents peaks shifted at 9 and 16 nm respectively from the lowest energy level. These upper states of the excited degen-erate4I13/2level become populated due to local laser heating
[14], as evidenced by the fact that such a line splitting does not takes place when the sample is irradiated with monochromatic light coming from a xenon lamp (Fig. 2).
Figure 3(c) shows integrated intensity of PL data for the transition4I
13/2→ 4I15/2as function of T−1. It is seen that
there is a decrease of intensity of luminescence with temper-ature increase, and a smooth thermal quenching takes place for temperatures above 50 K. The Arrhenius plot yields low activation energy, 3.8meV, compared to Er doped Si single crystal, 150meV [1]. In the latter case the intensity reaches 3 orders of magnitude higher with temperature decrease, being even eliminated at room temperature.
In the case reported in this paper, the magnitude of PL in-tensity in Er-doped SnO2 has varied only one order of
mag-nitude, which explains the low activation energy. This feature may be related to the nonradiative centers which are present at boundary layer due to excess of Er, which reduces the emis-sion efficiency, even at low temperature. It is well-known that in Si matrix, oxygen vacancies increase these nonradiative ef-fects [15]. In our samples this energy may be related to the energy needed to release the electron from the boundary layer defects (potential barrier), to become able of decaying in a ra-diative or nonrara-diative way. New measurements with other concentration of Er doping are in progress and shall help the understanding of the temperature dependent process of PL in-tensity. However it is worthy noting that even at room tem-perature there is luminescence in Er-doped SnO2, which may
become very important for new technological applications.
IV. CONCLUSION
Photoluminescence properties of Er-doped tin dioxide in the form of xerogels have been investigated.
Temperature dependent excitation of 2at%Er in SnO2with
488nm promoted the excitation of ions Er3+to its4F7/2level and the probable decay to nonradiative level4I
13/2, with
sub-sequent emission to the ground state 4I
15/2, which means
emission about de 1540nm. Slight increase with temperature is observed in the luminescence intensity, yielding low activa-tion energy, 3.8meV, which may be related to the Er excess at boundary layer.
In samples codoped with ytterbium, energy transfer process from Yb3+ to Er3+ has shown effective for Er3+ ions ad-sorbed at boundary layer. It has been observed emission about 1540nm either for samples excited indirectly, through pump-ing of Yb3+ions and by excitation band-to band of SnO2
ma-trix as well as direct excitation of Er+3. These results are in good agreement with previous data reported for 0.1at% Er SnO2 samples, where the rare-earth dopant enters
substitu-tional to Sn4+or remains segregated at particles surface.
Acknowledgement
Evandro A. de Morais et al. 273
[1] S. Coffa, G. Franzo, F. Priolo, A. Polman, and R. Serna, Phys. Rev. B 49, 16313 (1994).
[2] S. Komuro, T. Katsumata, T. Morikawa, X. Zhao, H. Isshiki, and Y. Aoyagi, J. Appl. Phys. 88, 7129 (2000).
[3] M. Ishii, S. Komuro, and T. Morikawa, J. Appl. Phys. 94, 3823 (2003).
[4] C. Li, K. Kondo, T. Makimura, and K. Murakami, Appl. Surf. Sci. 197-198, 607 (2002).
[5] E. Dien, J. M. Laurent, and A. Smith, J. of the European Cer. Soc. 19, 787 (1999).
[6] A. C. Yanes, J. Del Castillo, M. Torres, J. Peraza, V. D. Ro-driguez, and J. Mendes-Ramos, Appl. Phys. Lett. 85, 2343 (2004).
[7] J. Rockenbecher, U. zum Felde, M. Tischer, L. Troger, M. Haase, and H. Weller J. Chem. Phys. 112, 4296 (2000). [8] R. R. Goncalves, M. Ferrari, A. Chiasera, M. Montagna, E. A.
Morais, L. V. A. Scalvi, C. V. Santilli, Y. Messaddeq, and S. J. L. Ribeiro, J. Metastable Nanocryst. Mater. 14, 107 (2002). .
[9] H. Elhouichet, L. Othman, A. Moadhen, M. Oueslati, and J. A. Roger, Mater. Sci. Eng. B 105, 8 (2003).
[10] R. R. Gonc¸alves, G. Carturan, M. Montagna, M. Ferrari, L. Zampedri, S. Pelli, G. C. Righini, S. J. L. Ribeiro, and Y. Mes-saddeq, Opt. Mater. 25, 131 (2004).
[11] L. H. Slooff,M. J. A. De Dood, A. Van Blaaderen, and A. Pol-man, J. Non-Cryst. Solids 296, 158 (2001).
[12] E. A. Morais, S. J. L. Ribeiro, L. V. A. Scalvi, C. V. Santilli, L. O. Ruggiero, S. H. Pulcinelli, and Y. Messaddeq, J. Alloys Compd. 344, 217 (2002).
[13] T. Matsuoka, Y. Kasahara, M. Tsuchiya, T. Nitta, and S. Ha-gakawa J. Eletrochem. Soc. 125, 102 (1978).
[14] T.D. Culp, J. G. Cederberg, B. Bieg, T.F. Kuech, K.L. Bray, D. Pfeiffer, and H.C. Winter, J. Appl. Phys. 83, 4918 (1998). [15] W. X. Ni, K. B. Joelsson, C. X. Du, G. Pozina, L. A. Buyanova,