INTRODUCTION
Rare-earth (RE) doped semiconductors ilms have growing technological interest due to application in optoelectronic devices, for instance as electroluminescent thin ilms [1]. The production of integrated optical devices requires thin ilm preparation with low optical loss and doped with optically active elements. At this point the rare-earth doping earns importance due to radiative transitions in a wide wavelength range [2]. In its threefold oxidation state, rare-earth ions (RE3+) exhibit luminescence due to 4f core transition, which is practically independent of host matrix [3]. In the case of Er3+ for instance, these transitions yield several emission lines from visible to infrared. In particular, the transition about 1540 nm is of great interest, since it coincides with the minimum optical absorption
Visible emission from Er-doped SnO
2thin ilms deposited by sol-gel
(Emissão no visível de ilmes inos, depositados
via sol-gel, de SnO
2dopados com Er)
L. P. Ravaro1,2, E. A. Morais1, L. V. A. Scalvi1, M. Siu Li3
1Departamento de Física, Faculdade de Ciências, POSMAT, Universidade Estadual Paulista - UNESP, C.P. 473,
Bauru, SP, Brazil 17033-360
2Departamento de Química, Faculdade de Ciências, Universidade Estadual Paulista - UNESP, C.P. 473, Bauru,
SP, Brazil 17033-360
3Instituto de Física de S. Carlos, Universidade de S. Paulo, C.P. 369, S. Carlos, SP, Brazil 13560-970
Abstract
Emission from Er-doped SnO2 thin ilm deposited via sol-gel by the dip coating technique is obtained in the range 500-700 nm with peak at 530 nm (green). Electron-hole generation in the tin dioxide matrix is used to promote the rare-earth ion excitation. Evaluation of crystallite dimensions through X-ray diffraction results leads to nanoscopic size, what could play a relevant role in the emission spectra. The electron-hole mechanism is also responsible for the excitation of the transition in the 1540 nm range in powders
obtained from the same precursor solution of ilms. The thin ilm matrix presents a very useful shape for technological application, since it allows integration in optical devices and the application of electric ields to operate electroluminescent devices.
Keywords: tin dioxide, thin ilms, sol-gel, erbium.
Resumo
Foi obtida emissão de ilmes inos de SnO2 dopados com Er no intervalo 500-700 nm, com pico em 530 nm (verde). Esses ilmesEsses ilmes foram depositados pela técnica de molhamento via sol-gel. A geração de pares elétron-buraco na matriz de SnOA geração de pares elétron-buraco na matriz de SnO2 é usada para promover a excitação do íon terra-rara. A avaliação do tamanho dos cristalitos por meio de resultados de difração de raios X indica dimensões nanoscópicas, o que pode ser relevante para a interpretação do espectro de emissão. O mecanismo de excitação elétron-buraco é também responsável pela excitação da transição no intervalo que inclui 1540 nm em pós obtidos da mesma solução precursora dos ilmes. Filmes inos constituem um formato muito útil para aplicações tecnológicas, desde que permite integraçãoFilmes inos constituem um formato muito útil para aplicações tecnológicas, desde que permite integração em dispositivos ópticos e a aplicação de campos elétricos para operar dispositivos eletroluminescentes.
Palavras-chave: dióxido de estanho, ilmes inos, sol-gel, érbio.
from silica based optical ibers [3]. Many efforts have been done towards the increase of emission intensity, such as codoping with other trivalent rare-earth ions or oxygen, and the use of wide bandgap semiconductors as host [4], which reduces thermal quenching [5], resulting in a very intense luminescence, as observed by Ishii et. al [6] for TiO2. Green light emission from Er3+ has been observed previously in other matrix, for instance in SiN thin ilms [7]. On the other hand, tin dioxide (SnO2) is a wide bandgap semiconductor with increasing use as a matrix in phosphorescent materials [8, 9]. However, the difference between ionic radii of RE3+ and Sn4+ becomes an obstacle to incorporation of RE in the SnO2 matrix, which yields a low quantum eficiency in the luminescence process [1]. To avoid this problem the matrix has been used in the shape of nanoparticles, produced by the sol-gel method. SnO2 thin ilms, presenting high infrared relectivity and fair transparency in the visible range [10, 11]. It has been observed that RE ions present solubility limit about 0.05at%, and the excess gets segregated at grain
*Apresentado no V Encontro da Sociedade Brasileira de Pesquisa em
boundary, forming a new phase RE2Sn2O7 [12]. Electrical conductivity of SnO2 may become quite low due to the presence of a very large amount of nanoscopic grains (3 to 10 nm). Besides the introduction of the dopant inhibits the grain growth [12], decreasing the electronic mobility.
Recently, waveguide properties have been observed in SnO2:Er thin ilms [13]. Er-doped SnO2 can also be used in optical ampliiers and electroluminescent devices where electron-hole energy is transferred to Er3+ ion. Besides, sol-gel route has shown many advantages in preparing erbium doped waveguides ampliiers (EDWA) [14, 15].
Although we have obtained emission from Er-doped SnO2 samples previously, this phenomenon was related to the efforts towards concentration of the number of Er3+ in the excitation path, which was obtained by samples in the form of xerogels (powder) and pellets (pressed powder). In this paper we show for the irst time a green emission from an Er-doped SnO2 thin ilm, which is a great motivation in the way to get luminescent devices on a technological convenient shape, which allow the application of electric ields and the integration in optical systems, differently from powders or pellets, where the exploration of electric properties is rather dificult.
EXPERIMENTAL
Colloidal suspensions have been prepared by sol-gel process. The desired amount of ErCl3.6H2O was added to an
aqueous solution of SnCl4.5H2O (0.2 mol), under magnetic
stirring, followed by addition of NH4OH until pH reaches 11.
The resulting suspension was submitted to dialysis against distilled water by about 10 days in order to eliminate Cl- and
NH4+ ions. This procedure leads to a stable suspension (sol)
of SnO2:Er. Yb codoping was obtained by adding SnO2:Er
powder to an aqueous solution of YbCl3.6H2O. Thin ilms have
been deposited by dip coating technique on borosilicate glass substrates with dipping rate of 10 cm/min. Each deposited layer is dried in air by 20 min and then treated at 400 oC
for 10 min. After 10 deposited layers, ilms are submitted to annealing at 550 oC by 1 h. This is the highest number of
layers in order to keep the ilms homogenous and with good optical quality. As the number of layers is increased over 10, samples start becoming whitish and opaque.
Xerogels were obtained by just drying the sol at 100 oC
at room pressure until a white powder is formed. For molding the sample in the shape of rectangular pellets for photoluminescence (PL) measurements, the xerogel (powder) was treated at 1000 oC during 6 h and pressed
with 5x10³ kgf/cm2 load. PL results shown in this paper
have been obtained according to three distinct set-ups: 1) excitation with a xenon lamp of 450 W, a luorimeter SPEX F212I and a germanium detector North Coast Scient. Corp. model EO-8171, 2) excitation with a Kr+ laser, tuned on
an ultraviolet multi-line mode (337.5 nm, 350.7 nm and 356.4 nm), 3) excitation with a Kr+ laser, tuned on 482 nm.
A Hamamatsu photomultiplier tube R446 was used for signal measuring and recording in the methods 2 and 3.
For X-ray diffraction measurements a Rigaku diffractometer coupled with a Cu source of 40 kV and 20 mA was used. Detector rate is 0.5 degree/min with a 0.02-degree step. Optical absorption measurements have been done with a Cary 300 spectrophotometer in the range 200-900 nm.
RESULTS AND DISCUSSION
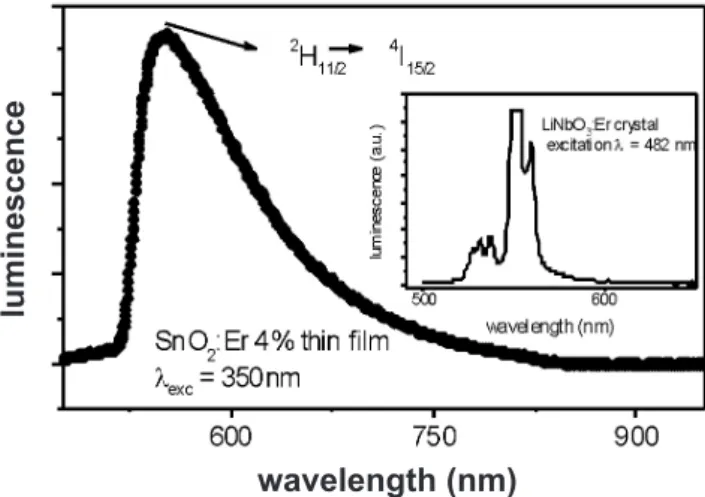
Fig. 1 shows the green emission from an Er doped (4%) SnO2 thin ilm. The inset in Fig. 1 shows the emission from an Er-doped LiNbO3 single crystal. The energy range in both curves of that Fig. are in good agreement and assures that the observed wide emission, with a peak about 530 nm, includes the 2H
11/2→ 4I
15/2 radiative transition of Er
3+ ion. Besides, the emission proile of luminescence in the crystal assures that the broad band observed for the SnO2: 4%Er ilms comes indeed from the Er transition in the ilm and the broad shape does not come from monochromator precision, since a multi-peak proile is observed in the LiNbO3 crystal luminescence curve. This broad shape is related to random neighborhood of Er3+ at the SnO
2 lattice, which could be surrounded by varying number of oxygen vacancy, interstitial tin atom and grain boundary, since we are dealing with nanoscopic grains, in the range 3 to 6 nm. Besides, the excess of Er is located at grain boundary, as we have conclude previously [16], which are low symmetry sites and could contribute to the broad band. Luminescence from the matrix SnO2 has been recently reported [17]. Although the band reported by Wang et al. [17] has very similar shape to the curve of Fig. 1, it is shifted to UV, presenting a peak at about 400 nm, which was attributed to oxygen vacancies.
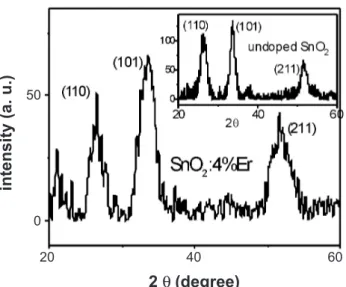
The X-ray diffraction data of this ilm can be seen in Fig. 2, where a typical result for undoped ilm is shown in
Figure 1: Photoluminescence (PL) spectra of SnO2:4% thin ilm, excited with the multi-lines ultraviolet of a Kr+ laser. Inset – PL
spectra of Er-doped LiNbO3 single crystal excited with 482 nm from an Ar+ laser.
[Figura 1: Espectros fotoluminescentes (FL) de ilme ino de
SnO2:4%, excitado com multi-linhas ultavioleta de um laser Kr+.
Inserção: Espectros FL de monocristais de LiNbO3 dopado com Er
excitado com 482 nm de um laser Ar+.]
wavelength (nm)
lu
m
in
e
s
c
e
n
c
the inset. The grain size evaluated from these data, based on Scherrer equation [18] is 3.5 nm for the doped ilm and 6.0 nm for the undoped ilm, showing that the doping procedure also inhibits the grain growth [19]. At this point it must be mentioned that the crystallite size in the Er-doped SnO2 thin ilm may play a very important role concerning the quantum coninement effects by nanocrystals. Yu et al. [20] have observed that coated nanoparticles present their emission shifted to larger wavelengths as the particle size decreases from 15 nm to 7 nm. In this case, the shape of the emission spectra is quite similar to the reported by Wang et al. [17], but shifted to longer wavelengths, with a peak about 530 nm. The emission reported by them and the one shown in Fig. 1 look very much alike, including the broad proile, which extends the emission spectra to about 750 nm. On the other hand, when nanoparticles were uncoated, they observed a shift to higher energy (lower wavelength) when the particle size decreased. The quantum coninement could also be present in our ilm, because the Er3+ solubility has been widely overcome and the excess of Er3+ doping gets adsorbed at grain boundary, forming a boundary layer, which may act as a coat. Then, the excess of Er3+, located at grain boundary, inhibits the grain growth and could allow the quantum coninement, which contributes to the broad spectra seen in Fig. 1. In order to conirm the nanometric dimensions of crystallites we have done atomic force microscopy (AFM) measurements. The results point to a very irregular surface, but unfortunately are not conclusive concerning the crystallite dimensions, since only the undoped ilm presents a periodic shape surface, of “rice grain”-like arrangement, with rather larger dimensions (about 30 nm). However the data failed to reproduce this shape for Er-doped samples and are not conclusive concerning the grains dimensions, for it could be only the surface layout. Therefore, even though the quantum coninement seems as a very fair mechanism due to nanoscopic dimensions evaluated from X-ray data, it needs
further conirmation.
Direct excitation of Er3+ ions can be obtained through many distinct process, for instance by direct irradiation with: 482 nm (4I
15/2→ 4F
7/2) and 526 nm ( 4I
15/2→ 2H
11/2). Generation of electron-hole pairs from the SnO2 matrix can be provided with excitation below 350 nm, which is about the wavelength of band gap energy (3.5 eV) of SnO2. Non-radiative transitions may occur between 4F
7/2→ 4I
13/2 and 2H
11/2→ 4I
13/2 levels [21]. Indirect excitation can be obtained with the Yb3+ 2F
7/2→ 2F
5/2 transition (980nm), in codoped samples, since this transition has energy coincident with Er3+ 4I
11/2→ 4I
15/2 transition. 4I
11/2→ 4I
13/2 is a non-radiative decay and the emission which comes from 4I
13/2 to the ground state 4I
15/2. The observed broad band green emission centered about 530 nm is the transition from the excited state 2H
11/2 to the 4I
15/2 ground state. In the spectrum of Fig. 1, ilms are excited with the multiline UV from a Kr+ laser (most intense line at 350 nm). Excitation with 482 nm (also from the Kr+ laser), which is coincident with 4I
15/2→ 4F
7/2 transition does nor lead to any band and in the photoluminescence spectrum.
Fig. 3 shows photoluminescence spectra for SnO2 xerogels doped with several Er compositions excited at 328 nm (above the bandgap transition) with a Xenon lamp plus a monochromator (method 1), in the range 1300-1700 nm. The inset in Fig. 3 shows photoluminescence emission from a pellet (pressed powder) of SnO2:2%Er, with excitation with 482 nm. Some of the samples of Fig. 3 are codoped with Yb in order to analyze the energy transfer process between Yb3+ and Er3+. That is not shown in the Fig. because was the scope
Figure 2: X-ray diffraction data of SnO2:4%Er thin ilm. Inset - X-ray diffraction data of undoped SnO2.
[Figura 2: Difratogramas de raios X de ilme ino de SnO2:4%Er. Inserção: difratograma de SnO2.]
Figure 3: Photoluminescence (PL) spectra of SnO2 xerogels excited with a xenon lamp plus a monochromator (328 nm), with varying concentration of Er and codoped with Yb. Inset - PL spectrum of SnO2:2%Er pellet, excited with 482 nm from a Kr+ laser.
[Figura 3: Espectros fotoluminescentes (FL) de xerogéis de SnO2 excitados com lâmpada de xenônio e um monocromador (382 nm), com diferentes concentrações de Er e co-dopado com Yb. Inserção:
Espectro PL de pastilha de SnO2:2%Er, excitada com 482 nm de
um laser Kr+.]
2 q(degree)
in
te
n
s
ity
(a
.
u
.)
20 40 60
0 50
in
te
n
s
ity
(a
.
u
.)
of another paper [16]. However, as it was concluded there, this energy transfer is only effective for ions located at the grain boundary layer. The excitation with 328 nm, used to obtain the spectra of Fig. 3, allows only the excitation of Er3+ ions located at SnO2 matrix sites and then, the result shown in that Fig. is related only with Er3+ doping and is not affected by the Yb codoping. As it can be seen, independent on Er concentration, the PL pattern in this range is quite similar. Considering that the solubility limit has been overcome, the Er3+ concentration at lattice sites remains unchanged, which endorses the result presented in Fig. 3. Moreover, it means that to obtain the technologically interesting transition at 1540nm it is very relevant the number of exciting centers in the beam light path, which is rather long for the pellets but not for the ilm. However our result in the visible range (Fig. 1) makes sure that luminescence is possible also for the ilm, which justiies investigation of ilm emission in the infrared. The result in the inset of Fig. 3 assures that although the laser line at 482nm is not enough to excite the green transition in the SnO2:4at%Er ilm, it is accountable for the excitation of observed transition in SnO2:2%Er pellet.
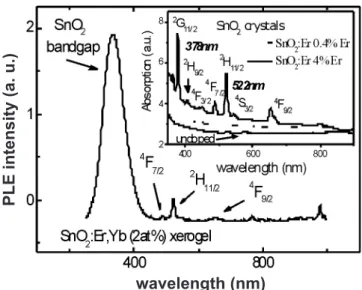
Fig. 4 shows photoluminescence of excitation (PLE) were the sample is excited with varying wavelength, from the ultraviolet to near infrared (300-1000 nm), and the emission is kept ixed at 1540 nm. It is observed a very strong absorption in the band gap of SnO2 lattice due to electron-hole generation, which in turn promotes Er emission from substitutional sites. Band-to-band excitation of SnO2 easily leads to emission from Er3+ located at lattice sites, as observed in Figs. 1 (visible range) and 3 (infrared range). The inset in Fig. 4 shows optical absorption spectra in the ultraviolet-visible range for crystals obtained from natural drying of the sol-gel solution. Unlike the xerogels they are
not dried in an oven, but left still by one to two weeks until the solvent evaporates, leaving a crystallized residue at the bottom of the beaker. As the Er3+ composition increases, the absorption curve shows clearly several transitions of Er3+ from the ground state 4I
15/2 to excited states, such as 4G
11/2, 4F
7/2, 2H
11/2, 4S
3/2 and 4F
9/2(inset of Fig. 4).
Fig. 5 shows optical absorption of ErCl3 solution at several concentrations (0.1, 0.01 and 0.001 mol). Very many transitions from Er3+ ground state, 4I
15/2, to excited states become easily identiied, such as to 2G
7/2, 2G
9/2, 4G
11/2, 2H
9/2, 4F
3/2, 4F
5/2, 4F
7/2, 2H
11/2, 4S
3/2 and 4F
9/2. As the dilution increases the absorption peaks become less deined and less intense. Comparing Fig. 5 with the inset of Fig. 4, it is clearly observed that as the Er3+ doping in SnO
2 crystals increases, the optical absorption spectra becomes very similar to the spectra observed from the precursor reagent ErCl3. These data also reinforces the interpretation that all the transitions become possible when the number of luminescent centers in the path of the excitation source is high enough. We expect that electric ield excitation, as necessary in electroluminescent devices, leads to emission independent of ilm thickness.
CONCLUSION
Emission from Er-doped thin ilm has been observed in the range 500-700nm with peak about 530 nm (green). It corresponds to 2H
11/2 → 4I
15/2 radiative transition of Er 3+ ion. The broad band proile may be related to the random distribution of oxygen vacancy and interstitial tin atoms in the neighborhood of the Er3+ lattice sites, subtitutional to Sn4+. Besides, the large excess of Er3+ gets segregated at grain boundary, which constitutes low symmetry sites and may contribute to the broad band proile. Moreover the
Figure 4: Photoluminescence of excitation with the monochromator
exit slit ixed at 1540 nm. Inset - Optical absorption data for
undoped SnO2, SnO2:0.4%Er and SnO2:4%Er crystals.
[Figura 4: Fotoluminescência e excitação com a fenda de saída do monocromador ixada em 1540 nm. Inserção:Absorção óptica de
cristais de SnO2, SnO2:0,4%Er SnO2:4%Er.] wavelength (nm)
PL
E
in
te
n
s
ity
(a
.
u
.)
Figure 5: Optical absorption spectra of ErCl3 solution at several
concentrations (0.1, 0.01 and 0.001 mol). Inset -magniication of
data for solutions 0.01 and 0.001 mol, for better visualization. [Figura 5: Espectros de absorção óptica de solução de ErCl3 em várias concentrações (0,1, 0,01 e 0,001 mol). Inserção: visão ampliada para as soluções 0,01 e 0,001.]
wavelength (nm)
a
b
s
o
rp
ti
o
n
(a
.
u
Er3+ ion located at grain boundary acts as a coat, inhibiting the grain growth and may allow the quantum coninement, which deserves further investigation. .
Radiative transition 4I 13/2→
4I
15/2 in xerogels, excited with SnO2 bandgap energy, has practically the same intensity and shape in the infrared range, independent of Er doping concentration, which means that it comes from excitation of Er3+located at lattice sites, which has low saturation limit.
The results shown in this paper are very promising under a technological point-of-view, since it reveals the possibility of emission from Er-doped SnO2thin ilms, which are very useful format for this material. It allows the integration in optical systems and makes the electroluminescence phenomena in this material a reality in a very short time.
ACKNOWLEDgEMENTS
The authors wish to thank prof. Sidney J. L. Ribeiro and Dr. Viviany Geraldo for all the help with technical set-up and very fruitful discussions. They also acknowledge CAPES, CNPq and FAPESP for inancial support.
REFERENCES
[1] H. Zhang, X. Fu, S. Niu, G. Sun, Q. Xin, J. Lumin. 115 (2005) 7.
[2] F. Gu, S. F. Wang, M. K. Lu, Y. X. Qi, G. J. Zhou, J. Crystal Growth 255 (2003) 357.
[3] S. Coffa, G. Franzo, F. Priolo, A. Polman, R. Serna, Phys. Rev. B 49 (1994) 16313.
[4] S. Komuro, T. Katsumata, T. Morikawa, X. Zhao, H. Isshiki, Y. Aoyagi, J. Appl. Phys. 88 (2000) 7129.
[5] C. Li, K. Kondo, T. Makimura, K. Murakami, Appl. Surf. Sci. 197-198 (2002) 607.
[6] M. Ishii, S. Komuro, T. Morikawa, J. Appl. Phys. 94
(2003) 3823.
[7] A. R. Zanata, L. A. O. Nunes, Appl. Phys. Lett. 72 (1998) 3127.
[8] M. Nogami, T. Enomoto, T. Hayakawa, J. Lumin. 97 (2002) 147.
[9] F. Gu, S. F. Wang, M. K. Lu, Y. X. Qi, Opt. Mater. 25 (2004) 59.
[10] E. Dien, J. M. Laurent, A. Smith, J. Eur. Ceram. Soc. 19 (1999) 787.
[11] A. C. Yanes, J. Del Castillo, M. Torres, J. Peraza, V. D. Rodriguez, J. Mendes-Ramos, Appl. Phys. Lett. 85 (2004) 2343.
[12] E. A. Morais, L. V. A. Scalvi, S. J. L. Ribeiro, V. Geraldo, Phys. Stat. Solidi (a) 202 (2005) 301.
[13] R. R. Goncalves, M. Ferrari, A. Chiasera, M. Montagna, E. A. Morais, L. V. A. Scalvi, C. V. Santilli, Y. Messaddeq, S. J. L. Ribeiro, J. Metastable Nanocryst. Mater. 14 (2002) 107.
[14] R. R. Goncalves, G. Carturan, M. Montagna, M. Ferrari, L. Zampedri, S. Pelli, G. C. Righini, S. J. L. Ribeiro, Y. Messaddeq, Opt. Mater. 25 (2004) 131.
[15] L. H. Slooff, M. J. A. De Dood, A. Van Blaaderen, A. Polman, J. Non-Cryst. Solids 296 (2001) 158.
[16] E. A. Morais, S. J. L. Ribeiro, L. V. A. Scalvi, C. V. Santilli, L. O. Ruggiero, S. H. Pulcinelli, Y. Messaddeq, J. Alloys and Comp. 344 (2002) 217.
[17] Y. Wang, J. Ma, F. Ji, X. Yu, H. Ma, J. Lumin. 114 (2005) 71.
[18] B. D Cullity, Elements of X-ray Diffraction, Addison Wesley Publ. Co., Reading. Mass., USA (1978).
[19] E. A. Morais, L. V. A. Scalvi, V. Geraldo, S. J. L. Ribeiro, C. V. Santilli, Mater. Res. 6 (2003) 445.
[20] B. Yu, C Zhu, F. Gan, Opt. Mater. 7 (1997) 15.
[21] E. A. Morais, L. V. A. Scalvi, M. R. Martins, S. J. L. Ribeiro, Braz. J. Phys. 36 (2006) 270.