HESSD
10, 2183–2214, 2013Climate change effect on entering runoffto Urmia Lake
Iran
P. Razmara et al.
Title Page
Abstract Introduction
Conclusions References
Tables Figures
◭ ◮
◭ ◮
Back Close
Full Screen / Esc
Printer-friendly Version
Interactive Discussion
Discussion
P
a
per
|
Dis
cussion
P
a
per
|
Discussion
P
a
per
|
Discussio
n
P
a
per
|
Hydrol. Earth Syst. Sci. Discuss., 10, 2183–2214, 2013 www.hydrol-earth-syst-sci-discuss.net/10/2183/2013/ doi:10.5194/hessd-10-2183-2013
© Author(s) 2013. CC Attribution 3.0 License.
Geoscientiic Geoscientiic
Geoscientiic Geoscientiic
Hydrology and Earth System
Sciences
Open Access
Discussions
This discussion paper is/has been under review for the journal Hydrology and Earth System Sciences (HESS). Please refer to the corresponding final paper in HESS if available.
Investigating uncertainty of climate
change e
ff
ect on entering runo
ff
to Urmia
Lake Iran
P. Razmara1, A. R. Massah Bavani2, H. Motiee3, S. Torabi4, and S. Lotfi5 1
Department of Civil Engineering, Science and Research Branch, Islamic Azad University, Tehran, Iran
2
Department of water and agriculture, Tehran University, Tehran, Iran
3
Water Engineering Faculty, Power and Water University of Technology (PWUT), Tehran, Iran
4
Ministry of Energy (MOE) and Visiting Prof. Univ. of Tehran, Tehran, Iran
5
Ministry of Energy (MOE), Tehran, Iran
Received: 25 November 2012 – Accepted: 9 February 2013 – Published: 20 February 2013
Correspondence to: P. Razmara (parisa.razm@gmail.com)
HESSD
10, 2183–2214, 2013Climate change effect on entering runoffto Urmia Lake
Iran
P. Razmara et al.
Title Page
Abstract Introduction
Conclusions References
Tables Figures
◭ ◮
◭ ◮
Back Close
Full Screen / Esc
Printer-friendly Version
Interactive Discussion
Discussion
P
a
per
|
Dis
cussion
P
a
per
|
Discussion
P
a
per
|
Discussio
n
P
a
per
|
Abstract
The largest lake in Iran, Urmia Lake, has been faced with a sharp decline in water surface in recent years. This decline is putting the survival of Urmia Lake at risk. Due to the fact that the water surface of lakes is affected directly by the entering runoff, herein we study the effect of climate change on the runoff entering Urmia Lake. Ten 5
climate models among AOGCM-AR4 models in the future time period 2013–2040 will be used, under the emission scenarios A2 and B1. The downscaling method used in this research is the change factor-LARS method, while for simulating the runoff, the artificial neural network was applied. First, both the 30-yr and monthly scenarios of climate change, temperature, and precipitation of the region were generated and 10
weighted by the Beta function (β). Then, the cumulative density function (cdf) for each month was computed. Calculating the scenarios of climate change and precipitation at levels of 25, 50, and 75 % of cdf functions, and introducing them into LARS-wg model, the time series of temperature and precipitation in the region in the future time period were computed considering the uncertainty of climate variability. Then, introducing the 15
time series of temperature and precipitation at different risk levels into the artificial neural network, the future runoffwas generated. The findings illustrate a decrease of streamflow into Urmia Lake in scenario A2 at the three risk levels 25, 50, and 75 % by, respectively,−21, −13, and −0.3 %, and an increase by, respectively, 4.7, 13.8, and 18.9 % in scenario B1. Also, scenario A2 with its prediction of a warm and dry climate 20
suggests more critical conditions for the future compared to scenario B1 and its cool, humid climate.
1 Introduction
Technology has progressed since the beginning of the Industrial Revolution, followed by the incremental fossil fuel exploitation, forest devastation, and the change of utilization 25
HESSD
10, 2183–2214, 2013Climate change effect on entering runoffto Urmia Lake
Iran
P. Razmara et al.
Title Page
Abstract Introduction
Conclusions References
Tables Figures
◭ ◮
◭ ◮
Back Close
Full Screen / Esc
Printer-friendly Version
Interactive Discussion
Discussion
P
a
per
|
Dis
cussion
P
a
per
|
Discussion
P
a
per
|
Discussio
n
P
a
per
|
years, particularly CO2. Significant temperature alterations across the globe have been the most considerable indication of climate change in the present century. According to AR4 report of the IPCC, the average increase of the earth’s temperature up to the end of the 21st century would be 1.8–4◦C, while in the last century the increase was 0.76◦C. The world climate alteration would yield changes in temperature, precipitation, 5
wind velocity, solar radiation energy, water surface of the oceans, snow coverage, an increase in floods, and might be capable of affecting water resources (IPCC, 2007).
Due to climate change and global warming, the earth’s hydrological cycle system has been affected by certain alterations, of which lakes are not excluded. Comprising less than 1 % of the area of the earth, lakes are highly influential in the hydrology of 10
their regions. Investigations of the lakes of the world at the end of the 20th century as well in the first decade of the 21st century show that the surface and the volume of lake waters are subject to decline, and some have even receded to absolute dryness (Downing et al., 2006).
Low levels of precipitation may be the principal reason for the lowering of water levels 15
in lakes. A lack of rain and snow may also be responsible for global warming (Mcbean et al., 2008). Lakes Superior, Michigan, and Huron on the US/Canadian border; Tuz in Turkey; Poyong in China; Las Canoas in Nicaragua and Mead at the Hoover dam in the US are all examples to be noted in this regard. Obviously, along with the increase of temperature as well as the decrease in water resources in the future, the water level 20
decline would continue up to the point of the complete loss of the lakes.
Due to the importance of the issue, various studies have been carried out in re-cent years about the effect of climate change on water level changes, for example the researches by Motiee and Mcbean (2009) in which the effect of climate change in Su-perior Lake is studied on the basis of the historical data trend and by using AOGCM 25
HESSD
10, 2183–2214, 2013Climate change effect on entering runoffto Urmia Lake
Iran
P. Razmara et al.
Title Page
Abstract Introduction
Conclusions References
Tables Figures
◭ ◮
◭ ◮
Back Close
Full Screen / Esc
Printer-friendly Version
Interactive Discussion
Discussion
P
a
per
|
Dis
cussion
P
a
per
|
Discussion
P
a
per
|
Discussio
n
P
a
per
|
Lijalem Zeray et al. (2007) worked on the climate change effect upon Ziway Lake, Ethiopia, using HADCM3, two scenarios A2 and B2 and statistical downscaling SDSM in the period 2001 to 2099. They inferred finally that the temperature and precipitation in the future period would increase relative to the period 1981–2000. Hence, contrary to the increase of temperature and precipitation – the increase of temperature was more 5
perceptible than that of the latter – the volume of annual entering runoffdecreased, and both the scenarios showed conspicuous decline in water level of the lake. On average, the water level has lowered more than 0.7 m, almost 6 % of the surface area of the lake (25 km2), relative to the base period.
Somura et al. (2009) studied the effect of climate change on Hii River as well as on 10
the salinity of Shinji Lake, Japan, the third greatest saline lake in the world applying the SWAT model and the regression curve. The research was done by combining 18 different synthetic scenarios. The future temperature changes were assumed in the form T+1, T+2, T+3, and six different combinations of precipitation changes in the form P−20 %, P−10 %, P, P+10 %, P+20 %, and P+30 %. The results show that the changes 15
in river discharge depend directly on the precipitation changes. The runoffincreases with an increment of precipitation, and decreases with its decrease. The maximum reduction of discharge at 44 % in May corresponded to the synthetic scenario T+3 with P−20 %.
Yao et al. (2009) investigated the effect of climate change on Harp Lake and its 20
catchment, north of Ontario, Canada by use of two different methods: determining the long-term trend of monthly changes of precipitation and temperature and climate pre-diction model CGCM2. they studied hydrological effects of climate change in time pe-riod 2050–2060 on the lake using the water equilibrium equation. The first scenario with prediction of a warmer and more humid climate resulted in less changes com-25
HESSD
10, 2183–2214, 2013Climate change effect on entering runoffto Urmia Lake
Iran
P. Razmara et al.
Title Page
Abstract Introduction
Conclusions References
Tables Figures
◭ ◮
◭ ◮
Back Close
Full Screen / Esc
Printer-friendly Version
Interactive Discussion
Discussion
P
a
per
|
Dis
cussion
P
a
per
|
Discussion
P
a
per
|
Discussio
n
P
a
per
|
winter grows, and runoffof summer decreases causing turning down of water levels by 0.02 m.
Among other things, one topic considered by many researchers in recent years was the uncertainty of the phenomena and the models governing them. Because of factors such as insufficient data, errors in modeling, and random nature of the phenomena, 5
the variables correlated with the nature and the results of the models applied in the simulation are of uncertain and indecisive characters. In most studies, the only effect of climate change is investigated using one or two AOGCM models with one scenario, and uncertainty of the models, uncertainty of emission of greenhouse gases, and un-certainty of the methods for downscaling are not taken into account.
10
So, to manage uncertainty, Yu et al. (2010) studied the effect of climate change on water levels of 4 lakes in north of China at arid and semi-arid regions considering the uncertainty of AOGCM models by applying Monte Carlo method. Their work was carried out with 5 AOGCM models under two scenarios A2 and B2 with the conclusion that in the 50 yr to come the water level of the lakes would, by a 95 % probability, rise 15
along with increase of precipitation. A decline of more than 40 % in annual precipitation of the catchment leads to turning down of water levels as well as strict droughts in the lakes in year 2050.
Deg-Hyo et al. (2011) studied the uncertainty of climate change with reference to the Chungju dam basin, Korea, with 13 AOGCM models and 3 scenarios of greenhouse 20
gases and 3 hydrological models using downscaling of stochastic weather generator WXGEN. The research shows that the observing runoff has high uncertainty in arid seasons.
It is noteworthy that another uncertainty factor in climate change investigations af-fecting the ultimate results and not considered so far is the uncertainty concerning 25
climate variability. In the present research we regard this source of uncertainty with generating several time series of temperature and precipitation for 28 yr to come.
HESSD
10, 2183–2214, 2013Climate change effect on entering runoffto Urmia Lake
Iran
P. Razmara et al.
Title Page
Abstract Introduction
Conclusions References
Tables Figures
◭ ◮
◭ ◮
Back Close
Full Screen / Esc
Printer-friendly Version
Interactive Discussion
Discussion
P
a
per
|
Dis
cussion
P
a
per
|
Discussion
P
a
per
|
Discussio
n
P
a
per
|
Recently, the water level has lowered more than 5 m. This decline was partly due to changes in climate or hydrological features, and partly because of impolitic exploita-tions of the runofffrom entering rivers. In particular, after drying of the lake the remain-ing salt would disperse around the lands causremain-ing damage to the region’s ecosystem. Here, an attempt was made to study the effect of the climate change phenomenon on 5
the entering runoffto Urmia Lake in the period 2013–2040 under scenarios A2 and B1 using 10 AOGCM models and applying downscaling methods of change factor LARS, taking into account uncertainty of climate variability at three risk levels 25, 50, and 75 %.
2 Characteristics of the region 10
Having water resources in the environment, Urmia Lake basin is among the most im-portant aquatic ecosystems of Iran which is safeguarded as a natural park as of 1963, recognized as one of UNESCO Biophere Reserves since 1972, and declared a pro-tected pond of the Ramsar Convention. The twentieth great lake and the second saline lake in the world, Urmia Lake is known as the greatest river-basin of Iran with four hun-15
dred thousand year precedence. It is situated in north-west of Iran between latitudes 35◦40′–38◦30′ and longitudes 44◦07′–47◦53′ with average altitude 1276 m from the sea level, having its bottom level 1268 m. The area differs in thriving and drought times, and was calculated by Land sat images in June 1977 as 5750 km2. Located in a semi-arid climate, the lake has an annual precipitation average of 361 mm per year, a sign 20
of Mediterranean climate.
The annual average of basin temperature is 11◦C around the lake, and 2.5◦C in mountain areas. The length of Urmia Lake is between 130 to 140 km, and its average width is 40 km. The basin is surrounded by the northern part of the Zagros Mountains and southern hills of Sabalan and also by northern, western, and southern hills of 25
HESSD
10, 2183–2214, 2013Climate change effect on entering runoffto Urmia Lake
Iran
P. Razmara et al.
Title Page
Abstract Introduction
Conclusions References
Tables Figures
◭ ◮
◭ ◮
Back Close
Full Screen / Esc
Printer-friendly Version
Interactive Discussion
Discussion
P
a
per
|
Dis
cussion
P
a
per
|
Discussion
P
a
per
|
Discussio
n
P
a
per
|
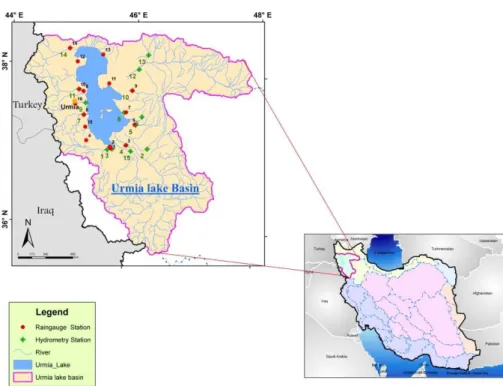
Several meteorogical stations are located on the lake owing to its extent and impor-tance. To determine average precipitation in the lake, the completed information of 16 stations was used employing GIS software and Polygon Thiessen method in the period 1961–1990.
Appropriate water and soil in the basin have made proper settings to improve and 5
optimize the exploitation of these valuable resources by laying and utilizing numer-ous aquatic projects over the rivers of the basin. So, because of many takings exist-ing upstream of the hydrometric stations – such as dam tanks, networks of irrigation, drainage, agriculture, etc. – the total runoff of the precipitations does not pour into the lake. Hence the runoffof entering rivers should be improved to be adopted in the 10
rainfall-runoff model. Therefore, in this research the runoff of all main and tributary rivers was improved regarding the takings upstream.
To compute the discharge into the lake, we employed the information of 15 main hydrometric stations of period 1961–1990 existing in the region of the lake. It is to be noted that there are 12 seasonal rivers north of the lake only one of which possesses 15
hydrometric station, whence to estimate the discharge of the northern part of the lake, experimental relations were used. Of course, the portion of surface water resources in the northern part of the lake is 1.78 %, not considerable compared to that of permanent rivers (93.18 %) or Streams (5.03 %). Being ideal data, the information of meteorology station of Urmia city was used as reference to get average temperature of the basin, 20
and since the altitude difference between the stations were insignificant the temper-ature of the Urmia synoptic station was taken as the base tempertemper-ature in the period 1961–1990. The statistical information on climate data pertaining to the base period for selected stations is given in Table 1.
3 Methods 25
HESSD
10, 2183–2214, 2013Climate change effect on entering runoffto Urmia Lake
Iran
P. Razmara et al.
Title Page
Abstract Introduction
Conclusions References
Tables Figures
◭ ◮
◭ ◮
Back Close
Full Screen / Esc
Printer-friendly Version
Interactive Discussion
Discussion
P
a
per
|
Dis
cussion
P
a
per
|
Discussion
P
a
per
|
Discussio
n
P
a
per
|
IPCC (IPCC-AR4) are generated under two scenarios A2 and B1 for the future period 2013–2040. In the second, the outputs of these models are downscaled by the method of change-factor LARS downscaling. Thirdly, the runoffrainfall of the region is modeled by the artificial neural network, and then the values are downscaled and introduced to the network to, finally, the runoffvalues be computed at three risk probabilities 25, 50, 5
and 75 % taking uncertainties into account. In this way, the final results are calculated regarding three uncertainty sources – GCM models, emission scenarios, and climate variability. In what follows the details of each step are reported.
3.1 Generating climate scenarios
To study climate change for the future periods, generation of climate scenarios is nec-10
essary, the most convincing way to generate which is utilizing the output of AOGCM models that are based on physics laws and mathematical formulae to be solved in a 3-D network on the surface of the earth. To simulate the climate of the globe, the main climate processes- atmosphere, ocean, the earth’s surface, scale ice, and biosphere-are simulated in tributary models separately, and then those of atmosphere and ocean 15
are matched together to form AOGCM models (IPCC-TGCIA, 1999). In the present work, ten AOGCM-AR4 models were used with characteristics given in Table 2.
3.2 Emission scenarios
Since the most essential inputs of AOGCM models are the rate of emission of green-house gases in future periods with no clear-cut way of determination, different sce-20
narios are presented holding how the gases change in future. IPCC offered in 2007 a new series of the scenarios dubbed SRES (Special Report on Emission Scenario). In these scenarios the emission is determined by drivers such as population rate, eco-nomic growth rate, and the importance bestowed on the environment for future periods. The fundamental subject of A2 scenario is to strengthen regional population forces 25
HESSD
10, 2183–2214, 2013Climate change effect on entering runoffto Urmia Lake
Iran
P. Razmara et al.
Title Page
Abstract Introduction
Conclusions References
Tables Figures
◭ ◮
◭ ◮
Back Close
Full Screen / Esc
Printer-friendly Version
Interactive Discussion
Discussion
P
a
per
|
Dis
cussion
P
a
per
|
Discussion
P
a
per
|
Discussio
n
P
a
per
|
economic developments. That of B1 scenarios is the fast economic development of the world, population growth, and the introduction of newer and practical technologies, with emphasis on clear energies to reach stable environment and economy. In this study, both scenarios A2 and B1 are applied to model future temperature and rainfall in each of the ten AOGCM models.
5
3.3 Downscaling
One of vital constraints in using outputs of AOGCM is their high resolution that is not compatible with the necessary precision of hydrological models. Therefore the results should be improved as regards locality and time. The methods of generating regional climate scenarios from the climate scenarios of AOGCM models are called “downscal-10
ing”.
3.3.1 Local downscaling of outputs of AOGCM models
In this research, the method of “change factor downscaling” is used for local down-scaling of AOGCM models. In this method the usual monthly ratios are obtained from historical series, and the climate variables simulated by AOGCM are derived from the 15
cell in which the region under study is placed. First of all, the climate change scenarios for temperature and rainfall are generated. To compute the scenarios for each model, the “difference” values for temperature, and “ratio” for rainfall for long-term average per month in the period 2013–2040 as well as the simulated base period is computed for each cell by the computational network.
20
∆Ti=(TGCM,fut,i−TGCM,base,i) (1)
∆Pi =(PGCM,fut,i−PGCM,base,i) (2)
HESSD
10, 2183–2214, 2013Climate change effect on entering runoffto Urmia Lake
Iran
P. Razmara et al.
Title Page
Abstract Introduction
Conclusions References
Tables Figures
◭ ◮
◭ ◮
Back Close
Full Screen / Esc
Printer-friendly Version
Interactive Discussion
Discussion
P
a
per
|
Dis
cussion
P
a
per
|
Discussion
P
a
per
|
Discussio
n
P
a
per
|
12),TGCM,fut,i is the 30 yr average of the simulated temperature by AOGCM in the future
period for each month, andTGCM,base,iis the 30 yr average of the simulated temperature
by AOGCM in the period similar to the observed period (1961–1990) for each month. As for precipitation, the above-said instances are also held.
3.3.2 Determination of risk levels of scenarios 5
After determination of the monthly long-term scenarios of climate change in tempera-ture and precipitation, the range of variations of the scenarios per month were weighted by the probability density function (pdf) Beta (Eq. 3).
f(x;α,β)= 1 B(α,β)·
1 b−a·
x−a b−a
α−1
·
b−x b−a
β−1
(3)
In this formula, a and b are the ends of the interval (a < b),αandβare the parameters 10
determining skewness of the curve having positive values, andX stands for the climate change scenario.
The function is chosen since it contributes the maximum weight to the middle values, and the minimum weight to the limit values. In this fashion, twelve pdf for temperature, and twelve pdf for precipitation were achieved. Next, to establish different probability 15
levels for the scenarios, the cumulative density function (cdf) for each month was gen-erated, and the values for temperature and precipitation corresponding to the levels 25, 50, and 75 % were determined.
3.3.3 Statistical (time) downscaling of outputs of AOGCM models with climate model LARS
20
HESSD
10, 2183–2214, 2013Climate change effect on entering runoffto Urmia Lake
Iran
P. Razmara et al.
Title Page
Abstract Introduction
Conclusions References
Tables Figures
◭ ◮
◭ ◮
Back Close
Full Screen / Esc
Printer-friendly Version
Interactive Discussion
Discussion
P
a
per
|
Dis
cussion
P
a
per
|
Discussion
P
a
per
|
Discussio
n
P
a
per
|
the same. The test survey the null hypothesis to the effect that the two distributions or the two means are similar, so that the difference is not significant.
Each test has a P-value examining the probability that any two sets of data belong to the same distribution. So, for a very low P-value the null hypothesis is rejected, which means that the difference between observed climate and the simulated one is signifi-5
cant for that variable, and resemblance between them is improbable. On the contrary, a high P-value shows that one could not reject the null hypothesis, that is, the diff er-ences are small and significant. Here, the confidence level of these tests is considered as 1 %, so for P >0.01 the null hypothesis could not be rejected. The generator of random climate is among the statistical downscaling methods to create daily climate 10
scenarios of a certain station. Generator of random climate is a model which after cali-bration of the station parameters of the observed climate could simulate the time series of the daily climate statistically similar to the observed one.
Also, through improvement of parameters using predicted climate changes via AOGCM’s the generation of simulated climate in future periods would be possible. In 15
this research, the LARS model was calibrated by the observed data of minimum and maximum temperature as well as precipitation in the period 1961–1990. Afterwards, the LARS model was performed for climate change scenarios of temperature and pre-cipitation in the region at levels 25, 50, and 75 % separately, and then the daily time series of temperature and precipitation for the period 2013–2040 was figured out. To 20
consider climate variability of the future period, a 280 yr daily time series for the future was generated and transformed to 10 time series of annual temperature and precipita-tion for the period 2013–2040.
3.4 Simulation of rainfall-runoffvia artificial neural network
Neural networks are computational models able to determine the relations between 25
HESSD
10, 2183–2214, 2013Climate change effect on entering runoffto Urmia Lake
Iran
P. Razmara et al.
Title Page
Abstract Introduction
Conclusions References
Tables Figures
◭ ◮
◭ ◮
Back Close
Full Screen / Esc
Printer-friendly Version
Interactive Discussion
Discussion
P
a
per
|
Dis
cussion
P
a
per
|
Discussion
P
a
per
|
Discussio
n
P
a
per
|
information (learning process), and finally, the model is capable of discovering the rules among inputs and outputs, though being non-linear and complicated (Haykin, 1994).
ANN is a strong implement to model nonlinear and complicated hydrological proce-dures such as rainfall-runoff(De Vos et al., 2005). The attractive feature of ANN is its capability in deriving relations between inputs and outputs of a process without phys-5
ical traits of the problem being clear. The rainfall-runoffrelation is nonlinear and very multifaceted. After ending of the learning process, the model resulting from ANN gives answers more quickly than the previous ones.
To calibrate the model, part of the observed climate data are used. Thus, after en-tering the data into the model and simulation of the river flow, comparison with the 10
observed flow is started on. In this stage, the parameter values are so purposely var-ied that the simulated flow be close to the observed flow. The performance of the model is taken successful only when the value of target function as the standard of efficiency of the model is optimized. After calibration, the verification of the model is rendered with parameters obtained in calibration stage by means of observed data not used in 15
calibration stage. If the simulation is satisfactory, the model would be ready for use (Semenov and Barrow, 2002).
To assess the function of neural network model in simulation of runoffthe following determiners are used.
RMSE= 1 n
v u u t
n
X
t=1
(Qobst−Qsimt)2 (4)
20
MAE=1 n
n
X
i=1
HESSD
10, 2183–2214, 2013Climate change effect on entering runoffto Urmia Lake
Iran
P. Razmara et al.
Title Page
Abstract Introduction
Conclusions References
Tables Figures
◭ ◮
◭ ◮
Back Close
Full Screen / Esc
Printer-friendly Version
Interactive Discussion
Discussion
P
a
per
|
Dis
cussion
P
a
per
|
Discussion
P
a
per
|
Discussio
n
P
a
per
|
R2=
1
n n
P
t=1
(Qobst−Qobst)(Qsimt−Qsimt)
Qobst×Qsimt
2
(6)
In these relations,QobsandQsimare, respectively, the average observed and simulated
values. It is recommended that the ANN inputs be standardized to prevent diminishing to a large extent of the weights in the neural networks (Haykin., 1994). In this study, the 5
relation (Eq. 7) is used to standardize the inputs between 0.1 and 0.9 to the advantage that the predictions are better outside of the limit values of the validation stage.
Ni=0.8
(Xi−Xmin)/(Xmax−Xmin)
+0.1 (7)
Here,Ni is the standardized value,Xi the real values,XminandXmaxare the minimum
10
and maximum real values, respectively. The variability of precipitation, runoff, and evap-oration from the lake surface are standardized and introduced into the network model. Of important steps in designing neural networks is to choose inputs. The most vital fac-tor in this choice is the physical peculiarity governing the process to be modeled by the networks. The choice of architecture in the computations is rendered by trial and error 15
during which using different values of hidden layers and related neurons the optimum network would be obtained. The more the number of layers and neurons, the better the function of network in the validation stage would be, however with a decline in the verification stage.
To get the best result, various input models were defined and assessed some of 20
HESSD
10, 2183–2214, 2013Climate change effect on entering runoffto Urmia Lake
Iran
P. Razmara et al.
Title Page
Abstract Introduction
Conclusions References
Tables Figures
◭ ◮
◭ ◮
Back Close
Full Screen / Esc
Printer-friendly Version
Interactive Discussion
Discussion
P
a
per
|
Dis
cussion
P
a
per
|
Discussion
P
a
per
|
Discussio
n
P
a
per
|
t,Pt−1precipitation in the previous montht−1,Tttemperature in montht,Et
evapora-tion in montht, andQt−1runoffin the previous montht−1.Q=f(Pt,Pt−1,Tt,Et,Qt−1).
The best number of hidden neurons by trial and error was 3 layers with final network architecture as (5, 3, 1).
In this research, there were studied characteristics of back propagation networks 5
(BPN) and Elman, which due to the best function the BPN were chosen. The re-searches show that about 90 % of the ANN’s used in hydrological processes is BPN (Coulibaly et al., 2000). The Logsigmoid function showed the best result among the Transfer functions. 70 % of data of last period 1961–1980 was dedicated to the valida-tion stage, and the remaining 30 % for the validavalida-tion stage 1980–1990.
10
4 Results and discussions
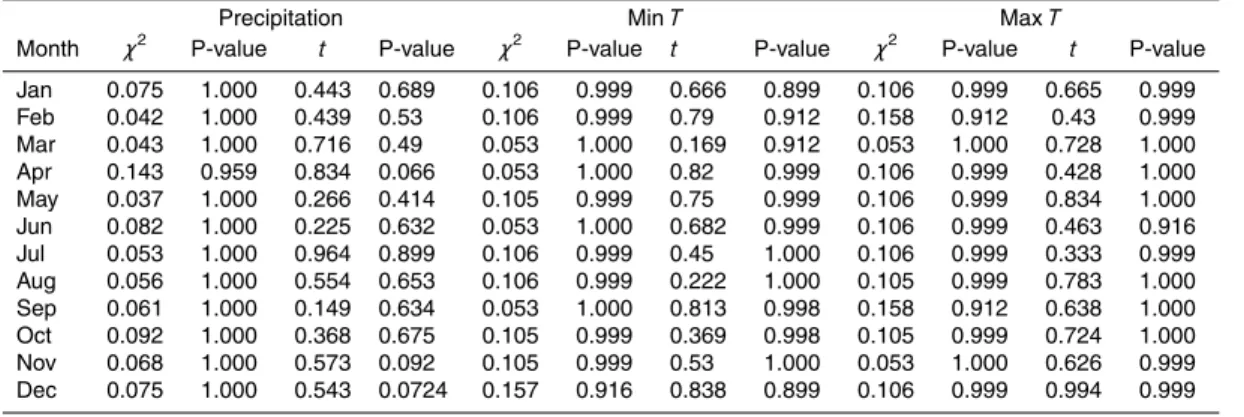
4.1 Results of downscaling
The results of tests for rainfall data, minimum and maximum temperature in all months of the year are given in Table 4. They show that the P-values are satisfactory at proba-bility level 1 %, and that null hypothesis is not rejected. In fact, for rainfall data, minimum 15
and maximum temperature the P-value oft test andχ2 test are greater than 1 %, so one could say that LARS-WG model has enough capability in a simulation of the me-teorological variables of the region in future period.
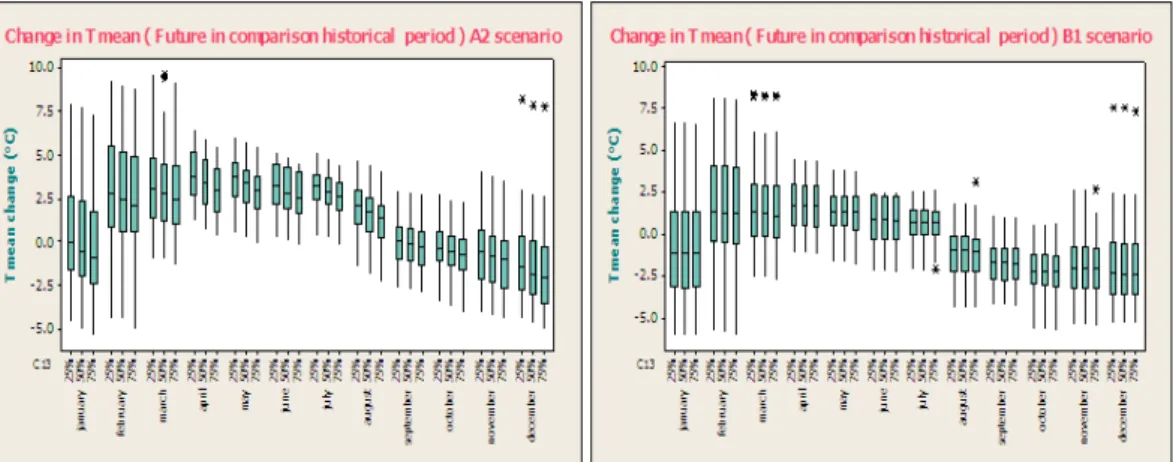
According to the acceptable function of temperature and precipitation data in LARS model, by establishing scenarios A2 and B1 at three risk levels, the downscaled data 20
for the future period 2013–2040 are obtained Figs. 2 and 3. By analyzing Fig. 2, it is inferred that in the scenario A2 the median of temperature changes in February to August at the three levels is positive, and is negative in the other months of the year. The mean of maximum temperature changes corresponds to April at a level 25 % and that for maximum decrease is related to December at 75 %. The difference between 25
HESSD
10, 2183–2214, 2013Climate change effect on entering runoffto Urmia Lake
Iran
P. Razmara et al.
Title Page
Abstract Introduction
Conclusions References
Tables Figures
◭ ◮
◭ ◮
Back Close
Full Screen / Esc
Printer-friendly Version
Interactive Discussion
Discussion
P
a
per
|
Dis
cussion
P
a
per
|
Discussion
P
a
per
|
Discussio
n
P
a
per
|
March at the level 25 % and January at 75 %. In B1, a slight increase in temperature is seen from February to July relative to the base period, while from August to January the future temperature shows a decline. The median of maximum increase was in April at a level 75 % and that for decrease was observed in December at level 75 %. Also, the difference between maximum and minimum changes of mean temperature 5
corresponds, respectively, to February at level 25 % and February at 75 %.
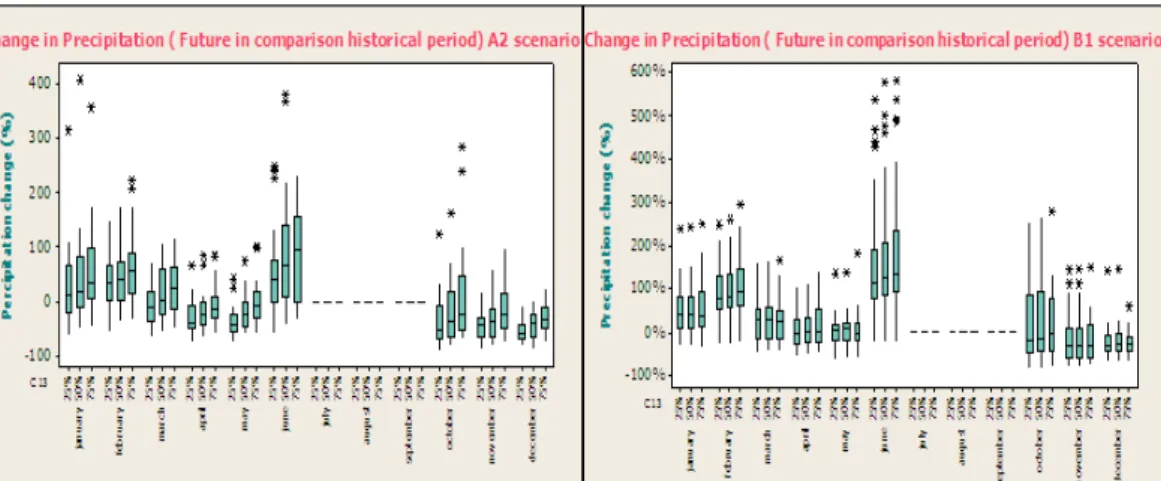
Precipitation is taken as the most important factor influencing runoff. Figure 3 shows the percentage range of long-term changes of monthly precipitation for the scenarios. By inspecting the figure, one could see that the average change of annual precipita-tion in scenario A2 was 0.82 % of that for the base period 1961–1990; the change 10
percentage was positive for January, February, March, and June at three levels, and it remained constant in April at 25 and 50 %, and in May and October at 75 %. In the other months the change percentage was diminishing and negative. The maximum median of the increase in precipitation corresponded to the level 75 % in June, and of decrease at a level 25 % in December.
15
In scenario B1 the average change of annual precipitation for the future period rel-ative to the observed one has increased to 22 %. The median change of precipitation was positive in January, February, March, and June at three levels, in April at 5 %, and in May at 25 and 50 %, and it was constant in April at 25 and 50 %, and in May and October at level 75 %. The median of maximum increase of precipitation was in June at 20
a level 75 %, and that for the decrease was in November at the three levels. Note that the percentage of precipitation change was estimated in months July to September, but due to shortage of rainfall in this season and having no effect on precipitation of the season in the future period, it was not shown in the Fig. 3.
4.2 Results of rainfall-runoffmodeling by ANN 25
HESSD
10, 2183–2214, 2013Climate change effect on entering runoffto Urmia Lake
Iran
P. Razmara et al.
Title Page
Abstract Introduction
Conclusions References
Tables Figures
◭ ◮
◭ ◮
Back Close
Full Screen / Esc
Printer-friendly Version
Interactive Discussion
Discussion
P
a
per
|
Dis
cussion
P
a
per
|
Discussion
P
a
per
|
Discussio
n
P
a
per
|
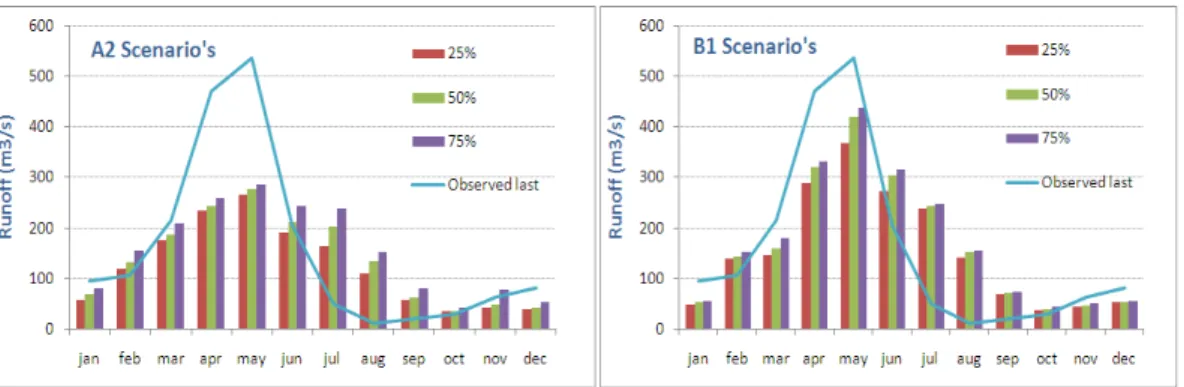
function with a higherR2(near to one) and a lower MAE, and RMSE (Close to zero). For this reason, by inspecting the results of the final selected models through Fig. 4, one admits the selected neural network model as having proper function in simulation. Figure 5 shows the long-term mean of the runoffof period 2013–2040 and the runoff of the observed period 1961–1990 in the basin of the lake via the neural network model. 5
Considering the following two figures (left and right) one perceives that the future runoff of the basin under scenario A2 is diminished in January, March, April, May, and Decem-ber at the three risk levels, in NovemDecem-ber at levels 25 and 50 %, and in June at a level 25 % relative to the base period, and also in average, the annual runoffhas decreased by 11.3 % compared to the base period with the most decrease in April and May. The 10
reason of runoffdecrease in scenario A2 is the change in temperature and precipita-tion. Meanwhile, in B1 we would have an increase in runoffby 12.5 % relative to the base period. In this scenario, the future runoffdecreases at three risk levels in January, March, April, May, November, and December, but in the other months we witness runoff increase. Figure 5 verifies that in both scenarios a decrease occurs in future runoffin 15
winter and spring, and increase happens in summer and fall.
4.3 Discussion
The effect of climate change uncertainty resources related to AOGCM models, emis-sion scenarios, and climate variability on the entering runoff to Urmia Lake in the pe-riod 2013–2040 was analyzed. To this end, we used simulations of temperature and 20
precipitation resulted from 10 AOGCM-AR4 such as: MRI-CGCM 2.3.2, CSIRO MK3, ECHAM5-OM, HadCM3, CCSM3, GISS E-R, GFDL-CM2.1, MIROC3.2, IPSL-CM4, CNRM-CM3 and two downscaling methods of statistical and change factor, and emis-sion scenarios A2 and B1 to consider climate variability of the 280 yr time series for the future period and condensing it to ten 28 yr time series. Also, for weightening of 25
HESSD
10, 2183–2214, 2013Climate change effect on entering runoffto Urmia Lake
Iran
P. Razmara et al.
Title Page
Abstract Introduction
Conclusions References
Tables Figures
◭ ◮
◭ ◮
Back Close
Full Screen / Esc
Printer-friendly Version
Interactive Discussion
Discussion
P
a
per
|
Dis
cussion
P
a
per
|
Discussion
P
a
per
|
Discussio
n
P
a
per
|
4.3.1 Temperature changes in future period
For scenario A2 the results tell of increase in future temperature relative to the base period. In this scenario the annual mean of temperature at levels 25, 50, and 75 % will increase, respectively, by 1.8, 1.5, and 1.2◦C. Whereas in B1 the annual mean of temperature decrease, respectively, by 0.14, 0.17, and 0.19◦C.
5
4.3.2 Precipitation changes in future period
In scenario A2, the changes of annual mean are decreasing in risk level 25 %, at level 50 %, and increase at a level 75 %, respectively, by 24.5, 6.8, and 10.9 %. In B1 the mean increased at levels 25, 50, and 75 %, respectively, by 17.4, 22., and 27.4 %. So we deduce that precipitation would decrease by 6.8 % in A2, and increase by 22.3 % in 10
B1 relative to the base period.
4.3.3 Runoffchanges in future period
Simulation of monthly runoffof the basin for the future period and comparison with the observed period indicates the decline of average runoffinto the lake by rate 21 % at risk level 25 %, by 13 % at level 50 %, and by 0.3 % at level 75 % in scenario A2, and in 15
the other scenario at all the three levels the runoffhas increment of 4.7 % at level 25 %, by 13.8 % at level 50 %, and by 18.4 % at level 75 %. Moreover, the results say that the changes of the modeled runoffin the humid period (May to April) are more than the dry period (November to May). Also, the results certify a decrease in the average future runoffin scenario A2 by rate 11.3 %, and a 12.5 % increase in scenario B1 relative to 20
HESSD
10, 2183–2214, 2013Climate change effect on entering runoffto Urmia Lake
Iran
P. Razmara et al.
Title Page
Abstract Introduction
Conclusions References
Tables Figures
◭ ◮
◭ ◮
Back Close
Full Screen / Esc
Printer-friendly Version
Interactive Discussion
Discussion
P
a
per
|
Dis
cussion
P
a
per
|
Discussion
P
a
per
|
Discussio
n
P
a
per
|
5 Conclusions
In the studies relating to climate change, different uncertainties could affect the results of final simulation so that withdrawing any of them would yield a non-actual result lead-ing to ambiguities for decision makers. The results of the present research involve the high effect of the AOGCM model uncertainties upon the runoffof the region. Therefore, 5
one should note that the use of just one AOGCM model for analyses of climate change is not able to cover all the uncertainty categories, which gives non-applicable results. Also, there is no preference between the functions of the AOGCM models in the simu-lation of the observed climate, in other words, one should apply the utmost number of them in the studies.
10
Here, a range of climate scenarios (10 AOGCM models under two emission scenar-ios) was investigated to determine their uncertainties along with a rainfall-runoffmodel. The uncertainties of the AOGCM models in temperature prediction for scenario A2 are 13.68, 13.44, and 13.94◦C, respectively, at risk levels 25, 50, and 75 %; and as for scenario B1 they are, respectively, 14.07, 14.06, and 14.21◦C. These are obtained, for 15
both scenarios at all three levels, in February. The uncertainties of these models in the prediction of precipitation in the future relative to the base period at different risk levels are, respectively, 545 % in June, 722 % in June, and 400 % in January for scenario A2, and for scenario B1 they are, respectively, 900, 957, and 947 % all three in June. In all, for each scenario at different probability levels the uncertainty of temperature cor-20
responded to February in any of the 6 cases, and the uncertainty of precipitation is related to June in 5 cases. As it is deduced from the results of this article, in general, scenario A2 with prediction of a warm and dry climate has decided a more critical sit-uation compared with scenario B1 with a cold and humid climate. So, if the conditions of the basin in futures tends to the emission scenario A2 (large growth of population 25
HESSD
10, 2183–2214, 2013Climate change effect on entering runoffto Urmia Lake
Iran
P. Razmara et al.
Title Page
Abstract Introduction
Conclusions References
Tables Figures
◭ ◮
◭ ◮
Back Close
Full Screen / Esc
Printer-friendly Version
Interactive Discussion
Discussion
P
a
per
|
Dis
cussion
P
a
per
|
Discussion
P
a
per
|
Discussio
n
P
a
per
|
decline of water level, and will endanger the life of those inhabiting the lands around the lake and causing it a fate similar to that of the Aral Sea.
Acknowledgement. Ali Noorzad – Chairman of IRCOLD (Iranian Committee on Large Dams) – thanks for his help in providing technical assistance. We would like to thank A. Shamsai for his kind guidance. Also authors appreciate from the reviewers who provided valuable comments to
5
improve the manuscript.
References
Bastola, S., Murphy, C., and Sweeney, J.: The role of hydrological modelling uncertainties in climate change impact assessments of Irish river catchments, Adv. Water Resour., 34, 562– 576, 2011.
10
Brekke, L. D., Miller, N. L., Bashford, K. E., Quinn, N. W. T., and Dracup, J. A.:: Climate change impacts uncertainty for water resources in the SAN JOAQUIN river basin, California, J. Am. Water Resour. Assoc., 40, 149–164, 2004.
Carter, T. R., Hulme, M., and Lal, M.: Guidelines on the use of scenario data for cli-mate impact and adaptation assessment. (eds) Version1, Intergovernmental Panel on
Cli-15
mate Change, Task Group on Scenarios for Climate Impact Assessment, IPCC-TGCIA, available at: http://unfccc.int/resource/cd roms/na1/v and a/Resoursce materials/Climate/ ScenarioData.pdf, last access: February 2012, 69 pp., 1999.
Collins, W. D., Bitz, C. M., Blackmon, M. L., Bonan, G. B., Bretherton, C. S., Carton, J. A., Chang, P., Doney, S. C., Hack, J. J., Henderson, T. B., Kiehl, J. T., Large, W. G.,
20
McKenna, D. S., Santer, B. D., and Smith, R. D.: The community climate system model: CCSM3, J. Climate, 19, 2122–2143, 2006.
Coulibaly, P., Anctil, F., and Bobee, B.: Daily reservoir inflow forecasting using artificial neural networks with stopped training approach, J. Hydrol., 230, 244–257, 2000.
Deg-Hyo, B., Il-Won, J., and Lettenmaier, D. P.: Hydrologic uncertainties in climate change from
25
IPCC AR4 GCM simulations of the Chungju Basin, Korea Original, J. Hydrol., 401, 90–105, 2011.
Delworth, T. L., Broccoli, A. J., Rosati, A., and Stouffer, R. J.: GFDL’s CM2 global coupled
climate models, Part 1 – Formulation and simulation characteristics, J. Climate, 19, 643– 674, 2006.
HESSD
10, 2183–2214, 2013Climate change effect on entering runoffto Urmia Lake
Iran
P. Razmara et al.
Title Page
Abstract Introduction
Conclusions References
Tables Figures
◭ ◮
◭ ◮
Back Close
Full Screen / Esc
Printer-friendly Version
Interactive Discussion
Discussion
P
a
per
|
Dis
cussion
P
a
per
|
Discussion
P
a
per
|
Discussio
n
P
a
per
|
D ´equ ´e, M., Dreveton, C., Braun, A., and Cariolle, D.: The ARPEGE/IFS atmosphere model, a contribution to the French community climate modelling, Clim. Dynam., 10, 249–266, 1994.
de Vos, N. J. and Rientjes, T. H. M.: Constraints of artificial neural networks for rainfall-runoff
modelling: trade-offs in hydrological state representation and model evaluation, Hydrol. Earth
Syst. Sci., 9, 111–126, doi:10.5194/hess-9-111-2005, 2005.
5
Downing, J. A., Prairie, Y. T., Cole, J. J., Duarte, C. M., Tranvik, L. J., Striegl, R. G., McDowell, W. H., Kortelainen, P., Caraco, N. F., Melack, J. M., and Middelburg, J.: The global abundance and size distribution of lakes, ponds, and impoundments, Limnol. Oceanogr., 51, 2388–2397, 2006.
Flato, G. M. and Boer, G. J.: Warming asymmetry in climate change simulations, Geophys.
10
Res. Lett., 28, 195–198, 2001.
Ge, Y. and Huadong, S.: Lake water changes in response to climate change in northern China: simulations and uncertainty analysis, J. Quaternary Int., 212, 44–56, 2010.
Gordon, C., Cooper, C., Senior, C. A., Banks, H. T., Gregory, J. M., Johns, T. C., Mitchell, J. F. B., and Wood, R. A.: The simulation of S.S.T, sea ice extents and ocean transport in a version
15
of the Hadley Center coupled model without flux adjustments, Clim. Dynam., 16, 147–168, 2000.
Gordon, H. B. and O’Farrell, S. P.: Transient climate change in the CSIRO coupled model with dynamic sea ice, Mon. Weather Rev., 125, 875–907, 1997.
Gordon, H. B., Rotstayn, L. D., McGregor, J. L., Dix, M. R., Kowalczyk, E. A., O’Farrell, S. P.,
20
Waterman, L. J., Hirst, A. C., Wilson, S. G., Collier, M. A., Watterson, I. G., and Elliott, T. I.: The CSIRO Mk3 Climate System Model (Electronic publication), CSIRO Atmospheric Re-search technical paper; no. 60, CSIRO Atmospheric ReRe-search, Aspendale, 130 pp., 2002. Hasumi, H. and Emori, S. (Eds.): K-1 coupled model (MIROC) description, K-1 technical report
1. Center for Climate System Research, University of Tokyo, available at: www.ccsr.u-tokyo.
25
ac.jp/kyosei/hasumi/MIROC/tech-repo.pdf, last access: September 2012, 34 pp., 2004. Haykin, S.: Neural Networks – A Comprehensive Foundation, Macmillan College Publishing
Company, New York, 1994.
Hourdin, F., Musat, I., Bony, S., Braconnot, P., Codron, F., Dufresne, J.-L., Fairhead, L., Filib-erti, M.-A., Friedlingstein, P., Grandpeix, J.-Y., Krinner, G., LeVan, P., Li, Zh.-X., and Lott, F.:
30
HESSD
10, 2183–2214, 2013Climate change effect on entering runoffto Urmia Lake
Iran
P. Razmara et al.
Title Page
Abstract Introduction
Conclusions References
Tables Figures
◭ ◮
◭ ◮
Back Close
Full Screen / Esc
Printer-friendly Version
Interactive Discussion
Discussion
P
a
per
|
Dis
cussion
P
a
per
|
Discussion
P
a
per
|
Discussio
n
P
a
per
|
Katz, R. W., Parlange, M. B., and Naveau, P.: Statistics of extremes in hydrology, Adv. Water Resour., 25, 1287–1304, 2002.
Knutson, T. R., Delworth, T. L., Dixon, K. W., and Stouffer, R. J.: Model assessment of regional
surface temperature trends (1949–97), J. Geophys. Res., 104, 30981–30996, 1999.
Lijalem Zeray, A., Jackson, R., and Dilnesaw Alamirew, Ch.: Climate Change Impact on
5
Lake Ziway Watershed Water Availability, Ethiopia, Catchment Lake Res., 136, 376–385, doi:10.1061/(ASCE)WR.1943-5452.0000041, 2007.
Massah, A. R. and Morid, S.: Impact of climate change on runoffof Zayandeh Rud river, Iran.
J. Agric., 9, 20–28, 2006.
McBean, E. and Motiee, H.: Assessment of impact of climate change on water resources: a long
10
term analysis of the Great Lakes of North America, Hydrol. Earth Syst. Sci., 12, 239–255, doi:10.5194/hess-12-239-2008, 2008.
Meehl, G. A., Gent, P., Arblaster, J. M., Otto-Bliesner, B., Brady, E., and Craig, A.: Factors that
effect amplitude of El Nino in global coupled climate models, Clim. Dynam., 17, 515–526,
2001.
15
Minville, M., Brissette, F., and Leconte, R.: Impacts and Uncertainty of Climate Change on Water Resource Management of the Peribonka River System (Canada), J. Water Resour. Plan. Manage.-ASCE, 136, 376–385, 2010.
Mortsch, L. D. and Quinn, F. H.: Climate change scenarios for Great Lakes Basin ecosystem studies, Limnol. Oceanogr., 41, 903–911, 1996.
20
Motiee, H. and McBean, E.: An Assesment of long term trends in hydrologyic components and implications for water levels in lake Superior, Hydrol. Res., 40, 564–579, 2009.
New, M. and Hulme, M.: Representing uncertainty in climate change scenarios: a Monte-Carlo approach, Integr. Assess., 1, 203–213, 2000.
Nigel, A. and Chunzhen, L.: Hydrology and water resources, availabale at: http://www.grida.no/
25
CLIMATE/IPCC TAR/wg2/pdf/wg2TARchap4.pdf, last access: November 2012.
Nozawa, T., Emori, S., Numaguti, A., Tsushima, Y., Takemura, T., Nakajima, T., Abe-Ouchi, A., and Kimoto, M.: Projections of future climate change in the 21st century simulated by the CCSR/NIES CGSM under the IPCC SRES scenarios, in: Present and Future of Modelling Global Environmental change – Toward Integrated Modelling, edited by: Matsuno, T., Terra
30
HESSD
10, 2183–2214, 2013Climate change effect on entering runoffto Urmia Lake
Iran
P. Razmara et al.
Title Page
Abstract Introduction
Conclusions References
Tables Figures
◭ ◮
◭ ◮
Back Close
Full Screen / Esc
Printer-friendly Version
Interactive Discussion
Discussion
P
a
per
|
Dis
cussion
P
a
per
|
Discussion
P
a
per
|
Discussio
n
P
a
per
|
Pope, V., Gallani, M. L., Rowntree, P. R., and Stratton, R. A.: The impact of new physical pa-rameterizations in the Hadley Centre climate model: HadAM3, Clim. Dynam., 16, 123–146, 2000.
Rasco, P., Szeidl, L., and Semenov, M. A.: A serial approach to local stochastic models, J. Ecol. Model., 57, 27–41, 1991.
5
Roeckner, E., Arpe, K., Bengtsson, L., Christoph, M., Claussen, M., D ¨umenil, L., Esch, M., Giorgetta, M., Schlese, U., and Schulzweida, U.: The atmospheric general circulation model ECHAM-4: Model description and simulation of present-day climate: The atmospheric gen-eral circulation model ECHAM-4: Model, Report 218, Max-Planck-Institut f ¨ur Meteorologie, Hamburg, 1996.
10
Schindler, D. W.: Lakes as sentinels and integrators for the effects of climate change on
water-sheds, airwater-sheds, and landscapes, Limnol. Oceanogr., 54, 2349–2358, 2009.
Schmidt, G. A., Ruedy, R., Hansen, J. E., Aleinov, I., Bell, N., Bauer, M., Bauer, S., Cairns, B., Canuto, V., Cheng, Y., Del Genio, A., Faluvegi, G., Friend, A. D., Hall, T. M., Hu, Y., Kelley, M., Kiang, N. Y., Koch, D., Lacis, A. A., Lerner, J., Lo, K. K., Miller, R. L., Nazarenko,
15
L., Oinas, V., Perlwitz, Ja., Perlwitz, Ju., Rind, D., Romanou, A., Russell, G. L., Sato, M., Shindell, D. T., Stone, P. H., Sun, S., Tausnev, N., Thresher, D., and Yao, M.-S.: Present day atmospheric simulations using GISS ModelE: comparison to in-situ, satellite and reanalysis data, J. Climate, 19, 153–192, 2006.
Semenov, M. A. and Barrow, E. M.: LARS-WG a stochastic weather generator for use in
cli-20
mate impact studies (version 3.0), User’s manual, available at: http://www.rothamsted.ac.uk/ mas-models/download/LARS-WG-Manual.pdf, last access: September 2012, 83 pp., 2002. Semenov, M. A. and Stratonovitch, P.: Use of multi-model ensembles from global climate
mod-els for assessment of climate change impacts, Climate Res., 41, 1–14, doi:10.3354/cr00836, 2010.
25
Semenov, M. A., Brooks, R. J., Barrow, E. M., and Richardson, C. W.: Comparison of the WGEN and LARS-WG Stochastic Weather Generators in Diverse Climates, Climate Res., 10, 95– 107, 1998.
Solomon, S., Qin, D., Manning, M., Chen, Z., Marquis, M., Averty, K. B., Tignor, M., and Miller, H. L. (Eds.): IPCC 2007 – Climate Change, The Physical Science Basis,
Contriu-30
HESSD
10, 2183–2214, 2013Climate change effect on entering runoffto Urmia Lake
Iran
P. Razmara et al.
Title Page
Abstract Introduction
Conclusions References
Tables Figures
◭ ◮
◭ ◮
Back Close
Full Screen / Esc
Printer-friendly Version
Interactive Discussion
Discussion
P
a
per
|
Dis
cussion
P
a
per
|
Discussion
P
a
per
|
Discussio
n
P
a
per
|
Somura, H., Arnold, J., Hoffman, D., Takeda, I., Mori, Y., and Di Luzio, M.: Impact of climate
change on the Hii River basin and salinity in Lake Shinji: a case study using the SWAT model and a regression curve, Hydrol. Process., 23, 1887–1900, 2009.
Talebizadeh, M. and Moridnejad, A.: Uncertainty analysis for the forecast of lake level fluctu-ations using ensembles of ANN and ANFIS models, Expert Syst. Appl. J., 38, 4126–4135,
5
2011.
Vemuri, V.: Artificial Neural Networks, Theoretical Concepts, IEEE Computer Society Press, Washington, D.C., 1998.
Wilby, R. L. and Harris, I.: A framework for assessing uncertainties in climate change im-pacts: Low-flow scenarios for the river thames, UK, Water Resour. Res., 42, W02419,
10
doi:10.1029/2005WR004065, 2006.
HESSD
10, 2183–2214, 2013Climate change effect on entering runoffto Urmia Lake
Iran
P. Razmara et al.
Title Page
Abstract Introduction
Conclusions References
Tables Figures
◭ ◮
◭ ◮
Back Close
Full Screen / Esc
Printer-friendly Version
Interactive Discussion
Discussion
P
a
per
|
Dis
cussion
P
a
per
|
Discussion
P
a
per
|
Discussio
n
P
a
per
|
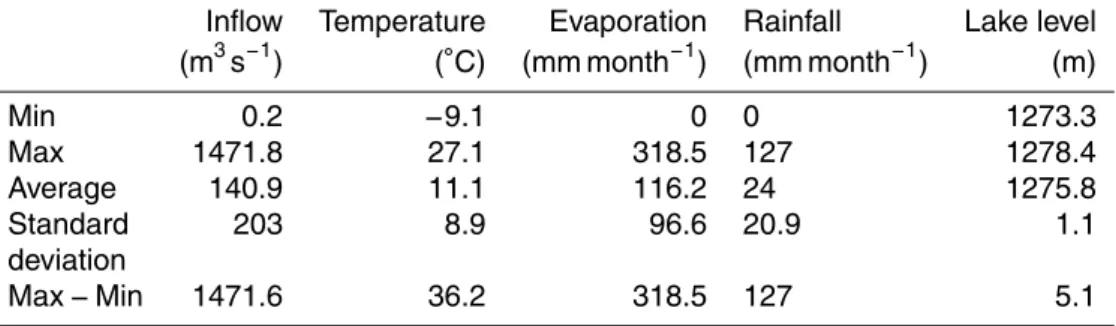
Table 1.Statistical information of data in the base period of Urmia Lake basin (summary of available data).
Inflow Temperature Evaporation Rainfall Lake level
(m3s−1) (◦C) (mm month−1) (mm month−1) (m)
Min 0.2 −9.1 0 0 1273.3
Max 1471.8 27.1 318.5 127 1278.4
Average 140.9 11.1 116.2 24 1275.8
Standard 203 8.9 96.6 20.9 1.1
deviation
HESSD
10, 2183–2214, 2013Climate change effect on entering runoffto Urmia Lake
Iran
P. Razmara et al.
Title Page
Abstract Introduction
Conclusions References
Tables Figures
◭ ◮
◭ ◮
Back Close
Full Screen / Esc
Printer-friendly Version
Interactive Discussion
Discussion
P
a
per
|
Dis
cussion
P
a
per
|
Discussion
P
a
per
|
Discussio
n
P
a
per
|
Table 2.Characteristics of 10 AOGCM models used in this research.
Reference Emission Separation Founder Abbreviation Global climate
scenarios strength group model model
Pope et al. A2, B1 2.5◦×3.75◦ UKMO(UK) HadCM3 HadCM3
(2000)
Roeckner A2, B1 1.9◦×1.9◦ MPI-M MPEH5 ECHAM5-OM
et al. (1996) (Germany)
Gordon A2, B1 1.9◦×1.9◦ ABM CSMK3 CSIRO-MK3.0
et al. (2000) (Australia)
Delworth A2, B1 2.0◦×2.5◦ NOAA/GFDL GFCM21 GFDL-CM2.1
et al. (2006) (USA)
K-L-Model- A2, B1 2.8◦
×2.8◦ MRI MRCGCM MRI-CGCM2.3.2
Developers (Japan)
(2004)
Collins A2, B1 1.4◦
×1.4◦
NCAR NCCCSM CCSM3
et al. (2004) (USA)
D ´equ ´e A2, B1 1.9◦×1.9◦ CNRM CNRM CNRM-CM3
et al. (1994) (France)
Hasumi A2, B1 2.81◦×2.81◦ NIES MIMR MIROC3.2
et al. (2004) (Japan)
Hourdin A2, B1 2.5◦×3.75◦ IPSL IPCM4 IPSL-CM4
et al. (2006) (France)
Schmidt A2, B1 4.0◦×5.0◦ NASA/GISS GIER GISS-E-R
HESSD
10, 2183–2214, 2013Climate change effect on entering runoffto Urmia Lake
Iran
P. Razmara et al.
Title Page
Abstract Introduction
Conclusions References
Tables Figures
◭ ◮
◭ ◮
Back Close
Full Screen / Esc
Printer-friendly Version
Interactive Discussion
Discussion
P
a
per
|
Dis
cussion
P
a
per
|
Discussion
P
a
per
|
Discussio
n
P
a
per
|
Table 3.Selected models used in artificial neural network to simulate runoff
Qt=f(Pt) Qt=f(Pt,Et) Qt=f(Pt,Tt) Qt=f(Pt,Et,Tt) Qt=f(Pt,Pt−1)
HESSD
10, 2183–2214, 2013Climate change effect on entering runoffto Urmia Lake
Iran
P. Razmara et al.
Title Page
Abstract Introduction
Conclusions References
Tables Figures
◭ ◮
◭ ◮
Back Close
Full Screen / Esc
Printer-friendly Version
Interactive Discussion
Discussion
P
a
per
|
Dis
cussion
P
a
per
|
Discussion
P
a
per
|
Discussio
n
P
a
per
|
Table 4.Results ofχ2 test for comparing probability distribution, and ofttest for comparing the mean of the observed data and those generated by LARS-WG of rainfall, maximum, and minimum temperature.
Precipitation MinT MaxT
HESSD
10, 2183–2214, 2013Climate change effect on entering runoffto Urmia Lake
Iran
P. Razmara et al.
Title Page
Abstract Introduction
Conclusions References
Tables Figures
◭ ◮
◭ ◮
Back Close
Full Screen / Esc
Printer-friendly Version
Interactive Discussion
Discussion
P
a
per
|
Dis
cussion
P
a
per
|
Discussion
P
a
per
|
Discussio
n
P
a
per
|