www.hydrol-earth-syst-sci.net/15/197/2011/ doi:10.5194/hess-15-197-2011
© Author(s) 2011. CC Attribution 3.0 License.
Earth System
Sciences
Distributed specific sediment yield estimations in Japan attributed
to extreme-rainfall-induced slope failures under a changing climate
K. Ono1, T. Akimoto1, L. N. Gunawardhana1, S. Kazama1, and S. Kawagoe2
1Department of Civil Engineering, Tohoku University, 6-6-06, Aramaki aza aoba, Aoba ku, Sendai, 980-8579, Japan 2Division of Environmental System Management, Faculty of Symbiotic Systems Science, Fukushima University, 1,
Kanayagawa, Fukushima, 960-1296, Japan
Received: 4 August 2010 – Published in Hydrol. Earth Syst. Sci. Discuss.: 22 September 2010 Revised: 4 January 2011 – Accepted: 16 January 2011 – Published: 20 January 2011
Abstract. The objective of this study was to estimate the
potential sediment yield distribution in Japan attributed to extreme-rainfall-induced slope failures in the future. For this purpose, a regression relationship between the slope failure probability and the subsequent sediment yield was developed by using sediment yield observations from 59 dams through-out Japan. The slope failure probability accounts for the ef-fects of topography (as relief energy), geology and hydro-climate variations (hydraulic gradient changes due to ex-treme rainfall variations) and determines the potential slope failure occurrence with a 1-km resolution. The applicability of the developed relationship was then validated by compar-ing the simulated and observed sediment yields in another 43 dams. To incorporate the effects of a changing climate, extreme rainfall variations were estimated by using two cli-mate change scenarios (the MRI-RCM20 Ver.2 model A2 scenario and the MIROC A1B scenario) for the future and by accounting for the slope failure probability through the effect of extreme rainfall on the hydraulic gradient. Finally, the developed slope failure hazard-sediment yield relation-ship was employed to estimate the potential sediment yield distribution under a changing climate in Japan.
Time series analyses of annual sediment yields covering 15–20 years in 59 dams reveal that extreme sedimentation events have a high probability of occurring on average ev-ery 5–7 years. Therefore, the extreme-rainfall-induced slope failure probability with a five-year return period has a statis-tically robust relationship with specific sediment yield ob-servations (with r2= 0.65). The verification demonstrated that the model is effective for use in simulating specific sed-iment yields withr2= 0.74. The results of the GCM sce-narios suggest that the sediment yield issue will be critical
Correspondence to:
L. N. Gunawardhana
in Japan in the future. When the spatially averaged sed-iment yield for all of Japan is considered, both scenarios produced an approximately 17–18% increase around the first half of the 21st century as compared to the present climate. For the second half of the century, the MIROC and MRI-RCM20 scenarios predict increased sediment yields of 22% and 14%, respectively, as compared to present climate esti-mations. On a regional scale, both scenarios identified sev-eral common areas prone to increased sediment yields in the future. Substantially higher specific sediment yield changes (over 1000 m3/km2/year) were estimated for the Hokuriku, Kinki and Shikoku regions. Out of 105 river basins in Japan, 96 will have an increasing trend of sediment yield under a changing climate, according to the predictions. Among them, five river basins will experience an increase of more than 90% of the present sediment yield in the future. This study is therefore expected to guide decision-makers in iden-tifying the basins that are prone to sedimentation hazard un-der a changing climate in orun-der to prepare and implement appropriate mitigation measures to cope with the impacts.
1 Introduction
Slope failures, debris flows, and mass movements might be some of the most devastating outcomes associated with extreme rainfall (Cheng et al., 2005; Crosta and Frattini, 2008). The rapid buildup of pore water pressure beyond hy-drological thresholds following extreme rainfall events can induce substantial increases in sediment yields through slope failure, resulting in enormous economical and environmen-tal damage. Economically, extreme rainfall events bringing large quantities of sediment can push many structures, in-cluding hydro-power plants, sabo dams, urban drainage fa-cilities, flood barriers, and other infrastructure fafa-cilities, to failure (Kunkel et al., 1999; IADB, 2000). Moreover, high sediment concentrations added to rivers and streams can de-grade the drinking water quality, thus increasing the cost of water treatment, and are harmful to certain species of fish and aquatic organisms (Waters, 1995).
Japan is a country that is particularly prone to slope fail-ures due to its steep terrains and weak geological forma-tions. For example, extreme meteorological events in 2004 caused 326 deaths (3.4 times more than the average for 2000– 2003) and resulted in damage cost of an estimated 287.5 bil-lion JPY to agricultural production (2.7 times higher than the average for 2000–2003). The number of annual average slope failure events has doubled to more than 2530 through-out Japan (Climate Change Monitoring Report, 2004, 2005). Consequently, increased sediment concentrations have been reported, which have had an impact on river water qual-ity and associated ecosystems over a considerably long pe-riod of time. For example, following heavy rainfall events in July 2004 in Fukui prefecture, an elevated turbidity con-centration of over 100 degrees (Japanese standard for turbid-ity for drinking water is 2 NTU) was recorded for over five months in the Managawa dam area (Sakamoto, 2008).
In response to the increasing evidence of impacts, sedi-ment transport attributed to extreme rainfall has become an important issue under changing climate conditions, although the cause and effect of this phenomenon have still not been practically proven. By identifying and mapping the areas prone to slope failure, the spatial distribution of this hazard can be assessed. Moreover, by linking the probability of ex-treme rainfall events in the past with the output of General Circulation Models (GCM), we can create climate hazard maps for the future. There have already been several stud-ies accounting for the effects of climate changes and land use changes on sediment yields (Borga et al., 2002; Assel-man et al., 2003; Philip et al., 2009). However, thus far, studies have considered only geological and geographical conditions as the triggering parameters related to the effects of time-averaged climate change scenarios. There has been no research to assess the regional-scale sediment yield at-tributed to extreme rainfall under changing climate condi-tions. Therefore, the objective of this study is to estimate the spatially distributed sediment yield attributed to extreme-rainfall-induced slope failure hazards under changing climate conditions for all of Japan. Given the socio-economic and
ecological importance of this issue, zones must be defined in terms of the probability of occurrence of slope failures and subsequent sediment production for particular return periods. Such information will be essential for the decision-making process in Japan for hazard mitigation through proper re-gional planning and implementation.
2 Methodology
In general, there are three basic approaches, i.e., qualita-tive methods, physically based deterministic methods, and statistical methods, that have long been used for evaluating rainfall-induced slope failure hazards (Xie et al., 2007; Yil-mazer et al., 2007; Westen et al., 2003; Temesgen et al., 2001) and corresponding sediment yield estimations (Wicks and Bathurst, 1996; Bemporad et al., 1997; Westen et al., 1999; Bathurst, 2002, Maoa et al., 2009). All of these meth-ods have unique advantages when employed in different con-ditions and also suffer from their own drawbacks. The qual-itative approaches are simple and easy to apply but fail to properly represent hydro-geological processes. In contrast, physically based deterministic methods systematically ap-proximate physical concepts such as the equilibrium of the slope stability and surface water infiltration by applying a set of mathematical formulae, and modeling is done by us-ing physically meanus-ingful parameter set (Gunawardhana and Kazama, 2009b). The model calibration and validation is therefore carried out with comparatively short time series of field measurements. However, these methods are computa-tionally expensive and demand reasonably accurate spatially distributed parameters and meteorological inputs at a fine resolution (Hutchinson, 1995; Guzzetti et al., 2005). There-fore, physically based deterministic methods are difficult to apply practically over large areas with complex topography and geological formations. Statistical methods, on the other hand, do not require such large amounts of detailed input data. They develop a statistical relationship between the im-pacts (e.g., sediment yield) and impact-triggering parame-ters (e.g., extreme rainfall, earthquakes) based on a series of past observations. The statistical methods therefore possess a unique advantage over the other methods because they can be applied at the regional scale (Shou et al., 2009). Moreover, they can be used to predict the susceptibility of the impact, which enables us to link the model with climate change stud-ies. In this study, we employed statistical methodology to relate extreme-rainfall-induced slope failures with the subse-quent sediment yield. The working procedure of the study includes:
2. Development of a regression relationship between the probability of slope failure and subsequent sediment yield and
3. Application of the relationships developed with selected GCM scenarios to estimate the resultant sediment yield under changing climate conditions.
Numerous studies have pointed out the importance of various processes, such as geographical, geological and hydrologi-cal processes, in rainfall-induced slope failures and sediment yield assessments (Hutchinson, 1995; Dai et al., 2001). In this study, we consider three important triggering parame-ters; (1) the hydraulic gradient represents the hydro-climate effect, (2) the relief energy represents the geographical effect and (3) four geological formations represent the geological effect, attributed to slope failure hazards.
Regardless of the lithological structure, slope failures are more potentially causative in steep terrains than in gentle gradients. Therefore, the relief energy, which is defined as the elevation difference between the highest and low-est point in each grid cell, was used to represent the ef-fect of geography on slope failure hazards. The National-Land Information Database (2001), which has well-detailed, fine-resolution (1 km×1 km), digital elevation model data (KS-META-G05-54M) for all of Japan, was used to esti-mate the representative relief energy for each grid cell. The same database (KS-META-G05-56M) was used to classify the area for different geological zones at the same grid reso-lution. There are four geological formations that are com-monly found in Japan: colluviums, Neogene sedimentary rocks, Paleogene sedimentary rocks and granites; these were considered based on their likelihood in the formation of slope failures.
2.1 Estimation of the hydraulic gradient
The hydraulic gradient is defined as the rate of hydraulic head change per unit distance in a particular direction. Temporal changes in hydrological conditions (changes in soil mois-ture content from unsaturated to saturated and vice versa) due to variations in extreme rainfall and the resulting infil-tration rate have an intensive impact on slope failure forma-tions. The unsteady nature of this parameter offers a unique opportunity to combine our assessments with climate change studies. Nevertheless, it requires a large computational ef-fort as compared to other triggering parameters. To esti-mate the hydraulic gradient attributed to extreme rainfall at a 1-km resolution, we followed the method previously devel-oped by Kawagoe et al. (2010). The two-dimensional form of Richard’s equation was employed to obtain the hydraulic gradient, which was numerically solved by considering soil data, the slope angle and extreme rainfall as the indepen-dent input variables in each grid cell (more details can be found in Kawagoe et al., 2010). To estimate extreme
rain-fall events, 24-hour maximum rainrain-fall data covering 21 years (1980–2000) from the Automated Meteorological Data Ac-quisition System (AMeDAS) were employed with the Gen-eralized Extreme Value (GEV) probability distribution func-tion. For 1024 AMeDAS meteorological stations through-out Japan, GEV analysis indipendently generates 1024 ex-treme rainfall values to each station. Considering the fact that the rainfall patterns in mountain areas are largely in-fluenced by irregular topography (Buytaert et al., 2006), to distribute the estimated extreme rainfall at a resolution of 1-km, we used the “Mesh Climate Data 2000” rainfall database developed by the Japanese Meteorological Business Support Center (2002). In this database, the rainfall distribution over Japan was estimated by regression models constructed using independent variables developed from geographical factors (Lookingbill and Urban, 2003; Ueyama, 2004). The data set includes the monthly averaged rainfall over 30 years (1971– 2000) assembled at a 1-km grid resolution. A relationship be-tween the estimated extreme rainfall and maximum monthly rainfall from the Mesh Climate Data 2000 was developed for distributing the extreme rainfall to a 1-km grid resolution. To develop a statistically better relationship, the AMeDAS stations were categorized into three seasonal classes, win-ter (December–February), spring-summer (March–August) and autumn (September–November) based on the probabil-ity of an extreme rainfall event. As an example, the moun-tain areas at the seaside receive their maximum rainfall dur-ing the winter, while the south islands of Japan receive the most rainfall in the spring-summer category (Kawagoe et al., 2010). Therefore, three separate regression analyses were performed to obtain the relationship between the extreme rainfall and maximum monthly rainfall from the Mesh Cli-mate Data 2000, and later extreme rainfall values were dis-tributed with a 1-km grid resolution based on the maximum monthly rainfall values from the Mesh Climate Data 2000 at each grid box. These extreme rainfall values were then used as the main input in the infiltration analysis to find the hydraulic gradients.
2.2 Probability model for slope failure
By following the above procedures, the probability of slope failure occurrence was determined by accounting for past events of slope failures at each grid cell. A stepwise logistic regression method was then employed to find the relationship between the triggering parameters and slope failure probabil-ity (Eq. 1). Instead of considering the geological type as an independent variable with the appropriate weighting factor in the model, four different models were developed for each geological type.
log1−PP=σ0+σh×hyd+σr×relief
P=1+exp[−(σ 1
0+σh×hyd+σr×relief )]
whereP is the probability of slope failure occurrence,σ0is
the intercept,σh is the coefficient of the hydraulic gradient, σris the coefficient of relief energy,hydis the hydraulic
gra-dient, andrelief is the relief energy.
2.3 Probability model for sediment yield
Many studies have derived magnitude-frequency relation-ships for sediment yields in hazard assessments (Helsen et al., 2002; Marchi et al., 2002, Hunger et al., 2008). Differ-ences among these relationships reflect the influence of trig-gering parameters, such as rainfall, and the geomorphologic setting of the catchments. In this study, we developed a rela-tionship between the annual average specific sediment yield and the average probability of slope failure in the representa-tive catchment. The annual sediment yield data are available for the public use in the data base of Ministry of Land, In-frastructure, Transport and Tourism (MLIT) in Japan, where Sediment depth were measured by the automatic sensors, and used with the available cross-sections of the basin to calcu-late the annual average specific sediment yields. All selected dams are located in the upstream of the rivers, where the catchment area is largely cover with forest. According to Hasegawa et al. (2005), higher plant density in Japanese for-est prevents excessive sediment erosion by normal rainfall events. Therefore, the effect of soil erosion on sediment ac-cumulation is quite small compared to large sediment yield produced by slope failures. Altogether, 59 dams were se-lected throughout Japan. For each of these dams, the catch-ment areas are larger than 185 km2and more than 15 years of annual sediment yield records are available. The same rela-tionship was developed for various return periods of extreme rainfall, and the goodness of the fit was evaluated against the coefficient of determination to select the best-fit relationship for climate predictions.
2.4 GCMs for climate predictions
The Special Report on Emission Scenarios (SRES) along with the IPCC AR4 report has given widely recognized GCMs for climate predictions. In this study, we used two climate scenarios from two GCMs developed in Japan: the Meteorological Research Institute Regional Climate model (MRI-RCM20-Ver.2) embedded with the SRES A2 scenario and the MIROC3.2 HIRES (high-resolution version of the Model for Interdisciplinary Research on Climate) embed-ded with the SRES A1B scenario. The GCMs above have demonstrated good performance in simulating large-scale circulations and climate features that affect regional climates (Salathe et al., 2007). However, the resolutions are still far too coarse to use in site-specific assessments, especially in mountainous areas. Therefore, a statistical downscaling tech-nique was employed to link the spatial gap between the local scale grid resolution (1-km in this study) and the GCM grid scale (Iizumi et al., 2008). Climates for three time periods,
the present climate (1980–2000), an intermediate climate (2036–2065 for MIROC and 2031–2050 for MRI-RCM20-Ver.2) and the future climate (2065–2095 for MIROC and 2081–2100 for MRI-RCM20-Ver.2), were selected to show the transition of the impact in the future. The two selected GCMs have some advantages as compared to other models presented in IPCC AR4. Firstly, the model outputs produced finer resolutions, which is particularly useful for use with mountainous topography. For example, the HADCM3 model has a very coarse resolution that is approximately equal to 90 465 km2 of the grid boxes in Japan, while the MRI-RCM20-Ver.2 model resolution is only 400 km2. Secondly, MIROC and MRI-RCM20-Ver.2 have been proven to be very effective in simulating the climate variables that eventually produced the impacts for extreme cases over wider ranges (GERF S-4 project document, 2008). Therefore, they avoid the extensive downscaling efforts that are necessary for many GCM scenarios for predicting the impacts in a reliable range. In the first step of downscaling, the procedure explained in Sect. 2.1 was applied with the GCM-produced daily rainfall to obtain the extreme rainfall distribution at the GCM grid scale (hereafter referred to as ERFGCM). Because the bias
correction was to be performed at the GCM grid scale, the extreme rainfall in the present climate (hereafter referred to as ERFPC)as derived in Sect. 2.1 at a 1-km grid resolution
was aggregated with the grid scale of the climate model (e.g., 20 km for MRI-RCM20-Ver.2). The ERFGCM data for each
time period (intermediate and future climate) were then sep-arately matched with the ERFPCdata belonging to the three
seasonal categories to form transfer functions (six transfer functions for each GCM scenario separated into three sea-sonal classes and two time resolutions). In the final step, the original extreme rainfall values at a 1-km grid resolution were used in the corresponding transfer function to obtain the future (intermediate and future climate) extreme rainfall values. This process was repeated for each grid cell in the do-main to obtain the extreme rainfall distribution for two sce-narios in two future time periods.
3 Results and discussion
3.1 Slope failure probability and sediment yield
0.40 0.45 0.50 0.55 0.60 0.65 0.70 0.75
0 5 10 15 20 25 30
Return period (years) exponential linear equation regression equation logarithmic linear equation multinormal regression equation power linear equation
Det
e
rm
inat
ion
c
o
e
ff
ic
ient
(pr
obabi
lit
y
and
s
pe
c
if
ic
s
edi
m
ent
y
ield)
(a)
b)
Average recurrence
interval (years)
500km
6
10 - 15 9 - 10 8 7 7
5
>15 (b)
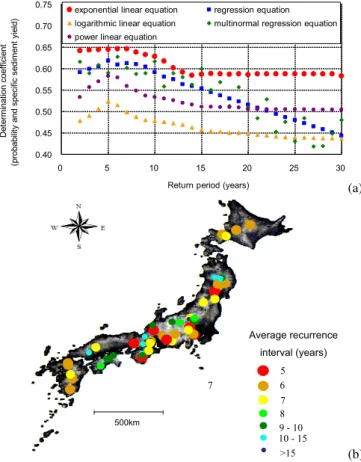
Fig. 1. (a)Determination coefficient of probability of the slope fail-ure and specific sediment yield with respect to different return peri-ods,(b)return period of extreme sediment yield events.
probability in the model when one triggering parameter (hy-draulic gradient or relief energy) is changed by one unit while the other parameter is held constant. The standardized partial regression coefficient was higher for the hydraulic gradient than for the relief energy for all four geological formations. This suggests that the hydraulic gradient is more influential than the relief energy in terms of triggering slope failures. Secondly, differences in magnitude of the coefficient of each parameter in different geological settings indicate variations in their resistance to slope failures. The probability of slope failure occurrence varied from the highest in colluviums to the lowest in granites. The generally loose, non-consolidated nature of the colluviums has been proven to be more signif-icant in the occurrence of slope failures than hard compact formations such as granite (Restrepo et al., 2006). The devel-oped slope faliure model was validated with historical land-slide hazard data for Tochio city, where 183 landland-slides were occurred in 2004 (Kawagoe et al., 2010). It showed that all 183 slope failures have occurred in the areas where we have estimated slope failure probability with more than 80%.
In the next step, a regression model for the slope fail-ure probability and subsequent sediment yield was devel-oped. Extreme rainfalls generally exhibit greater return
pe-0.0 0.2 0.4 0.6 0.8 1.0 1.2 1.4 1.6 1.8 2.0
0 20 40 60 80 100
SY = 0.1051exp(0.0301P)
R2 = 0.6541
1 Probability of slope failure P (%)
Sp
e
c
if
ic
s
e
d
im
e
nt
y
iel
d
SY (
×
10
3m 3/km 2/year)
Fig. 2. Relationship between the probability of slope failure and specific sediment yield.
riods (e.g. Jones and Reid, 2001). In this study, we exam-ined the match of various return periods of extreme rainfall (e.g. 5, 10, 15, 20, 25 and 30) with specific sediment yield. Among them, the five-year return period gave the best fit with a determination coefficient of 0.65 for exponential lin-ear equation (Fig. 1a). The underlying reason for the best fit with respect to the five-year return period was tested by examining the number of years of extreme sediment yield in each dam. Annual sediment yield records covering 15–20 years at each dam were examined. Assuming that the an-nual sediment yield averaged over the catchment is normally distributed throughout the recording period (15–20 years), the lower bound of the extreme sediment yield (SYLB in
m3/km2/year) in each catchment is defined as in Eq. (2).
SYLB=SYAvg+SD (2)
where SYAvg (in m3/km2/year ) is the annual average
sedi-ment yield in the catchsedi-ment and SD is the standard deviation of the annual sediment yield data series. Sediment yields exceeding the threshold of SYLBare defined as extreme
sed-iment yield events. The threshold of SYLBis then used to
separate the years with extreme sediment yield events at each dam site. Figure 1b indicates the average recurrence interval (Chow et al., 1988) of extreme sediment yield events at all selected dam sites throughout Japan. According to this, over 55% of the dams studied, experience an extreme sediment yield event every 5–7 years, and over 80% of the dams ex-perience one every 5–10 years, on average. These figures clearly explain the reason for the statistically better relation-ship obtained between the extreme rainfall and extreme sed-iment yield over a five-year return period.
Figure 2 depicts the relationship between the catchment-averaged probability of the slope failure occurrence and the annual-averaged sediment yield for a five-year extreme rain-fall return period, and Eq. (3) shows the representative re-gression relationship.
Specific sediment yield
(×103m3/km2/year)
500km
0 – 0.1 0.1 – 0.2 0.2 – 0.3 0.3 – 0.4 0.4 – 0.5 0.5 – 0.6
> 0.6
(a)
0.0 0.5 1.0 1.5 2.0 2.5
0.0 0.5 1.0 1.5 2.0 2.5 3.0 3.5 4.0 4.5 5.0
Actual specific sediment yield (×103m3/km2/year)
C
a
lc
u
lat
ed
sp
ec
ifi
c
se
dime
nt
y
ie
ld
(×
10
3m 3/km 2/ye
a
r)
Actual sediment yield < 1.2
Actual sediment yield > 1.2
2 (b)
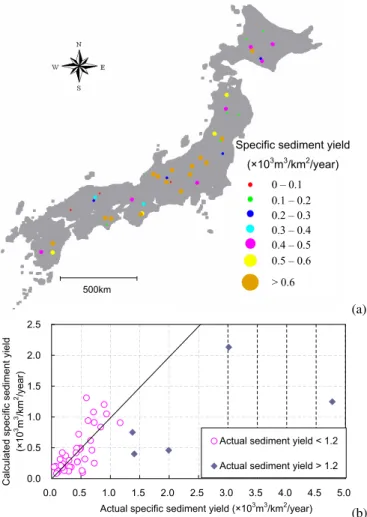
Fig. 3.Model validation:(a)locations of the selected dams,(b) ob-served and simulated specific sediment yields.
where SY is the annual average sediment yield (m3/km2/year) in a particular dam and P is the spa-tially averaged probability of slope failure occurrence in a specific dam catchment. The exponential shape of the rela-tionship indicates that the sediment yield may substantially increase with increasing probability of slope failure.
The validity of the developed relationship was tested prior to its use in climate impact predictions. Another 43 dams, which were not considered in developing the original regres-sion relationship, were selected, covering all of Japan. Fig-ure 3a shows the locations of these dams in Japan based on their annual average sediment productions. Figure 3b depicts a comparison of the simulated and observed sedi-ment yields. Out of the 43 dams, only 5 dams whose ob-served annual average sediment accumulations were greater than 1.2×10³m3/km2/year were not well-predicted in terms of sediment yield. It is noted that the catchment areas of the dams with low accuracy predictions were comparatively small, and large-scale slope failures have occurred follow-ing recent extreme rainfall events. The relationship devel-oped in Eq. (3) considered long-term sediment
accumula-tions in the dams (averaged over 15–20 years). Therefore, when the sediment yield records were averaged over time, dams with recently outsized sediment accumulations eventu-ally produced atypical average sediment yield values. There-fore, by averaging the values with a set of future sediment yield records over a wider time scale would match the sed-iment yield records of the five dams with the developed re-gression relationship. When the results of the 5 dams with excessive sediment accumulation were disregarded, the sedi-ment yields calculated from the model indicated good agree-ment with the observed sediagree-ment loads in the other 39 dams, with a determinacy coefficient of 0.74. This confirms that the relationship developed between the probability of slope fail-ure and sediment yield can be successfully applied in long-term studies of climate change impact predictions.
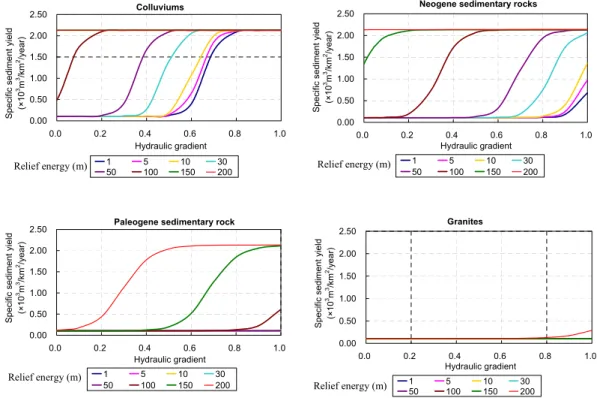
The sensitivity of the sediment yield model to the trigger-ing parameters was also tested. Figure 4 shows the vari-ations in sediment yield with relief energy and hydraulic gradient for four selected geological formations. Simi-lar to the slope failure probability, the sediment yield po-tential is highest in colluviums and decreases in the or-der of Neogene sedimentary rocks and Paleogene sedimen-tary rocks to the lowest potential in granites. As an ex-ample, for a unit change in the hydraulic gradient, colluvi-ums formations produce 12.2×10³m3/km2/year of sediment yield, which is 94% higher than the sediment yield produc-tion of granites under the same condiproduc-tions. Similarly, Neo-gene sedimentary rock and PaleoNeo-gene sedimentary rock pro-duce 8.6×10³m3/km2/year and 6.5×10³m3/km2/year of sediment load for a unit change in the hydraulic gradient, respectively.
Figure 4 also reveals an important aspect that would be critical under changing climate conditions. The hydraulic gradient is a rainfall-sensitive parameter that can be signif-icantly elevated with an increase in the intensity and fre-quency of rainfall with climate change effects. According to Fig. 4, the rate of change of the sediment yield (gradi-ent of the curve) is more sensitive to a small change in the hydraulic gradient, especially within the rising limb of the curve (e.g., 12.2×10³m3/km2/year per unit change of hy-draulic gradient for colluvium formations). Therefore, areas that will cross the lower edge of the rising limb in the fu-ture may have a critical impact on the sediment yield under changing climate conditions.
3.2 Spatial variability of sediment yield
1 2 3 4 5 6 7 8 9 10 11 12 Colluviums 0.00 0.50 1.00 1.50 2.00 2.50
0.0 0.2 0.4 0.6 0.8 1.0
Hydraulic gradient Sp ecif ic s edime nt y ield (×10 3m 3/km 2/ye a r)
1 5 10 30 50 100 150 200 Relief energy
Paleogene sedimentary rock
0.00 0.50 1.00 1.50 2.00 2.50
0.0 0.2 0.4 0.6 0.8 1.0
Hydraulic gradient Spe c ific s edim e n t yiel d (× 10 3m 3/km 2/yea r)
1 5 10 30 50 100 150 200 Relief energy
Neogene sedimentary rocks
0.00 0.50 1.00 1.50 2.00 2.50
0.0 0.2 0.4 0.6 0.8 1.0
Hydraulic gradient Sp ecific sedi me nt yie ld (× 10 3m 3/km 2/ye a r)
1 5 10 30 50 100 150 200 Relief energy Granites 0.00 0.50 1.00 1.50 2.00 2.50
0.0 0.2 0.4 0.6 0.8 1.0
Hydraulic gradient Spec if ic sediment yie ld (×10 3m 3/k m 2/y ear )
1 5 10 30 50 100 150 200 Relief energy
Relief energy (m)
Relief energy (m) Relief energy (m) Relief energy (m)
Fig. 4.Sensitivity of specific sediment yield to the triggering parameters.
average sediment yield based on the different basins. Ar-eas with significantly higher specific sediment yields (over 2000 m3/km2/year) are distributed throughout the Tenryu, Ooi and Kiso river basins in the Hokuriku and Tokai regions and the Shimanto and Naka river basins in the Shikoku re-gion. The lithology and relief energy differences between the various regions may play an important role in producing sediment yield (Fig. 4). As an example, the greater yields corresponding to the Yoshino river basin in the Tokai region consists of 40% colluviums and 27% Neogene sedimentary rock formations, whose soils have a low resistance to the sed-iment yield, while granites with high resistance to the sedi-ment yield cover only 1% of the area. Moreover, the To-hoku and Hokuriku mountain seaside regions with compara-tively high relief energy have a significantly higher specific sediment yield (spatial average of 600–800 m3/km2/year in Fig. 5b) as compared to areas with low relief energy, such as the eastern side of the Kanto region.
3.3 Sediment yield distribution under changing climate
conditions
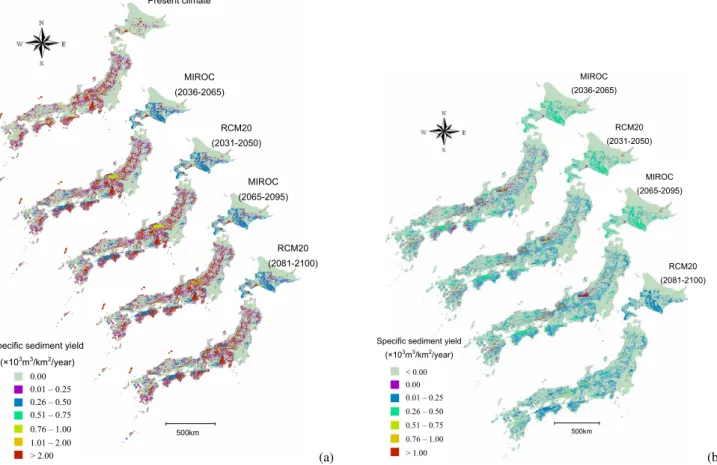
Two climate change scenarios applied to two time periods in the future produced four sets of results to demonstrate the transition of the sediment yield with climate change ef-fects (Fig. 6). In general, all of the figures indicate several common areas with significant sediment yield changes in the future, even though the magnitudes are somewhat
differ-ent. Above all, substantial specific sediment yield changes (over 1000 m3/km2/year) were estimated along the moun-tain areas in the Hokuriku and Kinki regions. The south-ern Shikoku region was also predicted to have a significant specific sediment yield change, although it varies in the dif-ferent figures (250 to over 1000 m3/km2/year). Second only
to the above areas, the southern Hokkaido region was pre-dicted to have a specific sediment yield increase in the in-terval between 250 and 500 m3/km2/year in three estima-tions out of four: for MIROC in intermediate and future climate and MRI-RCM20 in the intermediate climate, while MRI-RCM20 predicted an increase in the interval between 0 and 250 m3/km2/year. Moreover, some areas in the To-hoku region may move from the 0- to 250-m3/km2/year cate-gory to the 250- to 500-m3/km2/year specific sediment yield category. In contrast, for the northern Hokkaido, northern Kyushu and Kanto regions, the model does not predict a sig-nificant sediment yield difference in the future.
Specific sediment yield
(×103m3/km2/year)
0.00
0.01 – 0.25
0.26 – 0.50
0.51 – 0.75
0.76 – 1.00
1.01 – 2.00
> 2.00
500km
(a)
Specific sediment yield
(×103m3/km2/year)
Toyo Kiso
Tenruy & Ooi Yoshino
Naka Shimanto
0.2 – 0.4
0.4 – 0.6
0.6 – 0.8 0.8 – 1.0
> 1.0 0 – 0.2
500km
(b)
Fig. 5.Spatial distribution of specific sediment yield:(a)at a 1-km grid resolution,(b)averaged to the basin scale.
phenomenon can be observed in extreme rainfall changes in the future, where the MIROC intermediate and future cli-mates and the MRI-RCM20 intermediate climate predicted an average extreme rainfall increase of 28%, while the MRI-RCM20 future estimations gave an only 8% extreme rainfall increase. Out of 105 river basins that cover the whole area of Japan, the model predicted an approximately constant or decreasing trend of sediment yield for only 9 river bains in future as compared to the present estimations. The average percentage of the sediment yield reduction in these nine river basins was less than 10%, suggesting that almost all of the river basins in Japan will suffer from an increasing sediment yield risk in the future. For 15 river basins, the model pre-dicted a more than 50% sediment yield increment in the fu-ture (for at least three out of four estimations in the fufu-ture), and among them, 5 river basins will experience a more than 90% change as compared to the present sediment yield.
When looking at the spatially averaged sediment yield over the whole country, both model scenarios predicted an in-creasing trend for the intermediate climate (Fig. 7), implying a potential impact in the first half of the 21st century. With re-spect to four future estimations for 105 river basins, the MRI-RCM20 future climate, however, predicted a higher sediment yield than the other three estimations for only 8 river basins. Therefore, for the future climate, the MRI-RCM20 scenario predicted a small decreasing trend as compared to the inter-mediate climate, while the MIROC scenario predicted a con-tinuously increasing trend. These changes were mainly at-tributed to variations in extreme rainfall events in the future and were also influenced by the geology and relief energy of each individual basin.
The estimates for the total sediment yield at the river basin scale during extreme rainfall events in the future make it easy to identify the hazard-prone areas under a changing climate conditions. By referring to our results, decision-makers can narrow down the area of interest to the specific local scales, and proper mitigation measures can be implemented with support of the respective local authorities. The errors of the model predictions that could not explain the variations of the observed sediment yield can also be attributed to the land-use-change-induced sediment yield at the very local scale. Although many studies have documented sediment yields caused by anthropogenic influences (Asselman et al., 2003; Philip et al., 2009), it is quite difficult to incorporate them into a probabilistic model in regional-scale analysis. There-fore, the inclusion of more detailed information on land use and sub-basin watershed characteristics in site-specific ap-proaches should provide more accurate predictions. After identifying the hazard-prone basins as done in this study, such a detailed analysis would be appropriate for designing infrastructure facilities for mitigating future climate change impacts.
4 Conclusions
a)
Present climate
MIROC
(2036-2065)
RCM20 (2031-2050)
MIROC (2065-2095)
RCM20 (2081-2100)
Specific sediment yield
(×103m3/km2/year)
500km 0.00
0.01 – 0.25 0.26 – 0.50 0.51 – 0.75
0.76 – 1.00 1.01 – 2.00
> 2.00 (a)
2
3
4
5
6
7
8
9
10
11
12
13
14
15
16
17
18
19
20
21
22
23
Specific sediment yield
(×103
m3
/km2
/year)
MIROC
(2036-2065)
RCM20
(2031-2050)
MIROC (2065-2095)
RCM20
(2081-2100)
500km
< 0.00 0.00
0.01 – 0.25 0.26 – 0.50
0.51 – 0.75
0.76 – 1.00
> 1.00 (b)
Fig. 6. Specific sediment yield distribution under a changing climate: (a)specific sediment yield for different climate change scenarios, (b)specific sediment yield change as compared to the present climate.
geology type representing the hydro-climate (hydrology and extreme rainfall), topography and geological effects, respec-tively, were considered in developing the probabilistic model for slope failure. The relationship between the slope failure and subsequent sediment yield was developed by matching the annual average sediment yield observations at 59 dams throughout Japan with the average probability of slope fail-ure hazard in the representative catchment areas. For the pre-dictions of climate change impacts, two climate model sce-narios, MRI-RCM20 A2 and MIROC A1B, in two time pe-riods (intermediate climate and future climate) in the future were incorporated.
The results show that extreme sedimentation events have a high probability of occurring every 5–7 years. The verified results of the developed slope failure-sediment yield relation-ship demonstrated that the model is effective and useful in estimating the sediment yield attributed to extreme-rainfall-induced slope failure (with a determinacy coefficient equal to 0.74). The sensitivity analysis of the model showed that the sediment yield potential was highest in colluviums and decreased in the order of Neogene sedimentary rocks and Pa-leogene sedimentary rocks to the lowest potential in granites. Moreover, it is known that the hydraulic gradient is more in-fluential than the relief energy.
The results of the GCM scenarios predict that the sedi-ment yield impact will increase in the future. When the spa-tial average sediment yield for all of Japan is considered, both scenarios produced an approximately 16–17% and 14– 21% increase around the first half and second half of the 21st century, respectively as compared to the present cli-mate. On the regional scale, substantially higher sediment yield changes (over 1000 m3/km2/year) were estimated in the Hokuriku, Kinki and Shikoku regions. The southern Hokkaido region is predicted to experience a moderate sed-iment yield increase (250–500 m3/km2/year), while the To-hoku region is predicted to have a 0- to 250-m3/km2/year in-crease in sediment yield. Due to variations in extreme rainfall events, the sediment yield estimations at the basin scale pre-dicted changes of different magnitudes. Out of 105 basins in Japan, 96 showed an increasing trend of sediment yield under changing climate conditions. Among them, five river basins will experience a more than 90% change as compared to the present sediment yield.
0.200 0.234
0.243
0.200
0.237
0.228
0.15 0.20 0.25 0.30
Present climate Intermediate climate Future climate
Sp
ec
ific
s
ed
im
en
t y
ie
ld
(×
10
3m 3/k
m
2/y
ea
r) MIROC MRI-RCM20
Fig. 7.Spatially averaged specific sediment yield in Japan accord-ing to different climate change scenarios.
identification of the basins that are prone to sedimenta-tion hazards under changing climate condisedimenta-tions can guide decision-makers in preparing and implementing appropriate mitigation measures to cope with the impacts.
Acknowledgements. This work was supported by the Environment Research and Technology Development Fund (S-8) of the Ministry of the Environment and Grants-in-Aid for Scientific Research, Japan. The sedimentation data was provided by the Japan Water Agency (JWA) and the Ministry of Land Infrastructure, Transport and Tourism (MLIT) in Japan.
Edited by: M. Mikos
References
Asselman, N. E. M., Middlekoop, H., and Dijk, P. M.: The impact of changes in climate and land use on soil erosion, transport and deposition of suspended sediment in the River Rhine, Hydrol. Process., 17, 3225–3244, 2003.
Bathurst, J. C.: Physically-based erosion and sediment yield mod-elling: the SHETRAN concept. Modelling Erosion, Sediment Transport and Sediment Yield, Technical Documents in Hydrol-ogy, 60, UNESCO, 2002.
Bemporad, G. A., Alterach, J., Amighetti, F. F., Peviani, M., and Saccardo, I.: A distributed approach for sediment yield evalua-tion in Alpine regions, J. Hydrol., 197, 370–392, 1997.
Borga, M., Fontana, G. D., and Cazorzi, F.: Analysis of topographic and climatic control on rainfall-triggered shallow landsliding us-ing a quasi-dynamic wetness index, J. Hydrol., 268, 56–71, 2002. Buytaert, W., Celleri, R., Willems, P., Bievre, B. D., and Wyseure, G.: Spatial and temporal rainfall variability in mountainous ar-eas: A case study from the south Ecuadorian Andes, J. Hydrol., 329, 413–421, 2006.
Cheng, J. D., Huang, Y. C., Wu, H. L., Yeh, J. L., and Chang, C. H.: Hydrometeorological and landuse attributes of debris flows and debris floods during typhoon, Toraji, July 29–30, 2001 in Central Taiwan, J. Hydrol., 306, 161–173, 2005.
Chow, V. T., Maidment, D. R., and Mays, L. W.: Appl. Hydrol., McGraw-Hill, Singapore, 1988.
Climate change monitoring report: Japan Meteorological Agency, 2004.
Climate change monitoring report: Japan Meteorological Agency, 2005.
Crosta, G. B. and Frattini, P.: Rainfall-induced landslides and debris flows, Hydrol. Process., 22, 473–477, 2008.
Dai, F. C., Lee, C. F., Li, J., and Xu, Z. W.: Assessment of landslide susceptibility on the natural terrain of Lantau Island, Hong Kong, Environ. Geol., 40, 381–391, 2001.
Fowler, H. J., Ekstrom, M., Kilsby, C. G., and Jones, P. D.: New estimates of future changes in extreme rainfall across the UK us-ing regional climate model integrations. 1. Assessment of control climate, J. Hydrol., 300, 212–233, 2005.
GERF S-4 project document: Global warming impacts on Japan, latest scientific findings. The report for the comprehensive as-sessment of climate change impacts to determine the dangerous level of global warming and appropriate stabilization target of atmospheric GHG concentration, 2008.
Gunawardhana, L. N. and Kazama, S.: A use of global climate model output for site-specific assessment of climate change im-pacts on groundwater temperature, in: Trends and Sustainability of Groundwater in Highly Stressed Aquifers, 329, IAHS Publi-cations, Wallingford, UK, 264–276, 2009a.
Gunawardhana, L. N. and Kazama, S.: Tidal effects on aquifer ther-mal regime: An analytical solution for coastal ecosystem man-agement, J. Hydrol., 377, 377–390, 2009b.
Guzzetti, F., Reichenbach, P., Cardinali, M., Galli, M., and Ardiz-zone, F.: Probabilistic landslide hazard assessment at the basin scale, Geomorphology, 72, 272–299, 2005.
Hasegawa, K., Wakamatsu, K., and Matsuoka M.: Mapping of potential erosion-rate evaluated from reservoir sedimentation in Japan, Journal of Natural Disaster Science, 24, 287–301, 2005. Helsen, M. M., Koop, P. J. M., and Steijn, H. V.:
Magnitude-frequency relationship for debris flows on the fan of the Chalance Torrent, Valgaudemar (French Alps), Landforms, 27, 1299– 1307, 2002.
Hungr, O., McDougall, S., Wise, M., and Cullen, M.: Magnitude – frequency relationships of debris flows and debris avalanches in relation to slope relief, Geomorphology, 96, 355–365, 2008. Hutchinson, J. N.: Landslide hazard assessment, in: Landslides,
edited by: Bell, D. H., 1805–1841, 1995.
IADB (Inter-American Development Bank): Social Protection for Equity and Growth. Johns Hopkins University Press, Baltimore, 2000.
Iizumi, T., Nishimori, M., and Yokozawa, M.: Combined equations for estimating global solar radiation: Projection of radiation field over Japan under global warming condition by statistical down-scaling, Journal of Agricultural Meteorology, 64, 9–23, 2008. Iwashima, T. and Yamamoto, R.: A statistical analysis of the
ex-treme events: long-term trend of heavy daily rainfall, Journal of the Meteorological Society of Japan, 71, 637–640, 1993. Japanese Meteorological Business Support Center: http://www.
jmbsc.or.jp/index.html, 2002.
Jones, P. D. and Reid, P. A.: Assessing future changes in extreme rainfall over Britain using regional climate model integrations, Int. J. Climatology, 21, 1337–1356, 2001.
frequency of heavy rainfall over Japan for 100 years, Proceedings of the 2003 spring meeting of the MSJ, 484, 2003 (in Japanese). Kawagoe, S., Kazama, S., and Sarukkalige, P. R.: Probabilistic modelling of rainfall induced landslide hazard assessment, Hy-drol. Earth Syst. Sci., 14, 1047–1061, doi:10.5194/hess-14-1047-2010, 2010.
Kunkel, K. E., Pielke, R. A., and Changnon, S. A.: Temporal fluctu-ations in weather and climate extremes that cause economic and human health impacts: A review, Bull. Amer. Meteor. Soc., 80, 1077–1098, 1999.
Lookingbill, T. R. and Urban, D. L.: Spatial estimation of air tem-perature differences for landscape-scale studies in montane envi-ronments, Agric. For. Met., 114, 141–151, 2003.
Maoa, L., Cavalli, M., Comiti, F., Marchi, L., Lenzi, M. A., and Arattano, M.: Sediment transfer processes in two Alpine catch-ments of contrasting morphological settings, Journal of Hydrol-ogy, 364, 88–98, 2009.
Marchi, L., Arattano, M., and Deganutti, A. M.: Ten years of debris-flow monitoring in the Moscardo Torrent (Italian Alps), Geomor-phology, 46, 1–17, 2002.
National-land information data: Ministry of Land, Infrastructure, Transport and Tourism, http://nlftp.mlit.go.jp/ksj/, 2001. Palmer, T. N. and Raisanen, J.: Quantifying the risk of extreme
sea-sonal rainfall events in a a changing climate, Nature, 415, 512– 514, 2002.
Parry, M., Canziani, O., Palutikof, J., Linden, P.V., and Hanson, C.: Climate change 2007: Impacts, Adaptation and Vulnerability. Summary for policymakers, Cambridge University Press: New York; 11, 2007.
Philip, J. W., Balen, R. T., Verstraeten, G., Renssen, H., and Van-denberghe, J.: The impact of land use and climate change on late Holocene and future suspended sediment yield of the Meuse catchment, Geomorphology, 103, 389–400, 2009.
Restrepo, J., Kjerfe, B., and Hermelin, M.: Factors controlling sed-iment yield in a major South American drainage basin: the Mag-dalena River, Colombia, J. Hydrol., 316, 213–232, 2006.
Sakamoto, H.: Engineer for Dams, http://jglobal.jst.go.jp/detail. php?JGLOBAL ID=200902243241683992\&q=%E5%9D% 82%E6%9C%AC%E3%80%80%E7%9C%9F%E5%90%8D% E5%B7%9D\&t=0, 2008.
Salathe, Jr. E. P., Mote, P. W., and Wiley, M. W.: Review of scenario selection and downscaling methods for the assessment of climate change impacts on hydrology in the United States Pacific North-west, Int. J. Climatology, 27, 1611–1621, 2007.
Shou, K., Chen, Y., and Liu, H.: Hazard analysis of Li-shan land-slide in Taiwan, Geomorphology, 103, 143–153, 2009.
Suzuki, H.: Trend in the frequency of heavy rainfall events during the last half century over Japan, Tenki, 51, 805–816, 2004 (in Japanese).
Temesgen, B., Mohammed, M. U., and Korme, T.: Natural Haz-ard Assessment Using GIS and Remote Sensing Methods, with Particular Reference to the Landslides in the Wondogenet Area, Ethiopia, Phys. Chem. Earth (C), 26, 665–615, 2001.
Ueyama, H.: Estimation of air temperature distribution in Kamo-gawa by means of a stepwise multiple regression analysis using 50 m mesh topographical data, JASS 20, 53–63, 2004.
Waters, T. F.: Sediments in Streams: Sources, Biological Effects and Control, American Fisheries Society Monograph 7, 1995. Westen, C. J., Rengers, N., and Soeters, R.: Use of
geomorpholog-ical information in indirect landslide susceptibility assessment, Natural Hazards, 30, 399–419, 2003.
Westen, C. J., Seijmonsbergen, A. C., and Mantovani, F.: Compar-ing landslide hazard maps, Natural Hazards, 20, 137–158, 1999. Wicks, J. M. and Bathurst, J. C.: SHESED: a physically based, distributed erosion and sediment yield component for the SHE hydrological modelling system, J. Hydrol., 175, 213-238, 1996. Yilmazer, I., Yilmazer, O., and Sarac, C.: Case history of
control-ling a major landslide at Karandu, Turkey, Eng. Geology., 70, 47–53, 2007.