EYE TRACKING TO EXPLORE THE IMPACTS OF PHOTOREALISTIC 3D
REPRESENTATIONS IN PEDSTRIAN NAVIGATION PERFORMANCE
Weihua Dong a,*, Hua Liaoa
a
State Key Laboratory of Remote Sensing Science, Beijing Key Laboratory for Remote Sensing of Environment
and Digital Cities & School of Geography and Remote Sensing Science, Beijing Normal University, Beijing,
China.dongweihua@bnu.edu.cn
ThS16: Perceptual and cognitive experiments with imagery and 3D models
KEY WORDS:3D photorealism, eye tracking, cognitive workload, pedestrian navigation
ABSTRACT:
Despite the now-ubiquitous two-dimensional (2D) maps, photorealistic three-dimensional (3D) representations of cities (e.g., Google Earth) have gained much attention by scientists and public users as another option. However, there is no consistent evidence on the influences of 3D photorealism on pedestrian navigation. Whether 3D photorealism can communicate cartographic information for navigation with higher effectiveness and efficiency and lower cognitive workload compared to the traditional symbolic 2D maps remains unknown. This study aims to explore whether the photorealistic 3D representation can facilitate processes of map reading and navigation in digital environments using a lab-based eye tracking approach. Here we show the differences of symbolic 2D maps versus photorealistic 3D representations depending on users’ eye-movement and navigation behaviour data. We found that the participants using the 3D representation were less effective, less efficient and were required higher cognitive workload than using the 2D map for map reading. However, participants using the 3D representation performed more efficiently in self-localization and orientation at the complex decision points. The empirical results can be helpful to improve the usability of pedestrian navigation maps in future designs.
* Corresponding author
1. INTRODUCTION
Despite the popularity of 2D maps, 3D Photorealism has long been the interest to present city information and recent technical advances such as oblique photogrammetry technology (Frueh et al. 2004; Wang et al. 2008) make it more popular. Unlike traditional 2D maps that provide an aerial view of the geographic world by flat symbols that vary in shape, colour and label, photorealistic 3D representations (e.g., Google Earth, NASA World Wind) present objects in three dimensions and can thus provide more information. Their textured 3D models can give a sense of reality. Photorealistic imagery is considered be easy to understand because people are familiar with the reality and photographic details support direct visual recognition (Oulasvirta et al. 2009). It is believed that three dimensions provide spatiality which can facilitate physical object identification such as landmark recognition in wayfinding, making it superior to 2D maps for non-expert users (Kray et al. 2003; Plesa and Cartwright 2008; Zanola et al. 2009). However, some studies have shown that realism serves an unimportant role in human interpretation of images because human understanding requires higher levels of abstraction and the abstract information can be completed by human cognitive processes (Duke et al. 2003).
Can 3D photorealism communicate information with higher effectiveness, higher efficiency and lower cognitive workload compared to the traditional symbolic 2D maps? In this paper, we specifically focus on its support for spatial knowledge acquisition for pedestrian navigation. We aim to explore whether the photorealistic 3D representation can facilitate the cognitive processes through the interaction between the user
and the representation (and between the user and the environment). We employed a combination of eye tracking and think-aloud method to collect data. We conducted the experiment using Google Street View as a digital environment to simulate the unfamiliar urban environments in an indoor setting for the first stage of our study, leaving field navigation experiments for follow-up research. The user performance of using photorealistic 3D representations for navigation is compared to those who use symbolic 2D maps qualitatively and quantitatively.
2. BACKGROUND AND RELATED WORK
According to Montello (2005), Human navigation is composed of two components: locomotion, or the physical movement to the near locations, and wayfinding, or the planning, decision making, and execution to the distant and near locations. Wayfinding involves two crucial and closely related tasks: spatial orientation and self-localization. Spatial orientation refers to the process of determining the direction that one is facing in a given spatial reference system (Kiefer et al. 2014). A successful wayfinding requires the wayfinder to maintain correct orientation through the movement and avoid getting lost.
Self-Localization is to determine one’s position using cues from
maps and environment and usually occurs at decision points (Lobben 2004). Landmarks, or the perceptually salient objects or features in the environment that can be easily recognized, are central elements for constituting the mental map of an environment and play a critical role in the process of wayfinding and navigation (Lynch 1960; Presson and Montello 1988; Raubal and Winter 2002). Landmarks can act as anchor points at decision points guiding the movement and provide The International Archives of the Photogrammetry, Remote Sensing and Spatial Information Sciences, Volume XLI-B2, 2016
route confirmation during wayfinding (Sorrows and Hirtle 1999).
Maps and photorealistic 3D representations1. are used as navigation aids by presenting spatial knowledge that cannot be perceived on the ground People can acquire spatial knowledge by reading (cartographic) representations or by actually visiting the environment in a first-person perspective, resulting in a mental map of the environment which stands for the person’s understanding of the reality stored in memory and plays a very important role in wayfinding (Lobben 2004). As the navigator proceeds with a map, the mental map is updated through interactions with the map and the environment. In the process of the information transmission between the environment, user, and the navigational representations, the map representation type influences how the users learn and use the information for spatial inference and decision making (Fabrikant and Lobben 2009).
Recently, using eye tracking for spatial research (e.g., wayfinding) has become an popular research field (e.g., ET4S:
http://www.spatialeyetracking.org/). For examples, Emo (2012) employed lab eye tracking experiment to explore fixation and decision patterns of pedestrians in unfamiliar environment and proposed the “choice zones” based on the space-geometric characteristics of gaze distribution. Wiener et al. (2012) reported an eye tracking study in virtual environments and found that participants biased visual attention on their final path choice. Kiefer et al. (2014) used a mobile eye tracker to explore participants’ map matching strategy for the high-level cognitive process of spatial orientation and self-localization in wayfinding.
3. MATERIALS AND METHODS
3.1 Participants
Twenty participants (six males and fourteen females) aged 21±2 years were recruited. This sample group was deemed appropriate because the participants were not cartography or remote sensing professionals, but they did have experience using modern computing and navigation mapping technology; these characteristics are common to the majority of web map users today. The sample size (N = 20) generally aligns with other eye-tracking studies in Cartography (Cöltekin et al. 2010; Dong et al. 2014; Garlandini and Fabrikant 2009; Ooms et al. 2014). Participants had normal or correct-to-normal vision.
3.2 Apparatus
A Tobii T60 eye tracker (www.tobii.com) with a sample rate of 60Hz and a 22-inch monitor was used in this experiment. The monitor had a screen resolution of 1680 x 1050 pixels to display the map stimuli. Tobii Studio software v. 3.0 was used to
1
While symbolic 2D maps are undoubtedly ‘maps’, photorealistic 3D representations are not necessarily ‘maps’ because they contain little or even no schematization and abstraction which are considered to be essential to maps. But both of them are spatial representations and contain spatial knowledge that can be used as navigation aids. Therefore, in this paper, symbolic 2D maps are referred to as ‘2D maps’ and photorealistic 3D representations are referred to as ‘3D representations. 2D maps and 3D representations together are referred to as ‘navigational representations’.
process the eye-movement data. The software was installed on a desktop computer. Participants could use an additional computer keyboard and mouse for input to complete tasks. A microphone and a camera were connected to the computer to record participants’ voices and faces for post-experiment analysis. All equipment was set up in a dedicated room on the university campus with proper lighting and no disruptions.
3.3 Materials
Considering that conducting eye tracking experiments in the field provides less control of the environment and may encounter technical problems in calibration (Delikostidis 2011; Delikostidis and van Elzakker 2009; Kiefer et al. 2014), we decided to adopt an indoor setting to conduct the experiment. Compared to outdoor environment, indoor settings can provide participants with a silent, distraction-free environment to accomplish tasks.
We use Google Street View2 as a digital environment in which mobile devices are used and pedestrian navigation is performed. Google Street View provides users with panoramic imagery at the street level in hundreds of cities across the world. With 360-degree high-resolution panoramas, navigating in Google Street View can produce a “immersive experience” for users (Anguelov et al., 2010).
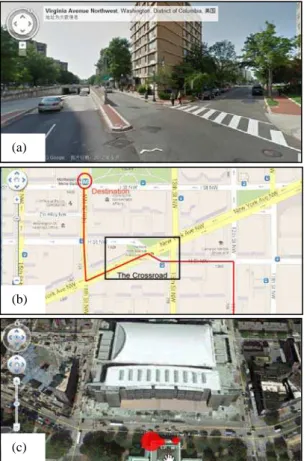
The experimental area was located in Washington DC, USA (Figure 1). None of the participants was familiar with the region. The planned route starts from a metro station located at the intersection of 12th Street NW and G Street NW. The participants were to walk northward along 12th Street to the intersection of H Street NW, then turn left and go to New York Ave NW. At the intersection of 14th Street NW and New York Ave NW, they were to turn right and finally reach the destination, McPherson Square Metro Station, located at the intersection of 14th Street NW and I Street NW.
The test interface was implemented using Google Maps Javascript API3. The navigation map is displayed at 800 pixels’ width and 480 pixels’ height, which corresponds to the screen size of a common 4-inch mobile device. The street view is displayed in full-screen mode to produce an immersive experience when navigating. However, participants can change their view to street view or to the navigational aids as needed.
3.4 Procedure
Participants were divided into two groups with three males and seven females in each group. A between-subject experiment was designed, which means that half of the participants were tested with the photorealistic 3D representation (3D group) and the other were tested with the symbolic 2D map (2D group). The participants were firstly required to complete a questionnaire about their demographic information and experience using navigational maps in daily life. Then the participants were trained by the illustrative interface. An example region was shown on the map. They were given 10-15 minutes to become familiar with the functions and operations of the interface and to experience navigating in the street view
2
Google Street View:
http://maps.google.com/intl/en/help/maps/streetview/
3
Google Maps Javascript API Documentation:
https://developers.google.com/maps/documentation/javascri pt/
with the 2D map and the 3D representation. Instructions and the procedure of the experiment were also introduced.
After finishing the training, a calibration was established to guarantee the recording accuracy of the eye tracker. Next, the participants were required to assume that they were traveling in Washington DC, USA. They should compare the street view and the map and then to determine where they were located. Then the planned route was shown in the navigational map (2D or 3D). The participants were required to read the map carefully and try to memorize necessary information as much as possible. They were instructed that next they would depend on this information to navigate to the destination. When the participants indicated they were ready, they began to walk from the starting point to the destination along the planned route described above. They were told that if they got lost they could change the view back to the map. In the process of the experiment, participants were advised that they should orally describe what they saw, what they thought and any other ideas and questions they had about the current task. Eye-movement data and synchronous audio and video of participants’ faces were recorded. There was no time limit to accomplish the tasks.
Figure 1. Test interface used in the experiment. (a) Google Street View. (b) Google Map of the experiment area. The red
line indicates the planned route. The black box indicates a complicated intersection. (c) Google Earth of the experiment
area.
4. RESULTS
We employ a set of eye movement metrics to evaluate the effectiveness, efficiency, and cognitive workload of the participants’ performance quantitatively. For all of the above quantitative metrics, both descriptive and inferential statistics
were calculated. Two-tailed independent-sample t-tests were applied to each metric to test the significance of the difference between the two groups, with the null hypothesis assuming no difference in these metrics. We divide the analysis into two parts according to the experiment task: map reading and navigation.
4.1 Map reading
The results of the effectiveness, efficiency and cognitive load of map reading is shown in Table 1. It can be seen that both mean Fixation Count and Saccade Count of the 2D group are significantly less than the 3D group (p<0.01), indicating that the 3D representation contain more visual details than the 2D map and thus expose participants to more information, requiring them to encode, and that participants using the 3D representation did much more searching to find necessary information because of its higher visual complexity. The Mouse Event is the number of mouse clicks, including panning, changing view in the 3D representation and clicking map control buttons. The mean Mouse Events of the 2D and 3D group are 11.50 and 85.70, respectively, t=-6.07 (p<0.01), indicating the participants using the 3D representation operated significantly more than the 2D group.
Task Duration, which can be also called response time, is a general indicator of the efficiency of participants’ performance. Participants of the 3D group spent 205.70 seconds on average reading the map, which is significantly longer than 2D map users, who averaged 83.27 seconds (p=0.000).
A longer Fixation Duration either indicates difficulty in interpreting information or means that the participants find the representation more interesting (Just and Carpenter 1976). However, in this paper, the latter explanation is rejected because participants were driven by experimental tasks that left them no free time to find interesting items on the map. Thus, in this study, a longer Fixation Duration indicates that the stimuli required the participants to spend more time to interpret it. Unsurprisingly, the mean Fixation Duration of the 3D group is 119.92 seconds, which is significantly longer than that of the 2D group, 51.53 seconds (p=0.003).
Descriptive Inferential
2D (N=10) 3D (N=10) t-test
mean±st.dev mean±st.dev t p
Effectiveness
Fixation Count 171.60±72.63 423.40±166.73 -4.38 .001
Saccade Count 216.10±99.89 482.70±177.97 -4.13 .001
Mouse Event Count 11.50±6.24 85.70±38.13 -6.07 .000
Efficiency
Task Duration (second) 83.27±28.05 205.70±56.76 -6.12 .000 Fixation Duration
(second) 51.53±31.25 119.92±53.44 -3.49 .003
Cognitive Workload
Mean Pupil Size (mm) 3.32±0.20 3.55±0.33 -1.87 .078 Peak Pupil Dilation
(mm) 3.88±0.28 4.29±0.34 -2.93 .009 (a)
(b)
(c)
Table 1. Descriptive and inferential statistics of effectiveness, efficiency and cognitive load of the 2D and 3D groups during Task #2 (map reading before navigation).
The cognitive workload is measured by Mean Pupil Size and Peak Pupil Dilation, which indicate an overall workload and a local workload of the entire task. The average Mean Pupil Sizes of the 2D and 3D group are 3.32 millimetres and 3.55 millimetres, respectively (p<0.1). The mean Peak Pupil Dilation of the 3D representation is 4.29 millimetres, which is significantly larger than that of the 2D map, 3.88 millimetres (p=0.009). This shows that at times, the 3D representation requires more mental effort to interpret information necessary for the task than the 2D map.
4.2 Navigation
In this section, a complex intersection in that process of the navigation was selected for analysing participants’ performance of decision making. The intersection of New York Ave NW and H St NW (hereinafter referred to as ‘The Crossroad’) is a complex intersection with many branches (see the black box in Figure 1 for the position of The Crossroad).
Some participants of the 2D group had difficulty finding the correct direction. Errors occurred primarily during the process of orientation. As shown in Table 2, participants using the 2D map spent much more time orienting themselves and they also relied on the compass panel on the street view. The mean duration of street view of the 2D group is 124.01 seconds, which is significantly longer than that of the 3D group, 38.23 seconds (p=0.000). Participants using the 2D map confirmed the direction of the road primarily by looking at the compass panel. The mean Fixation Count on the compass panel of the 2D group is 18.10 while that of the 3D group is 3.60 (p=0.055); the mean durations on the compass panel of the 2D and 3D group are 7.45 seconds and 1.13 seconds, respectively (p=0.099).
For participants using the 3D representation, The Centre building was the most frequently used as a landmark for self-localization and orientation. Some participants reported that they recalled The Centre, which they had seen before the navigation. With the help of the building, they went along the path successfully. We can see from Table 2 that the Total Time of the 3D group is 80.88 seconds, which is significantly shorter than that of the 2D group, 143.45 seconds (p=0.037).
Descriptive Inferential
2D (N=10) 3D (N=10) t-test
mean±st.dev mean±st.dev t p
Total Time
(seconds) 143.45±49.62 80.88±72.69 2.25 .037 Duration on the
2D/3D representation (seconds)
19.44±21.54 42.65±54.52 -1.25 .235
Duration on the Street View (seconds)
124.01±53.51 38.23±25.72 4.57 .000
Fixation Count on
the Compass Panel 18.1±20.05 3.6±7.89 2.13 .055 Duration on the
Compass Panel 7.45±10.62 1.13±2.88 1.82 .099
(seconds)
Mean Pupil Size on the Street View (mm)
3.95±0.37 3.67±0.36 1.7 .107
Peak Pupil Dilation on the Street View (mm)
4.93±0.58 4.42±0.63 1.86 .080
Table 2. Descriptive and inferential statistics of the metrics related to the navigation at The Crossroad.
In terms of the cognitive workload, we observed no significant difference of the Mean Pupil Size and Peak Pupil Dilation on the Street View between the two groups though both of the two metrics in the 3D group are less than the 2D group.
There were also participants using the 3D representation who had difficulties orienting themselves, which led to errors. These participants spent an average of 42.65 seconds viewing the map, while this time for the 2D group is 19.44 seconds. However, the difference is not significant (p=0.235). Errors also occurred when one participant incorrectly encoded a building when reading the 3D representation but could not find the corresponding one in the street view.
5. CONCLUSION
This study applied eye-tracking method in a pedestrian navigation experiment investigating the differences of performance using symbolic 2D maps versus photorealistic 3D representation. The experiment was designed and conducted in an indoor setting by employing Google Street View as a virtual environment. Eye-movement metrics were calculated and analysed to evaluate the effectiveness, efficiency and cognitive workload of participants’ self-localization, map reading and memorizing and decision making at complex turning points. Although the materials used in this experiment were from Google Maps, Google Earth and Google Street View, this paper does not intend to concentrate on them but to provide empirical insights to the usability of the now popular 3D photorealism for pedestrian navigation.
Participants using the 3D representation performed less effectively, less efficiently and were required a higher workload than using the 2D map for the cognitive process of spatial knowledge acquisition. This is most probably due to the overloaded information of the 3D photorealistic representation. However, the 3D group performed more efficiently in self-localization and orientation at the complex decision points than did the 2D group. We speculate that the landmark in the 3D model benefitted the process of recalling spatial knowledge from their mental maps for navigation.
The results of the experiment have implications in the design of navigational maps with better usability. Both 2D and 3D representations have advantages and disadvantages. It may be possible to improve the usability of the maps by combining the advantages of each map type. For example, for 3D representations, cartographers can reduce the number of buildings on the screen by only showing important ones to decrease information density; for 2D maps, important landmarks should be included to help the users locate and orient themselves.
ACKNOWLEDGEMENTS
This research is supported by the National Natural Science Foundations of China (NSFC, Grant No. 41471382). Comments from reviewers are appreciated, which helped in the improvement of the article’s quality.
REFERENCES
Cöltekin, A., Fabrikant, S. I. and Lacayo, M. 2010. Exploring the efficiency of users' visual analytics strategies based on sequence analysis of eye movement recordings. International Journal of Geographical
Information Science, 24(10), 1559-1575.
Delikostidis, I., 2011. Improving the usability of pedestrian
navigation systems. Unpublished PhD Dissertation.
University of Twente.
Delikostidis, I. and Van Elzakker, C. P., 2009. Geo-Identification and pedestrian navigation with geo-mobile applications: How do users proceed? In: Gartner, G. and Rehrl, K. eds. Location Based
Services and TeleCartography II. Berlin Heidelberg:
Springer, 185-206.
Dong, W., Liao, H., Roth, R. E. and Wang, S. 2014. Eye tracking to explore the potential of enhanced imagery basemaps in web mapping. The Cartographic Journal, 51(4), 313-329.
Duke, D. J., Barnard, P. J., Halper, N. and Mellin, M., Rendering and affect. In: Brunet, P. and Fellner, D., ed. Computer Graphics Forum, 2003, 359-368. Emo, B., 2012. Wayfinding in real cities: Experiments at street
corners. Spatial Cognition VIII. Springer, 461-477. Fabrikant, S. I. and Lobben, A. 2009. Introduction: Cognitive
issues in geographic information visualization.
Cartographica: The International Journal for Geographic Information and Geovisualization, 44(3),
139-143.
Frueh, C., Sammon, R. and Zakhor, A., Automated texture mapping of 3D city models with oblique aerial imagery. ed. Proceedings of the 2nd International
Symposium on 3D Data Processing, Visualization, and Transmission (3DPVT'04), 2004, 396-403.
Garlandini, S. and Fabrikant, S. I., 2009. Evaluating the effectiveness and efficiency of visual variables for geographic information visualization. Spatial
Information Theory. Berlin Heidelberg: Springer,
195-211.
Kiefer, P., Giannopoulos, I. and Raubal, M. 2014. Where Am I? Investigating map matching during self‐ localization with mobile eye tracking in an urban environment.
Transactions in GIS, 18(5), 660-686.
Kray, C., Elting, C., Laakso, K. and Coors, V., Presenting route instructions on mobile devices. ed. Proceedings of the
8th international conference on Intelligent user interfaces, 2003, 117-124.
Lobben, A. K. 2004. Tasks, strategies, and cognitive processes associated with navigational map reading: A review perspective. The Professional Geographer, 56(2), 270-281.
Lynch, K., 1960. The image of the city. USA: MIT press. Montello, D. R., 2005. Navigation. In: Shah, P. and Miyake, A.
eds. The Cambridge handbook of visuospatial
thinking. New York: Cambridge University Press,
257-294.
Ooms, K., De Maeyer, P. and Fack, V. 2014. Study of the attentive behavior of novice and expert map users using eye tracking. Cartography and Geographic
Information Science, 41(1), 37-54.
Oulasvirta, A., Estlander, S. and Nurminen, A. 2009. Embodied interaction with a 3D versus 2D mobile map.
Personal and Ubiquitous Computing, 13(4), 303-320.
Plesa, M. A. and Cartwright, W., 2008. Evaluating the effectiveness of non-realistic 3D maps for navigation with mobile devices. In: Meng, L., et al. eds.
Map-based mobile services. Berlin Heidelberg: Springer,
80-104.
Presson, C. C. and Montello, D. R. 1988. Points of reference in spatial cognition: Stalking the elusive landmark.
British Journal of Developmental Psychology, 6(4),
378-381.
Raubal, M. and Winter, S., 2002. Enriching wayfinding instructions with local landmarks. In: Egenhofer, M. J. and Mark, D. M. eds. GIScience 2002, LNCS 2478. Berlin Heidelberg: Springer, 243–259.
Sorrows, M. E. and Hirtle, S. C., 1999. The nature of landmarks for real and electronic spaces. Spatial information
theory. Cognitive and computational foundations of geographic information science. Springer, 37-50.
Wang, M., Bai, H. and Hu, F., Automatic texture acquisition for 3D model using oblique aerial images. ed. First
International Conference on Intelligent Networks and Intelligent Systems (ICINIS'08), 2008, 495-498.
Wiener, J. M., Hölscher, C., Büchner, S. and Konieczny, L. 2012. Gaze behaviour during space perception and spatial decision making. Psychological research, 76(6), 713-729.
Zanola, S., Fabrikant, S. I. and Cöltekin, A., The effect of realism on the confidence in spatial data quality in stereoscopic 3D displays. ed. Proceedings of 24th
International Cartography Conference (ICC 2009),
Nov 15-21 2009 Santiago, Chile.