www.biogeosciences.net/9/1173/2012/ doi:10.5194/bg-9-1173-2012
© Author(s) 2012. CC Attribution 3.0 License.
Biogeosciences
The moisture response of soil heterotrophic respiration:
interaction with soil properties
F. E. Moyano1, N. Vasilyeva1, L. Bouckaert2, F. Cook3, J. Craine4, J. Curiel Yuste5, A. Don6, D. Epron7, P. Formanek8, A. Franzluebbers9, U. Ilstedt10, T. K¨atterer11, V. Orchard12, M. Reichstein13, A. Rey5, L. Ruamps1, J.-A. Subke14, I. K. Thomsen15, and C. Chenu1
1CNRS-UPMC-AgroParisTech, UMR Bioemco 7618, 78850 Thiverval-Grignon, France
2Department of soil management and soil care, Ghent University, Ghent, Coupure Links 653, Belgium
3Environmental Physicist/Director, Freeman Cook & Associates, Pty Ltd, P.O. Box 948, Mt Ommaney Q4074, Australia 4Division of Biology, Kansas State University, Manhattan KS 66506-4901, USA
5Museo Nacional de Ciencias Naturales CSIC, Serrano 115 dpdo, 28006 Madrid, Spain
6Johann Heinrich von Th¨unen-Institut, Institut f¨ur Agrarrelevante Klimaforschung, Bundesallee 50,
38116 Braunschweig, Germany
7Nancy-Universit´e, UMR Ecologie et Ecophysiologie Foresti`eres, 54506 Vandoeuvre Les Nancy, France
8Mendel University Brno, Department of Geology and Soil Science, Zemedelska 3, 613 00 Brno, Czech Republic 9USDA – Agricultural Research Service, 1420 Experiment Station Road, Watkinsville GA 30677, USA
10Department of Forest Ecology and Management, SLU, SE-901 83 Ume˚a, USA 11Professor, SLU, Dept. Soil and Environment, P.O. Box 7014, 75007 Uppsala, Sweden 12Strategic Manager, Science and Research, ESR, New Zealand
13Biogeochemical Model-Data Integration Group, Max-Planck Insititute for Biogeochemistry, 07701 Jena, Germany
14University of Stirling, School of Natural Sciences, Biological and Environmental Sciences, Stirling FK9 4LA, Scotland, UK 15Department of Agroecology, Organic Matter, Blichers All´e 20, 8830, Tjele, Denmark
Correspondence to:F. E. Moyano ([email protected])
Received: 21 October 2011 – Published in Biogeosciences Discuss.: 2 December 2011 Revised: 5 February 2012 – Accepted: 12 March 2012 – Published: 28 March 2012
Abstract.Soil moisture is of primary importance for predict-ing the evolution of soil carbon stocks and fluxes, both be-cause it strongly controls organic matter decomposition and because it is predicted to change at global scales in the fol-lowing decades. However, the soil functions used to model the heterotrophic respiration response to moisture have lim-ited empirical support and introduce an uncertainty of at least 4 % in global soil carbon stock predictions by 2100. The ne-cessity of improving the representation of this relationship in models has been highlighted in recent studies. Here we present a data-driven analysis of soil moisturespiration re-lations based on 90 soils. With the use of linear models we show how the relationship between soil heterotrophic res-piration and different measures of soil moisture is consis-tently affected by soil properties. The empirical models de-rived include main effects and moisture interaction effects of soil texture, organic carbon content and bulk density. When
compared to other functions currently used in different soil biogeochemical models, we observe that our results can cor-rect biases and reconcile differences within and between such functions. Ultimately, accurate predictions of the response of soil carbon to future climate scenarios will require the integration of soil-dependent moisture-respiration functions coupled with realistic representations of soil water dynamics.
1 Introduction
2008) and the main driver of soil microbial activity in many ecosystems (Davidson et al., 2000; Jassal et al., 2008; Liu et al., 2009). It is also expected to change significantly at global scales as a result of climate change in the coming decades (IPCC, 2007; Burke and Brown, 2010), potentially leading to large scale changes in soil carbon stocks in different regions, such as the Amazon basin (Falloon et al., 2011).
The relationship between soil moisture and soil respiration is known to be variable. It depends not only on the soil type (Franzluebbers, 1999; Vincent et al., 2006) but also on the di-versity of measures used to express water conditions in soils, each having a unique relationship with soil microbial activity (Ilstedt et al., 2000; Paul et al., 2003). Soil factors including total pore space, bulk density and texture have been shown to influence this relationship (Franzluebbers, 1999; Thomsen et al., 1999). However, such studies have been few with most concentrating on finding the measure of moisture that best predicts respiration rates (e.g. water potential, water-filled pore space, etc.) or the single function that best describes this relationship (e.g. linear, polynomial, etc.). A systematic analysis of variations in response to a wide range of soil types has been lacking.
Soil carbon models use soil moisture-respiration functions that, in theory, represent an average response of microbial respiration to soil moisture content, i.e. they do not account for any possible variation in this relationship (Rodrigo et al., 1997). In addition, these functions are generally developed and validated using soils from specific sites and, as a con-sequence, are not suitable for a wider range of soil types. Accordingly, a few studies indicate that the variability in soil carbon budget predictions related to the use of different moisture-respiration functions can be important (Rodrigo et al., 1997; Bauer et al., 2008; Falloon et al., 2011). Fallon et al. (2011) showed that the divergence in simulations re-lated to the choice of moisture function alone is nearly 4 % of global carbon stocks by 2100. However, since all the com-pared functions still represent an “average” response, the real uncertainty may be larger than reported. A better under-standing of how this relationship actually depends on soil properties will help to quantify and reduce such uncertain-ties (Franzluebbers, 1999; Schjonning et al., 1999; Thomsen et al., 1999).
Here we present results from a meta-analysis of multiple soil incubation datasets that describe how soil properties reg-ulate the relationship between soil microbial respiration and moisture. We use the terms “soil respiration” or simply “res-piration” referring to soil CO2emissions from heterotrophic
microbial activity. The soil respiration response to moisture is the result of several processes – including osmotic stress, diffusion and oxygen limitations – that combined produce a net effect on the rate of carbon decomposition. Conse-quently, we did not look for a function that acts as the best single average predictor, as it would invariably underperform in most soil types. Instead, we treated the respiration re-sponse as a variable that changes freely at different levels
of moisture and is explained by moisture itself and other soil properties.
The main outcome of this analysis is statistical models that predict the proportional response of soil respiration to mois-ture as a soil-type dependent variable. This can then be used to derive relative soil respiration curves for a given soil type. We illustrate the results by comparing the model we derive, using data from soils of England and Wales (Bellamy et al., 2005), with other currently used functions.
2 Materials and methods 2.1 Data processing
Data were assembled from studies where soil carbon diox-ide emissions were measured together with variations in soil moisture under controlled laboratory conditions. Treatments varied across studies (e.g. intact vs. homogenized soils) but only homogenous samples with respect to soil properties were used. Incubations with temperatures outside the 10 to 35◦C range were excluded. Respiration data from incuba-tions where moisture decreased over time were corrected for substrate depletion effects using data from control (constant moisture) samples. Pore space, if not available, was calcu-lated assuming a mineral density of 2.65 and organic matter density of 1.4 (R¨uhlmann et al., 2006). We converted the measures of soil CO2 emissions, moisture and soil
proper-ties to the same units and individually normalized soil res-piration data sets to a 0–1 scale. The latter facilitated data manipulation but did not affect the results since we analyzed the proportional response rather than the absolute changes, as described below.
The resulting database consisted of data from 90 differ-ent soils originating from 42 sites and characterized by a broad range of soil properties (Tables 1 and 2). From this data we obtained a total of 310 respiration-moisture relation-ships by plotting soil respiration from a given soil against related soil moisture data expressed in one or more out of four available measures. These measures are: mass related or gravimetric moisture (θm), volumetric moisture (θv),
frac-tion of water saturafrac-tion (θs), and the logarithm of water
po-tential (ψlog). θm is a laboratory standard whileθv is the
most widely used field measure, often associated with high frequency carbon flux data. θs andψlog are often
consid-ered optimal predictors of microbial respiration as they are related to air space and water energy status respectively (Or-chard and Cook, 1983; Skopp et al., 1990). In order to obtain an approximate range of 0 to 1, convenient for the analysis, the unit used forψlog was (−log10|ψ|kPa)/5 + 1. Those for
the other measures are: g H2O gSoil−1(θm), cm3H2O cm−3
(θv), and cm3 H2O cm−3 pore-space (θs). When possible,
missing moisture measures were derived, e.g. using bulk den-sity or pore space for convertingθvtoθmorθs, respectively,
Table 1.Description of the data used in the analysis. Each line represents a specific site or location. DS is number of data sets, representing different soil types related to each site. Site averages of soil properties used in the analysis are shown. BD = bulk density, SOC = soil organic carbon, N = soil nitrogen.
Reference DS Country Ecosystem BD SOC N Clay Silt Sand pH
(g cm−3) (mg g−1) (mg g−1) (%) (%) (%)
Bouckaert (unpublished data) 3 Belgium Forest 1.6 44 3.5 18 49 33 5.4
Bowden et al. (1998) 1 USA Forest 0.3 NA NA NA NA NA 3.3
Cook (unpublished data) 1 New Zealand Grassland 1.3 64 4.7 16 6 79 5.4
Cook (unpublished data) 1 New Zealand Grassland 0.9 55 5.5 17 33 50 5.7
Cook (unpublished data) 1 New Zealand Grassland 0.8 71 6.2 52 34 14 6.1
Cook et al. (1985) 1 New Zealand Grassland NA NA NA NA NA NA NA
Craine and Gelderman (2011) 8 USA Grassland NA 46 3.3 33 60 8 6.7
Curiel Yuste et al. (2007) 2 USA Forest 0.9 102 3.5 11 29 60 5.5
Curiel Yuste et al. (2007) 2 USA Grassland 1.5 28 2.5 14 44 43 6.4
Don (unpublished data) 1 Germany Grassland 1.5 11 1.1 9 10 81 4.5
Doran (1990) 1 USA Forest 1.1 31 NA 14 16 70 6.8
Doran (1990) 1 USA Cultivated 1.2 14 NA 18 29 53 6.8
Doran (1990) 1 USA Cultivated 1.1 21 NA 22 75 3 6.8
Doran (1990) 1 USA Grassland 1.2 8 NA 26 19 55 6.8
Doran (1990) 1 USA Grassland 1.1 22 NA 17 64 19 6.8
Doran (1990) 1 USA Grassland 1.0 16 NA 46 42 12 6.8
Doran (1990) 1 USA NA 1.1 35 NA 14 37 49 6.8
Doran (1990) 1 USA Cultivated 1.2 13 NA 20 51 29 6.8
Doran (1990) 1 USA Grassland 1.2 7 NA 22 24 54 6.8
Doran (1990) 1 USA Cultivated 1.1 13 NA 58 35 7 6.8
Doran (1990) 1 USA Cultivated 1.1 11 NA 16 68 16 6.8
Skopp et al. (1990) 1 USA Grassland 1.2 13 NA 24 54 22 6.8
Epron (unpublished data) 1 France Forest 0.8 27 2.5 20 66 14 4.6
Formanek (unpublished data) 3 Czech Republic Forest NA 318 11.2 NA NA NA 4.8
Franzluebbers (1999) 15 USA Grassland 1.2 16 1.1 19 16 65 6.2
Gulledge and Schimel (1998) 2 USA Grassland NA 61 NA NA NA NA NA
Ilstedt et al. (2000) 3 Malaysia Forest 0.6 52 4.1 27 32 42 4.7
Ilstedt et al. (2000) 1 Sweden Forest 0.5 556 NA NA NA NA 4.1
Linn and Doran (1984) 1 USA Cultivated NA 21 1.6 34 54 12 5.8
Liu et al. (2009) 1 China Grassland NA 16 1.5 17 20 63 6.8
Lomander et al. (1998) 2 Sweden Cultivated NA 18 1.9 57 38 5 8.2
Nyhan (1976) 1 USA NA 1.4 9 NA NA NA NA 6.8
Orchard and Cook (1983) 1 New Zealand Grassland NA NA NA NA NA NA NA
Orchard et al. (1992) 1 New Zealand Grassland NA 56 3.5 24 NA NA 5.2
Orchard et al. (1992) 1 New Zealand Grassland NA NA NA NA NA NA NA
Reichstein et al. (2005) 1 Germany Forest 0.9 45 2.0 10 38 52 2.9
Rey et al. (2005) 2 Italy Forest 1.0 49 6.0 NA NA NA 5.7
Ruamps (unpublished data) 1 France Cultivated 1.5 14 1.2 17 53 30 6.8
Thomsen et al. (1999) 15 Denmark Cultivated 1.3 15 1.5 23 14 64 6.9
Skopp et al. (1990) 1 USA Cultivated 1.4 9 NA 3 7 90 6.8
Stott et al. (1986) 1 USA Cultivated NA 4 0.6 NA NA NA 7.0
Wickland and Neff (2008) 3 USA Forest NA 318 14.5 NA NA NA NA
The following analysis was performed in parallel for each moisture measure using the R statistical software version 2.13.1 (Supplement: R Code and data files MRD.txt, DD.txt and funs.txt). We started by assuming that a response to a change in soil moisture is proportional to the value of res-piration itself, as normally done in soil carbon models. By using the proportional response we make our results gener-alizable, avoiding the problem of comparing absolute
respi-ration values which vary largely across soils. Since the re-sponse of respiration varies along the moisture axis, we de-fined the Proportional Response of Soil Respiration (PRSR)
related to a 0.01 increase in soil moisture as the central unit for analysis, with the unit of this 0.01 value depending on the moisture measure applied. We then tested how PRSRis
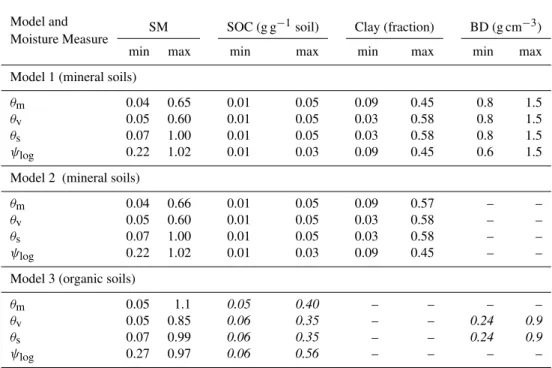
Table 2.Range of values for soil moisture (SM), soil organic carbon (SOC), clay, and bulk density (BD) used to fit linear regression models using different measures of soil moisture. Numbers in italics are for descriptive purposes only since the respective variables were not used in that particular model.θmis gravimetric moisture (g H2O gSoil−1),θvis volumetric moisture (cm3H2O cm−3),θsis relative water saturation
(cm3H2O cm−3pore-space), and9log is water potential [(−log10|9|kPa)/5 + 1].
Model and
Moisture Measure SM SOC (g g
−1soil) Clay (fraction) BD (g cm−3)
min max min max min max min max Model 1 (mineral soils)
θm 0.04 0.65 0.01 0.05 0.09 0.45 0.8 1.5
θv 0.05 0.60 0.01 0.05 0.03 0.58 0.8 1.5
θs 0.07 1.00 0.01 0.05 0.03 0.58 0.8 1.5
ψlog 0.22 1.02 0.01 0.03 0.09 0.45 0.6 1.5
Model 2 (mineral soils)
θm 0.04 0.66 0.01 0.05 0.09 0.57 – –
θv 0.05 0.60 0.01 0.05 0.03 0.58 – –
θs 0.07 1.00 0.01 0.05 0.03 0.58 – –
ψlog 0.22 1.02 0.01 0.03 0.09 0.45 – –
Model 3 (organic soils)
θm 0.05 1.1 0.05 0.40 – – – –
θv 0.05 0.85 0.06 0.35 – – 0.24 0.9
θs 0.07 0.99 0.06 0.35 – – 0.24 0.9
ψlog 0.27 0.97 0.06 0.56 – – – –
To obtain PRSR values we used general additive
mod-els (GAMs) to fit smooth curves to each of the 310 rela-tionships. Linear or polynomial fits were used instead if the number of moisture points in a dataset was less than 4. Respiration values at each 0.01 moisture interval were then predicted from the fitted curves between the minimum and maximum moisture value of each relationship (as to avoid extrapolations). With the resulting set of predicted values, the PRSR of each 0.01 increase in moisture was calculated,
at moisture M, as the average of SR(M)/SR(M-0.01) and SR(M+0.01)/SR(M).
2.2 Regression models
The dependence of PRSRon soil properties was analyzed
us-ing soil pore space, bulk density, soil organic carbon, and sand, silt and clay content. We also tested soil pH and the interaction between organic carbon and clay but found no significant effects. To isolate the effect of each soil property we used linear regression models of the form:
PRSR=β1M+β2M2+β3M3+βiSPi+βiM·SPi+ε (1)
whereMis soil moisture (eitherθm,θv,θsorψlog)and SP are soil properties which can interact withM. Stepwise model selection was applied.
Preliminary results revealed important differences be-tween soils with high and low organic carbon content. Af-ter empirically testing the influence of different soils on the models’ root mean square deviation, we set a threshold of 50 mg C g−1soil, with soils above this value considered
or-ganic for the purpose of this analysis. These soils were analyzed separately from mineral soils.
The PRSR tended to be very large at respiration values
near 0. Such PRSR are related to very low respiration rates
and do not have a large absolute impact, but can still repre-sent a real response. However, our model failed to accurately predict them and, as a consequence, a few of such values pro-duced a strong general bias. To avoid this we excluded any PRSRvalue further than 3 standard deviations from the mean.
Model simplification led to excluding pore space (strongly correlated with BD), sand, silt and the SOC-M interaction. As bulk density is often not available for use in large scale soil simulations, we fitted a second model for mineral soils including only clay and organic carbon. The final linear models predicting PRSRwere:
PRSR=β1M+β2M2+β3M3+β4BD
+β5M·BD+β6clay+β7M·clay+β8SOC (2)
PRSR=β1M+β2M2+β3M3+β4clay
PRSR=β1M+β2M2+β3M3 (4)
whereMis soil moisture, BD is bulk density, SOC is soil or-ganic carbon andβ are model coefficients. Model 1 (Eq. 2) and Model 2 (Eq. 3) are mineral soil models, with the latter excluding bulk density (Table 3). Model 3 (Eq. 4) is for or-ganic soils and has only moisture as a predictor. Few datasets were available for these soils and significant correlations with soil properties were not found (Table 3).
2.3 Soil respiration predictions
With the PRSRvalues obtained from the above models,
res-piration was predicted using the equation: SR(M)=
5Mk=M
0PRSRk
·SR0 (5)
where soil respiration (SR) as a function of soil moisture (M) is equal to an initial respiration value (SR0)multiplied by the
product of all PRSRvalues (denoted by the5symbol) at each
0.01 moisture interval (k)from the initial moisture (M0)to
M (forM0< M; otherwise the product term divides SR0).
PRSRvalues at eachkinterval are predicted with the above
PRSRmodels.
Relative respiration curves, which scale respiration from 0 to 1, were obtained in a two-step calculation: (1) using Eq. (2) to predict PRSRvalues for each 0.01 moisture interval
and (2) using Eq. (5) to calculate respiration values along the moisture axis (with an arbitrary SR0of 1) and dividing all
values by the maximum obtained. As data at low moistures extremes was generally missing, regression models did not well reproduce the high PRSR related to respiration values
approaching 0. As a result, depending on the soil type, curve intercepts were variably higher than 0. To obtain curves with a 0 intercept we applied a rescaling of respiration from 0 to 1 in the range of 0 to optimum moisture. For this, we sub-tracted the minimum respiration value (Rmin)and divided by
1-Rmin(Supplement: R Code lines 463–467). This resulted
in a scaling down that was strongest at lower moisture levels but minimal when approaching optimal moisture.
In order to compare our results with existing functions, we applied Eq. (3) using θs or ψlog to predict respiration
curves for 106 soil series from England and Wales covering an area of ca. 50 000 km2. Soil organic carbon and clay con-tent in these soils ranged between 0.01–0.05 g g−1and 80–
610 g clay kg−1soil. We compared these results with
func-tions from six other models using the same moisture mea-sures, plotting the resulting range of respiration values next toθsfunctions belonging to the RothC (Coleman and Jenkin-son, 1999; Bauer et al., 2008), CANDY (Franko et al., 1995; Powlson et al., 1996), Bethy (Knorr, 2000) and SimCycle (Ito and Oikawa, 2002) models andψlogfunctions from the
Daisy (Abrahamsen and Hansen, 2000; Bauer et al., 2008) and SOILCO2 ( ˇSimunek and Suarez, 1993; Bauer et al., 2008) models. To useθs with the RothC function we
fol-lowed the same procedure as Bauer et al. (2008), assuming
Figu e : P opo tio al espo se of soil i o ial espi atio P‘S‘ to oistu e. P‘S‘ alues
o espo d to a . i ease i soil oistu e. Values a e sho fo all datasets a d fo
g a i et i oistu e, a, olu et i oistu e, , s f a tio of satu atio , , a d log log ate
pote tial, d. U its of soil oistu e i the a is a e: g H O g d soil a, H O total ,
H O po e spa e a d log ||kPa/ + d. G e i les ep ese t the P‘S‘ of ea h .
oistu e i ease. The la k a d dashed li es a e ea a d sta da d de iatio s, espe ti el .
Fig. 1. Proportional response of soil microbial respiration (PRSR)
to moisture. PRSRvalues correspond to a 0.01 increase in soil mois-ture. Values are shown for all datasets and forθm(gravimetric
mois-ture,(a)),θv(volumetric moisture,(b)),θs(fraction of saturation,
(c)), andψlog (log water potential, (d)). Units of soil moisture in the x-axis are: g H2O gSoil−1(a), cm3 H2O cm−3 (b), cm3 H2O cm−3pore-space (c) and (−log10|ψ|kPa)/5+1 (d). Grey cir-cles represent the PRSRof each 0.01 moisture increase. The black and dashed lines are mean and standard deviations, respectively.
that the accumulated total soil moisture deficit equalsθv at
saturation minus actualθvand maximum total soil moisture deficit is equal toθvat saturation.
3 Results
For each dataset, PRSRvalues are highest at dry conditions
and decrease progressively with increasing moisture (Fig. 1), with values below 1 corresponding to a negative trend in respiration rates. Mean PRSR values for θs and ψlog
de-creased monotonically with increasing moisture (Fig. 1c and d) while those forθmandθvshowed more discontinuities
re-lated to sharp variations in soil types (Fig. 1a and b). All moisture measures had a wide range of soil moisture asso-ciated to an optimum for respiration, defined as the point where PRSRcrosses 1. Takingθs as an example, the PRSR
mean value reaches 1 at 0.63θs, consistent with the
com-monly reported range of 0.6–0.7, but different datasets had values of optimum moisture as low as 0.4 and as high as 0.9 water saturation.
For mineral soils, significant correlations were found be-tween PRSR and all soil properties, with the correlation
strength and significance being strongly dependent on the moisture range and type of moisture measure (Fig. 2). With θmandθv, correlation coefficients of PRSRversus bulk
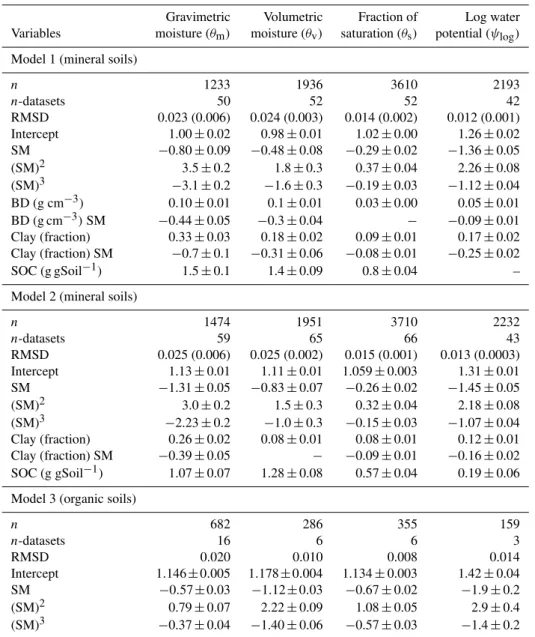
Table 3.Variables and coefficients for linear models predicting the proportional response of soil respiration (PRSR) at 0.01 moisture intervals. SM = soil moisture, BD = bulk density, SOC = soil organic carbon. Coefficient values and standard errors are given under the corresponding moisture measure. All terms are significant atp <0.001. In addition, values are given for the number of data points (n) and datasets used, and the model root mean square deviation (RMSD) with the improvement relative to a moisture-only fit in brackets.
Gravimetric Volumetric Fraction of Log water Variables moisture (θm) moisture (θv) saturation (θs) potential (ψlog)
Model 1 (mineral soils)
n 1233 1936 3610 2193
n-datasets 50 52 52 42
RMSD 0.023 (0.006) 0.024 (0.003) 0.014 (0.002) 0.012 (0.001) Intercept 1.00±0.02 0.98±0.01 1.02±0.00 1.26±0.02 SM −0.80±0.09 −0.48±0.08 −0.29±0.02 −1.36±0.05 (SM)2 3.5±0.2 1.8±0.3 0.37±0.04 2.26±0.08 (SM)3 −3.1±0.2 −1.6±0.3 −0.19±0.03 −1.12±0.04 BD (g cm−3) 0.10±0.01 0.1±0.01 0.03±0.00 0.05±0.01 BD (g cm−3)SM −0.44±0.05 −0.3±0.04 − −0.09±0.01 Clay (fraction) 0.33±0.03 0.18±0.02 0.09±0.01 0.17±0.02 Clay (fraction) SM −0.7±0.1 −0.31±0.06 −0.08±0.01 −0.25±0.02 SOC (g gSoil−1) 1.5±0.1 1.4±0.09 0.8±0.04 – Model 2 (mineral soils)
n 1474 1951 3710 2232
n-datasets 59 65 66 43
RMSD 0.025 (0.006) 0.025 (0.002) 0.015 (0.001) 0.013 (0.0003) Intercept 1.13±0.01 1.11±0.01 1.059±0.003 1.31±0.01 SM −1.31±0.05 −0.83±0.07 −0.26±0.02 −1.45±0.05 (SM)2 3.0±0.2 1.5±0.3 0.32±0.04 2.18±0.08 (SM)3 −2.23±0.2 −1.0±0.3 −0.15±0.03 −1.07±0.04 Clay (fraction) 0.26±0.02 0.08±0.01 0.08±0.01 0.12±0.01 Clay (fraction) SM −0.39±0.05 − −0.09±0.01 −0.16±0.02 SOC (g gSoil−1) 1.07±0.07 1.28±0.08 0.57±0.04 0.19±0.06 Model 3 (organic soils)
n 682 286 355 159
n-datasets 16 6 6 3
RMSD 0.020 0.010 0.008 0.014
Intercept 1.146±0.005 1.178±0.004 1.134±0.003 1.42±0.04 SM −0.57±0.03 −1.12±0.03 −0.67±0.02 −1.9±0.2 (SM)2 0.79±0.07 2.22±0.09 1.08±0.05 2.9±0.4 (SM)3 −0.37±0.04 −1.40±0.06 −0.57±0.03 −1.4±0.2
significant correlations of these properties were seen forθs
andψlog.
Significant PRSRcorrelations with texture and organic
car-bon were found for all moisture measures but most impor-tantly forθmandθv. Correlations were generally negative
for sand and positive for clay, silt and organic carbon. Corre-lations with clay and silt followed a similar pattern that mir-rored the behavior of sand. Correlations with organic carbon content were similar to those of clay and silt. In contrast, or-ganic soils showed no significant correlations between PRSR
and carbon content (data not shown).
The range of values used for fitting the multiple linear re-gression models is given in Table 2. Models usingθm and
θvshowed the largest improvement in their root mean square
deviation (RMSD) after adding soil properties to the basic moisture polynomial. However, the much lower RMSD val-ues of the models usingθs andψlog, which only decreased
slightly after adding soil properties, show that they are bet-ter predictors, withψloghaving a slightly better performance
Figu e : The espi atio espo se to oistu e P‘S‘ o elated ith soil p ope ties of i e al soils.
Co elatio oeffi ie ts of P‘S‘ s. ulk de sit la k i les , o ga i a o g ee s ua es , sa d
ello i e ted t ia gles , silt o t ia gles a d la ed dia o ds o the a is a e sho fo
diffe e t le els of soil oistu e SM o the a is. Full s ols de ote o elatio s sig ifi a t at
p< . . U its of soil oistu e i the a is a e: g H O g d soil a, H O total , H O
po e spa e a d [ log ||kPa]/ + d.
Fig. 2.The respiration response to moisture (PRSR)correlated with soil properties of mineral soils. Correlation coefficients of PRSR vs. bulk density (black circles), organic carbon (green squares), sand (yellow inverted triangles), silt (brown triangles) and clay (red diamonds) on the y-axis are shown for different levels of soil mois-ture (SM) on the x-axis. Full symbols denote correlations signifi-cant atp <0.05. Units of soil moisture in the x-axis are: g H2O gSoil−1(a), cm3H2O cm−3(b), cm3H2O cm−3pore-space (c) and [-log10|ψ|kPa]/5 + 1 (d).
of observations, one reason whyR2values were not used to compare them.
Relative respiration curves are shown in Fig. 3. The effect of clay content on respiration was mainly at low (aerobic) moisture ranges and strongly affected the spread in the curve. Less clay resulted in a wider range of soil moisture values as-sociated to optimal respiration and a respiration peak at lower water contents. Soil organic carbon produced a shift in the curve under all moisture measures with the exception of wa-ter potential. More carbon content did not affect the spread of the curve but drove the point of maximum respiration to-wards higher values of moisture. With changes in bulk den-sity, respiration changed relatively little for a constant volu-metric moisture (θvcurve) or water potential (ψlogcurve) but
changed strongly under a constant gravimetric moisture (θm
curve) or water saturation fraction (θscurve).
When compared to currently used models (Fig. 4), results from our model covered much of the range of variability between other functions based on θs, which either
under-or overestimate average respiration, with a strong tendency towards the latter. Functions using ψlog were comparable to our predictions, where we observed a limited influence of soil properties, but they showed a general overestima-tion of respiraoverestima-tion values in most of the range of suboptimal moisture conditions.
Figu e : The espo se of p edi ted soil oistu e espi atio u es to a iatio s i soil p ope ties
fo i e al soils. Da ke li es ep ese t highe alues of a gi e p ope t . Va iatio s a e sho fo
la o te t f o . to f a tio a d,o ga i a o f o . to . g g e h, a d ulk
de sit f o . to . g i l. The espe ti e alues fo the a ia les held o sta t a e: .
f a tio , . g g a d . g . Moistu e u its a e: g H O g d soil a,e,i, H O total
,f,j, H O po e spa e ,g,k, a d log ||kPa d,f,l.
Fig. 3.The response of predicted soil moisture-respiration curves to variations in soil properties for mineral soils. Darker lines represent higher values of a given property. Variations are shown for clay content from 0.1 to 1 fraction (a–d), organic carbon from 0.005 to 0.05 g g−1(e–h), and bulk density from 0.6 to 1.6 g cm−3(i–l). The respective values for the variables held constant are: 0.3 fraction, 0.02 g g−1and 1.2 g cm−3. Moisture units are: g H2O gSoil−1(a,
e,i), cm3H2O cm−3(b,f,j), cm3H2O cm−3pore-space (c,g,k), and−log10|ψ|kPa(d,f,l).
Fig. 4. Comparison of predicted relative soil heterotrophic respi-ration as a function of soil moisture. The grey area marks the full range of values obtained with Eqs. (3) and (5) usingθs(a)orψlog
(b)for 106 soil series from England and Wales ranging from 8 to 50 mg g−1 SOC and 0.08 to 0.61 clay fraction. Other lines are moisture-respiration functions from existing models using eitherθs
(a)orψlog(b)as a predictor.(a): CANDY model (full line), Bethy model (dashed line), SimCycle model (dotted line), RothC model (dot-dash line). (b): Daisy model (full line), SOILCO2 model (dashed line).
4 Discussion
reflects differences between ecosystems that are largely ig-nored in the more common and simplified representations of this relationship. A major difference observed was in the re-sponse of organic vs. mineral soils. In the case of organic soils we found little or no effects of soil properties on the PRSR. The models derived for organic soils use moisture as
the only predictor. It is evident that, with a generally lower bulk density and mineral fraction, the influence of oxygena-tion and clay content become less important. These mod-els serve as a best approximation, but remain rough averages given the limited availability of data and the often incomplete characterization of soil properties. More data of well char-acterized soils will be needed to better understand moisture effects in these soils.
For mineral soils (with less than 50 mg C g soil−1)the soil
factors having an influence on the moisture-respiration rela-tionship involved aeration and structure (bulk density), tex-ture (clay) and composition (carbon content). The models we derived from the data include clay but not silt or sand. This was a result of the large effect of clay and the relatively small influence of silt or sand when including one or the other in the linear regression. This is probably caused by the much larger specific surface area of clay which affects water re-tention and availability. The increase in the optimum water content for respiration with increasing clay fraction we ob-served has also been identified in field studies (Balogh et al., 2011). Water potential is the only measure of soil moisture for which this pattern was not observed.
Biological and physical theory predicts that microbial ac-tivity in soils should be tightly regulated by the osmotic and matric potential of water (Parr et al., 1981; Orchard and Cook, 1983). Accordingly, the relation between soil respira-tion and soil water potential (ψlog)was the least affected by
soil properties. RMSD values (Table 3) show that this mea-sure was the best predictor of respiration rates with or with-out including soil properties – except in organic soils, which may be the result of having only three related datasets. How-ever, since large changes in water potential are often asso-ciated with small changes in water content, predicting water potential in soils could itself be associated with large errors. Among the models based on measures of water content (θs,
θm or θv), those using θs resulted in the lowest root mean
square deviation and were thus the best predictor of respira-tion rates. Ultimately, finding the measure that performs best in large scale simulations will require a validation of model performance against actual field data. It should be noted that R2were not reported because, first, different models were fit with different sets of observations, and second, even with a lowR2a moisture measure may still be a good predictor of respiration, as would be the case of a mostly constant PRSR
that does not vary with any of the predictor variables. The main limitation of our models was simulating the res-piration response at low values of moisture, usually associ-ated with less than 10 %θs. This was partially the result of
the lack of data at low moistures (Fig. 1), but also of the
analysis procedure. Because we compared soils with un-known basal respiration rates and incubated under very dif-ferent conditions, the only comparable measure for this anal-ysis was the proportional or relative change. However, this means that at respiration values approaching 0 this propor-tional change will tend to increase exponentially, resulting in a wide spread of values and a poor model performance in this range. In this study, we chose to apply a rescaling of predicted values to obtain a zero-intercept (Fig. 3), as de-scribed in methods, thus introducing a negative bias but mak-ing fluxes at low moisture more realistic. Note that for water potential models this rescaling was not performed.
The data from England and Wales soils used for model comparison represents a large range of properties character-istic of soils in temperate regions. The range of respiration curves we predicted (Fig. 4), related to variations in the prop-erties of these soils, covered most of the differences between strongly differing functions such as those used in the RothC, CANDY and Bethy models. Thus, the variability in model predictions, associated with different moisture functions, can be largely reduced or eliminated by using a common, but generally valid, soil-dependent moisture-respiration func-tion. Depending on the model, soil and climate, signifi-cantly different predictions of soil carbon decomposition are expected after including these soil-dependent functions. In most cases this will tend to lower rates of respiration and, consequently, to an increased sequestration of carbon in soils. Our predictions rely on regression models which are prac-tical and have the advantage of being based on data. As a drawback, they can result in unrealistic values when extrap-olating or where data was insufficient or non-linear. This can be avoided by using mechanistic models that integrate, or are parameterized with, the results of empirical studies. A re-cent study that provides a process based framework of the soil moisture-respiration relationship is that of Davidson et al. (2012). The Dual Arrhenius and Michaelis-Menten kinet-ics model (DAMM) they describe has the advantage of be-ing process based, so that moisture effects are reproduced by simulating the diffusion of substrates and oxygen depending on water and air space content, respectively. DAMM is, how-ever, in an early stage of development and must be parame-terized for individual soils. In this sense, regression mod-els may prove more useful at this stage and for large scale simulations. As mechanistic models incorporate the effects of texture, bulk density, etc., they should reproduce the ef-fects of soil properties in a way that is consistent with the correlations observed here.
5 Conclusions
moisture response of soil carbon decomposition will likely have an important role in determining any future evolution. The empirical analysis presented here is a comprehensive synthesis of what has been observed to date. But most im-portantly, it shows that the soil heterotrophic respiration re-sponse to moisture depends on soil properties in a consistent and largely predictable way, explaining a significant part of the variations found across studies. Future studies should concentrate on reducing uncertainties in these relationships and on better representing specific field conditions, such as the depth-dependence of oxygen availability and the dynam-ics of water in soils. This will require obtaining and analyz-ing more relevant data while usanalyz-ing observed relationships to develop process-based models.
Supplementary material related to this article is available online at:
http://www.biogeosciences.net/9/1173/2012/ bg-9-1173-2012-supplement.zip.
Acknowledgements. This work was supported by the Project
Carbosoil from GIS Climat-Environnement-Soci´et´e. England and Wales soils data were used under licence of “Soils Data (c) Cranfield University (NSRI) and for the Controller of HMSO, 2011”.
Edited by: M. Bahn
References
Abrahamsen, P. and Hansen, S.: Daisy: an open soil-crop-atmosphere system model, Environ. Modell. Softw., 15, 313– 330, 2000.
Balogh, J., Pint´er, K., F´oti, S., Cserhalmi, D., Papp, M., and Nagy, Z.: Dependence of soil respiration on soil moisture, clay content, soil organic matter, and CO2uptake in dry grasslands, Soil Biol. Biochem., 43, 1006–1013, 2011.
Bauer, J., Herbst, M., Huisman, J., Weiherm¨uller, L., and Vereecken, H.: Sensitivity of simulated soil heterotrophic res-piration to temperature and moisture reduction functions, Geo-derma, 145, 17–27, 2008.
Bellamy, P. H., Loveland, P. J., Bradley, R. I., Lark, R. M., and Kirk, G. J. D.: Carbon losses from all soils across England and Wales 1978–2003, Nature, 437, 245–248, 2005.
Bowden, R., Newkirk, K., and Rullo, G.: Carbon dioxide and methane fluxes by a forest soil under laboratory-controlled mois-ture and temperamois-ture conditions, Soil Biol. Biochem., 30, 1591– 1597, 1998.
Burke, E. J. and Brown, S. J.: Regional drought over the UK and changes in the future, J. Hydrol., 394, 471–485, 2010.
Coleman, K. and Jenkinson, D. S.: RothC-26.3, A Model for the Turnover of Carbon in Soil: Model Description and User’s Guide. Lawes Agric. Trust, Harpenden, UK, 1999.
Cook, F. J. and Orchard, V. A.: Relationships between soil respi-ration and soil moisture, Soil Biol. Biochem., 40, 1013–1018, 2008.
Cook, F. J., Orchard, V. A., and Corderoy, D. M.: Effects of lime and water content on soil respiration, New Zeal. J. Agr. Res., 28, 517–523, 1985.
Craine, J. M. and Gelderman, T. M.: Soil moisture controls on tem-perature sensitivity of soil organic carbon decomposition for a mesic grassland, Soil Biol. Biochem., 43, 455–457, 2011. Curiel Yuste, J., Baldocchi, D. D., Gershenson, A., Goldstein, A.,
Misson, L., and Wong, S.: Microbial soil respiration and its dependency on carbon inputs, soil temperature and moisture, Global Change Biol., 13, 2018–2035, 2007.
Davidson, E. A. and Janssens, I. A.: Temperature sensitivity of soil carbon decomposition and feedbacks to climate change, Nature, 440, 165–173, 2006.
Davidson, E. A., Verchot, L. V., Cattanio, J. H., Ackerman, I. L., and Carvalho, J. E. M.: Effects of soil water content on soil res-piration in forests and cattle pastures of eastern Amazonia, Bio-geochem., 48, 53–69, 2000.
Davidson, E. A., Samanta, S., Caramori, S. S., and Savage, K.: The Dual Arrhenius and Michaelis-Menten kinetics model for decomposition of soil organic matter at hourly to seasonal time scales, Global Change Biol., 18, 371–384, 2012.
Doran, J. W.: Microbial activity as regulated by soil water-filled pore space, in: Transactions 14th International Congress of Soil Science. Presented at the 14th International Congress of Soil Sci-ence, 12–18 August 1990, Kyoto, Japan, 94–99, 1990.
Falloon, P., Jones, C. D., Ades, M., and Paul, K.: Direct soil mois-ture controls of fumois-ture global soil carbon changes: An impor-tant source of uncertainty, Global Biogeochem. Cy., 25, GB3010, doi:10.1029/2010GB003938, 2011.
Franko, U., Oelschlagel, B., and Schenk, S.: Modellierung von Bodenprozessen in Agrarlandschaften zur Untersuchung der Auswirkungen m¨oglicher Klimaver¨anderungen, Sektion Bo-denforschung, UFZ-Umweltforschungszentrum Leipzig-Halle GmbH, Leipzig, DE 3, 1995.
Franzluebbers, A. J.: Microbial activity in response to water-filled pore space of variably eroded southern Piedmont soils, Appl. Soil Ecol., 11, 91–101, 1999.
Greaves, J. E. and Carter, E. G.: The influence of moisture and soluble salts on the bacterial activities of the soil, Soil Sci., 13, 251–270, 1922.
Gulledge, J. and Schimel, J. P.: Moisture control over atmospheric CH4consumption and CO2production in diverse Alaskan soils, Soil Biol. Biochem., 30, 1127–1132, 1998.
Ilstedt, U., Nordgren, A., and Malmer, A.: Optimum soil water for soil respiration before and after amendment with glucose in hu-mid tropical acrisols and a boreal mor layer, Soil Biol. Biochem., 32, 1591–1599, 2000.
IPCC: Climate Change 2007: The Physical Science Basis. Con-tribution of Working Group I to the Fourth Assessment Report of the Intergovernmental Panel on Climate Change. Cambridge University Press, Cambridge, United Kingdome and New York, NY, USA, 2007.
Ito, A. and Oikawa, T.: A simulation model of the carbon cycle in land ecosystems (Sim-CYCLE): a description based on dry-matter production theory and plot-scale validation, Ecol. Mod-ell., 151, 143–176, 2002.
stand, Global Change Biol., 14, 1305–1318, 2008.
Kendon, E. J., Rowell, D. P., and Jones, R. G.: Mechanisms and re-liability of future projected changes in daily precipitation, Clim. Dynam., 35, 489–509, 2009.
Knorr, W.: Annual and Internannual CO2Exchanges of the Terres-trial Biosphere: Process-Based Simulations and Uncertainties, Global Ecol. Biogeogr., 9, 225–252, 2000.
Linn, D. and Doran, J.: Effect of Water-Filled Pore-Space on Carbon-Dioxide and Nitrous-Oxide Production in Tilled and Nontilled Soils, Soil Sci. Soc. Am. J., 48, 1267–1272, 1984. Liu, W., Zhang, Z., and Wan, S.: Predominant role of water in
reg-ulating soil and microbial respiration and their responses to cli-mate change in a semiarid grassland, Global Change Biol., 15, 184–195, 2009.
Lomander, A., K¨atterer, T., and Andr´en, O.: Carbon dioxide evo-lution from top-and subsoil as affected by moisture and con-stant and fluctuating temperature, Soil Biol. Biochem., 30, 2017– 2022, 1998.
Nyhan, J. W.: Influence of soil temperature and water tension on the decomposition rate of carbon-14 labeled herbage, Soil Sci., 121, 288–293, doi:10.1097/00010694-197605000-00005, 1976. Orchard, V. A. and Cook, F. J.: Relationship between soil
respira-tion and soil-moisture, Soil Biol. Biochem., 15, 447–453, 1983. Orchard, V. A., Cook, F. J., and Corderoy, D. M.: Field and
labora-tory studies on the relationship between respiration and moisture for 2 soils of contrasting fertility status, Pedobiologia, 36, 21–33, 1992.
Parr, J. F., Gardner, W. R., and Elliott, L. F.: Water potential rela-tions in soil microbiology, Special Publicarela-tions 9, Soil Sci. Soc. Am., Madison, WI, USA, 1981.
Paul, K. I., Polglase, P. J., O’Connell, A. M., Carlyle, J. C., Smethurst, P. J., and Khanna, P. K.: Defining the relation be-tween soil water content and net nitrogen mineralization, Eur. J. Soil Sci., 54, 39–48, 2003.
Powlson, D. S., Smith, P., and Smith, J. U.: Evaluation of Soil Or-ganic Matter Models, NATO ASI Series. Series 1: Global Envi-ronmental Change, Springer, Berlin, DE, 1996.
Reichstein, M., Subke, J. A., Angeli, A. C., and Tenhunen, J. D.: Does the temperature sensitivity of decomposition of soil organic matter depend upon water content, soil horizon, or incubation time?, Global Change Biol., 11, 1754–1767, 2005.
Rey, A., Petsikos, C., Jarvis, P. G., and Grace, J.: Effect of tempera-ture and moistempera-ture on rates of carbon mineralization in a Mediter-ranean oak forest soil under controlled and field conditions, Eur. J. Soil Sci., 56, 589–599, 2005.
Rodrigo, A., Recous, S., Neel, C., and Mary, B.: Modelling tem-perature and moisture effects on C-N transformations in soils: comparison of nine models, Ecol. Modell., 102, 325–339, 1997. R¨uhlmann, J., K¨orschens, M., and Graefe, J.: A new approach to calculate the particle density of soils considering properties of the soil organic matter and the mineral matrix, Geoderma, 130, 272–283, 2006.
Schjonning, P., Thomsen, I., Moberg, J., de Jonge, H., Kristensen, K., and Christensen, B.: Turnover of organic matter in differ-ently textured soils – I. Physical characteristics of structurally disturbed and intact soils, Geoderma, 89, 177–198, 1999. ˇSimunek, J. and Suarez, D. L.: Modeling of carbon dioxide
trans-port and production in soil 1, Model development, Water Resour. Res., 29, 487–497, 1993.
Skopp, J., Jawson, M., and Doran, J.: Steady-state aerobic micro-bial activity as a function of soil-water content, Soil Sci. Soc. Am. J., 54, 1619–1625, 1990.
Stott, D. E., Elliott, L., Papendick, R., and Campbell, G.: Low-temperature or low water potential effects on the microbial de-composition of wheat residue, Soil Biol. Biochem., 18, 577–582, 1986.
Thomsen, I., Schjonning, P., Jensen, B., Kristensen, K., and Chris-tensen, B.: Turnover of organic matter in differently textured soils – II, Microbial activity as influenced by soil water regimes, Geoderma, 89, 199–218, 1999.
Vincent, G., Shahriari, A. R., Lucot, E., Badot, P.-M., and Epron, D.: Spatial and seasonal variations in soil respiration in a tem-perate deciduous forest with fluctuating water table, Soil Biol. Biochem., 38, 2527–2535, 2006.