with
Clostridium difficile
Infection (CDI): A Prospective
Cohort Study
Andrew Swale1,2., Fabio Miyajima1,2., Paul Roberts2
, Amanda Hall3, Margaret Little1,2,
Mike B. J. Beadsworth2,5, Nick J. Beeching2,4,5, Ruwanthi Kolamunnage-Dona6, Chris M. Parry3,5,
Munir Pirmohamed1,2*
1The Wolfson Centre for Personalised Medicine, University of Liverpool, Liverpool, United Kingdom,2The Royal Liverpool and Broadgreen University Hospital Trust, Liverpool, United Kingdom,3Institute of Infection and Global Heath, University of Liverpool, Liverpool, United Kingdom,4NIHR Health Protection Unit in Gastrointestinal Infections, Liverpool, United Kingdom,5Liverpool School of Tropical Medicine, Liverpool, United Kingdom,6Department of Biostatistics, University of Liverpool, Liverpool, United Kingdom
Abstract
Measurement of both calprotectin and lactoferrin in faeces has successfully been used to discriminate between functional and inflammatory bowel conditions, but evidence is limited for Clostridium difficile infection (CDI). We prospectively recruited a cohort of 164 CDI cases and 52 controls with antibiotic-associated diarrhoea (AAD). Information on disease severity, duration of symptoms, 30-day mortality and 90-day recurrence as markers of complicated CDI were recorded. Specimens were subject to microbiological culture and PCR-ribotyping. Levels of faecal calprotectin (FC) and lactoferrin (FL) were measured by ELISA. Statistical analysis was conducted using percentile categorisation. ROC curve analysis was employed to determine optimal cut-off values. Both markers were highly correlated with each other (r2= 0.74) and elevated in cases compared to controls (p,0.0001; ROC.0.85), although we observed a large amount of variability across both groups. The optimal case-control cut-off point was 148 mg/kg for FC and 8.1 ng/ml for FL. Median values for FL in CDI cases were significantly greater in patients suffering from severe disease compared to non-severe disease (104.6 vs. 40.1 ng/ml, p = 0.02), but were not significant for FC (969.3 vs. 512.7 mg/kg, p = 0.09). Neither marker was associated with 90-day recurrence, prolonged CDI symptoms, positive culture results and colonisation by ribotype 027. Both FC and FL distinguished between CDI cases and AAD controls. Although FL was associated with disease severity in CDI patients, this showed high inter-individual variability and was an isolated finding. Thus, FC and FL are unlikely to be useful as biomarkers of complicated CDI disease.
Citation:Swale A, Miyajima F, Roberts P, Hall A, Little M, et al. (2014) Calprotectin and Lactoferrin Faecal Levels in Patients withClostridium difficileInfection (CDI): A Prospective Cohort Study. PLoS ONE 9(8): e106118. doi:10.1371/journal.pone.0106118
Editor:Michel R. Popoff, Institute Pasteur, France
ReceivedJune 16, 2014;AcceptedJuly 28, 2014;PublishedAugust 29, 2014
Copyright:ß2014 Swale et al. This is an open-access article distributed under the terms of the Creative Commons Attribution License, which permits unrestricted use, distribution, and reproduction in any medium, provided the original author and source are credited.
Data Availability:The authors confirm that all data underlying the findings are fully available without restriction. All relevant data are within the paper and its Supporting Information files.
Funding:This work was funded by the National Institute for Health Research (NIHR) Biomedical Research Centre in microbial diseases in Liverpool, and by the Medical Research Council [MR/K000551/1]. The authors would also like to thank the NIHR for PhD student funding for Andrew Swale [BRF-2011-028]. The funders had no role in study design, data collection and analysis, decision to publish, or preparation of the manuscript.
Competing Interests:The authors have declared that no competing interests exist. * Email: munirp@liv.ac.uk
.These authors contributed equally to this work.
Introduction
Clostridium difficile infection (CDI) is a major cause of nosocomial infections in patients undergoing antimicrobial treat-ment and is subject to mandatory notification in the UK [1–3]. It accounts for approximately 20% of antibiotic-associated diarrhoea cases. CDI pathogenesis is attributed to the action of two potent toxins, A and B [4,5]. Their synergistic effects cause fluid accumulation and damage to the epithelial mucosa [6], further eliciting pro-inflammatory cytokine release [7,8]. Concurrent activation and recruitment of neutrophils results in an inflamma-tory response in the gastrointestinal tract of CDI patients, but this is variable, ranging from self-contained mild inflammation to severe pseudomembranous colitis [9,10].
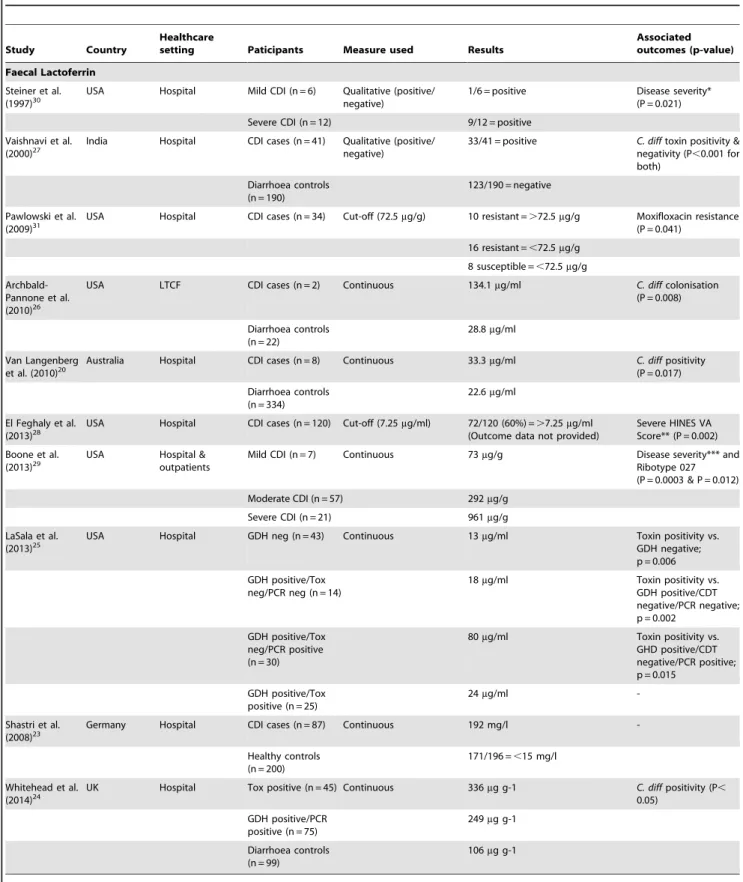
Table 1.Overview of previous studies evaluating the role of lactoferrin and calprotectin in faeces in patients withClostridium difficileinfection.
Study Country
Healthcare
setting Paticipants Measure used Results
Associated outcomes (p-value) Faecal Lactoferrin
Steiner et al. (1997)30
USA Hospital Mild CDI (n = 6) Qualitative (positive/ negative)
1/6 = positive Disease severity* (P = 0.021)
Severe CDI (n = 12) 9/12 = positive
Vaishnavi et al. (2000)27
India Hospital CDI cases (n = 41) Qualitative (positive/ negative)
33/41 = positive C. difftoxin positivity & negativity (P,0.001 for both)
Diarrhoea controls (n = 190)
123/190 = negative
Pawlowski et al.
(2009)31 USA Hospital CDI cases (n = 34) Cut-off (72.5
mg/g) 10 resistant =.72.5mg/g Moxifloxacin resistance (P = 0.041)
16 resistant =,72.5mg/g
8 susceptible =,72.5mg/g
Archbald-Pannone et al. (2010)26
USA LTCF CDI cases (n = 2) Continuous 134.1mg/ml C. diffcolonisation
(P = 0.008)
Diarrhoea controls (n = 22)
28.8mg/ml
Van Langenberg et al. (2010)20
Australia Hospital CDI cases (n = 8) Continuous 33.3mg/ml C. diffpositivity
(P = 0.017)
Diarrhoea controls (n = 334)
22.6mg/ml
El Feghaly et al.
(2013)28 USA Hospital CDI cases (n = 120) Cut-off (7.25
mg/ml) 72/120 (60%) =.7.25mg/ml (Outcome data not provided)
Severe HINES VA Score** (P = 0.002)
Boone et al. (2013)29
USA Hospital & outpatients
Mild CDI (n = 7) Continuous 73mg/g Disease severity*** and
Ribotype 027 (P = 0.0003 & P = 0.012)
Moderate CDI (n = 57) 292mg/g
Severe CDI (n = 21) 961mg/g
LaSala et al. (2013)25
USA Hospital GDH neg (n = 43) Continuous 13mg/ml Toxin positivity vs.
GDH negative; p = 0.006
GDH positive/Tox neg/PCR neg (n = 14)
18mg/ml Toxin positivity vs.
GDH positive/CDT negative/PCR negative; p = 0.002
GDH positive/Tox neg/PCR positive (n = 30)
80mg/ml Toxin positivity vs.
GHD positive/CDT negative/PCR positive; p = 0.015
GDH positive/Tox positive (n = 25)
24mg/ml
-Shastri et al. (2008)23
Germany Hospital CDI cases (n = 87) Continuous 192 mg/l
-Healthy controls (n = 200)
171/196 =,15 mg/l
Whitehead et al. (2014)24
UK Hospital Tox positive (n = 45) Continuous 336mg g-1 C. diffpositivity (P,
0.05)
GDH positive/PCR positive (n = 75)
249mg g-1
Diarrhoea controls (n = 99)
106mg g-1
*Disease was considered severe if any of the following was present: diarrhoea severe enough to produce clinical signs of volume depletion and to require hospitalization, WBC count of.10,000/ml, or temperature of.38.3uC.
**Scoring system accounting for fever (.38uC), ileus (clinical or radiographic), systolic blood pressure (,100 mmHg), WBC (15000,WBC,30000 cells/ml) and CT scan findings (colonic wall thickening, colonic dilatation, ascites).
***Automatically classified as severe if age$65 years, WBC.156109/L, stool
$10 per day, not able to tolerate oral intake, usually abdominal complaints, radiographic or peritoneal signs, multiple comorbidities including but not limited to renal failure and immunosuppression.
Faecal material represents a very complex and heterogeneous biological matrix. Candidate faecal biomarkers must possess properties that ensure reliability and reproducibility of results and they must be unaffected by extra-digestive processes. Faecal calprotectin (FC) and faecal lactoferrin (FL), derived predomi-nantly from activated neutrophils have both been extensively evaluated in inflammatory bowel disease (IBD) and infectious diarrhoea [12–22].
FC and FL have also been evaluated in CDI in a small number of studies (Table 1). Some have shown an association of FC in several acute diarrhoeal diseases caused by bacteria, with the highest mean levels observed in patients with CDI (192 mg/L) [23]. Others have shown a significant association when comparing FC levels in toxin positive and GDH positive plus tcdA/tcdB PCR confirmed patients when compared to diarrhoea controls [24]. Similarly, FL has also been shown to be elevated in CDI patients [20,25–27], with more recent studies suggesting a positive correlation with disease severity [28–30] and fluoroquinolone resistance [31]. There are however limitations with the published studies: these include their retrospective nature, limited phenotype data, lack of matched controls, use of non-quantitative tests, and variations in the assessment of CDI outcome measures. Sample sizes have varied from 2 to 87, and none of the studies have compared FC and FL in the same patient groups. In this study, we use a prospective design, a carefully phenotyped cohort and simultaneous evaluation of both faecal markers, to investigate whether these faecal biomarkers would have clinical value in patients with CDI.
Methods
Cohort
A cohort of 216 patients was recruited from a large hospital setting in Merseyside, UK. Consecutive patients with healthcare-associated diarrhoea, which was defined as$3 liquid stools passed per day in the 24 hours preceding assessment, an onset after being in hospital for over 48 hours and recent exposure to either
antimicrobials and/or proton pump inhibitors, were eligible for inclusion. Relevant information on demographics, admission and clinical evaluation was collected for each patient who consented to participate and recorded into an anonymised case report proforma.
Blood and faecal specimens were collected from patients at study entry. Faecal samples were analysed byClostridium difficile
toxin (CDT) testing using a commercial TOX A/B II ELISA kit (Techlab, Blacksburg, USA) and selective anaerobic culture for 48 h using Brazier’s cefoxitin-cycloserine egg yolk agar (CCEY) (Lab M Ltd, Bury, UK). Isolates were identified by characteristic smell, colonial morphology and fluorescence under long wave UV light. Identification was confirmed using a latex agglutination test forC. difficilesomatic antigen (Oxoid, Basingstoke, UK). Isolates were stored on PROTECT beads (Technical Services Consultants Ltd, Heywood, UK) at270uC. PCR ribotyping of isolates was performed using a standard method [32] and compared to a library of circulating nosocomial strains [33]. A multiplex PCR assay targeting a species-specific internal fragment of the triose phosphate isomerase (tpi) housekeeping gene, internal core sequences of both toxins A (tcdA) and B (tcdB) genes was used to confirm all isolates as C. difficile and verify their individual toxigenicity [34]. The initial diagnosis of CDI was made by the responsible clinical teams, and the research team only became involved when a diagnosis had been confirmed by aC. difficile
toxin positive ELISA result. Using these criteria, there were 164 CDI cases. Control patients (n = 52) were individuals with evidence of antibiotic-associated diarrhoea (AAD), negative toxin ELISA test and microbiological culture, with no past history of CDI.
The severity of CDI symptoms was assessed at baseline by research nurses as per guidelines proposed by Public Health England – this is based on white blood cell count (.156109/L),
acutely rising blood creatinine (.50% increase above baseline), fever (temperature.38.5uC), evidence of severe colitis (abdominal signs, radiology) and further complications such as hypotension, partial/complete ileus, toxic megacolon and colectomy [35]. We
Table 2.Demographics of the patient cohort.
CDI Cases (n = 164) AAD Controls (n = 52) P-value* Patient’s characteristics
Gender – Female n (%) 95 (58) 35 (67) 0.26
Age – Mean in years (SD) 70.2 (15.9) 66.4 (15.8) 0.13
BMI – Mean (SD) 24.6 (6.4) 28.2 (6.9) ,0.01
Charlson Comorbidity Score** – Median (IQR) 1.0 (0.0–2.0) 1.0 (0.0–2.0) 0.22
Time delay prior to recruitment, days – Median (IQR) 3.0 (2.0–4.8) 2.0 (2.0–3.0) ,0.01
Clinical Parameters
All cause death within 30 days – n (%) 14/164 (8.5) 1/52 (1.9) 0.13
Duration of symptoms - 10 days and over – n (%) 83/145a(57.2) 12/46a(26.1)
,0.01
Severity at baseline – n (%) 48/164 (29.3) -
-Recurrence within 90 days – n (%) 53/116b(45.7) -
-Frequency of ribotype 027– n (%) 72/149c(48.3) -
-n: number; CDI: Clostridium difficile infection; AAD: Antibiotic-associated diarrhoea; BMI: Body mass index; IQR: Interquartile range; SD: Standard deviation;
*Means for normally distributed, continuous variables were compared using Independent samples T-test for continuous, for non-normal distribution median values were compared using Mann Whitney U test. Categorical data was assessed using a Chi-squared test for all counts.5, and Fisher’s Exact test for those,5;
**Charlson comorbidity score is calculated without accounting for age (see statistical methods);
aData regarding duration of symptoms was unavailable for 19 of our cases and 6 of our controls; bData regarding recurrence of disease within 90 days was unavailable for 48 of our cases;
have further adjusted the white blood cell count to a more stringent cut-off of.206109/L. Duration of symptoms from the diarrhoea start date was recorded and then dichotomised into episodes lasting more or less than 10 days, while mortality was actively monitored for a period of 30 days. Recurrent CDI was defined as the development of subsequent CDI episodes up to a period of 90 days following treatment of the initial episode. These different parameters collectively represent complicated CDI disease.
Ethics statement
Ethical approval for the study was obtained from the Liverpool Research Ethics Committee under reference numbers 08/H1005/ 32 and each patient provided written informed consent prior to recruitment.
Biomarker measurement in stools
Both FC and FL levels were measured using commercially available IVD ELISA kits (Calpro, Lysaker, Norway; IBD Scan Techlab, Blacksburg, USA, respectively). All procedures were
carried out according to manufacturer’s instructions, with the exception of the FL sample preparation step, whereby an inoculation loop was used as an agitator during a 30 minute shaking step in order to ensure optimal recovery of proteins. Where necessary, further dilutions and extra points on the standard curve were included. A standard 4-parameter logistic nonlinear regression method was used to calculate faecal biomarker concentrations.
Statistical analysis
Levels of FC and FL were subject to a 4-tier percentile categorization (i.e. Low,25%, Medium 25–50%, High 50–75% and Very High.75%). Univariate binary logistic regression was conducted for both case-control comparison and sub-group analysis of cases for the outcomes proposed above. Covariates including age, gender, BMI, score on Charlson Comorbidity Index, presence of ribotype 027 and time delay between testing positive and subsequent recruitment were assessed. As age was already included as an individual covariate, we calculated our Charlson Comorbidity Index unadjusted for age, consistent with Table 3.Faecal lactoferrin levels in Clostridium difficile infection (CDI) cases versus Antibiotic-associated diarrhoea (AAD) controls.
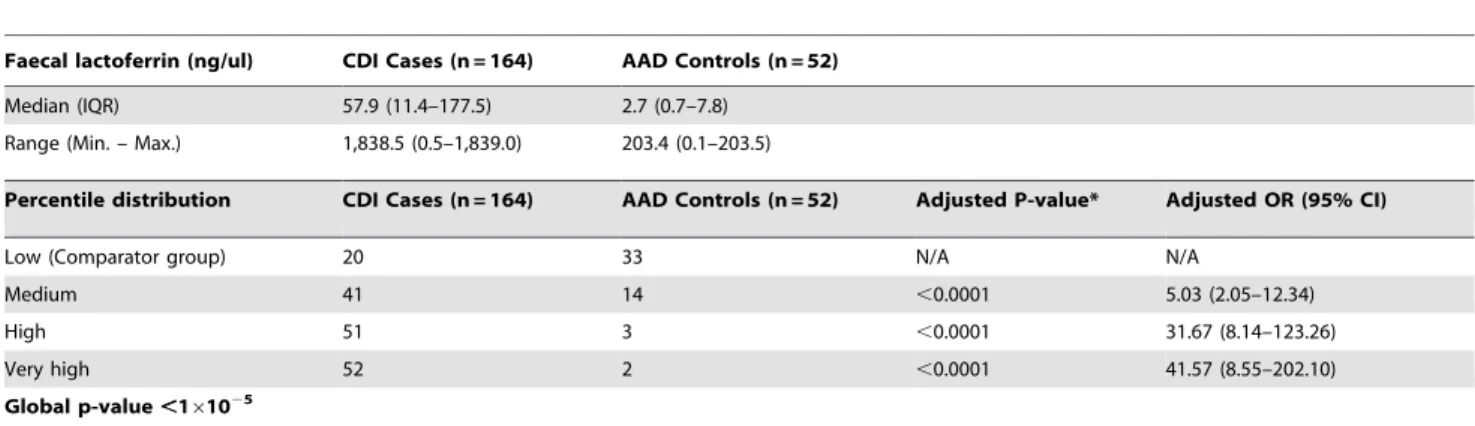
Faecal lactoferrin (ng/ul) CDI Cases (n = 164) AAD Controls (n = 52)
Median (IQR) 57.9 (11.4–177.5) 2.7 (0.7–7.8)
Range (Min. – Max.) 1,838.5 (0.5–1,839.0) 203.4 (0.1–203.5)
Percentile distribution CDI Cases (n = 164) AAD Controls (n = 52) Adjusted P-value* Adjusted OR (95% CI)
Low (Comparator group) 20 33 N/A N/A
Medium 41 14 ,0.0001 5.03 (2.05–12.34)
High 51 3 ,0.0001 31.67 (8.14–123.26)
Very high 52 2 ,0.0001 41.57 (8.55–202.10)
Global p-value,161025
CDI: Clostridium difficile infection; AAD: Antibiotic-associated diarrhoea; n: number; IQR: Interquartile range; Min.: Minimum; Max.: Maximum; OR: Odds ratios; CI: Confidence interval; N/A: Not applicable.
*P-value was calculated using binary logistic regression with data grouped into percentiles. Analysis was adjusted for significant covariates BMI and time delay between testing positive and subsequent recruitment.
doi:10.1371/journal.pone.0106118.t003
Table 4.Faecal calprotectin levels in Clostridium difficile infection (CDI) cases versus Antibiotic-associated diarrhoea (AAD) controls.
Faecal calprotectin (mg/kg) CDI Cases (n = 159) AAD Controls (n = 51) Median (IQR) 684.8 (203.7–1,581.0) 66.5 (23.1–145.7)
Range (Min – Max) 21,440.5 (9.7–21,450.2) 1,807.8 (3.1–1,811)
Percentile distribution CDI Cases (n = 159) AAD Controls (n = 51) Adjusted P-value* Adjusted OR (95% CI)
Low (Comparator group) 21 31 N/A N/A
Medium 38 15 0.02 3.03 (1.21–7.53)
High 49 4 ,0.0001 21.82 (6.13–77.71)
Very high 51 1 ,0.0001 85.87 (10.21–721.90)
Global p-value,161025
CDI: Clostridium difficile infection; AAD: Antibiotic-associated diarrhoea; n: number; IQR: Interquartile range; Min.: Minimum; Max.: Maximum; OR: Odds ratios; CI: Confidence interval; N/A: Not applicable.
*P-value was calculated using binary logistic regression with data grouped into percentiles. Analysis was adjusted for significant covariates BMI, score on Charlson Comorbidity Index (exclusive of age) and time delay between testing positive & subsequent recruitment.
previous studies [36–38], in order to avoid introducing an undesirable level of collinearity into our analysis. Statistically significant covariates were added to the final regression model to produce adjusted p-values and ORs. A p-value of ,0.05 was considered significant. Power calculations were simulated using nQuery Advisor + nTerim 2.0 (Statistical Solutions Ltd., Cork, Ireland).
ROC curve analysis was conducted to identify optimal cut-off values for our cohort and to compare these against the recommended kit values established for active intestinal inflam-mation. The Pearson correlation coefficient was employed to assess the relationship between the faecal markers.
Results
Demographics
Demographics of the patient cohort are summarised in Table 2. No significant differences were observed between CDI cases and AAD controls for mean age (70.2 yrs versus 66.4 yrs; P = 0.13), gender (58% female versus 67% female, respectively; P = 0.26) or median Charlson Comorbidity Index score (1.0 versus 1.0; P = 0.22). However, significant differences were identified for mean BMI (24.6 versus 28.2; P,0.01) and the median time delay between testing positive and subsequent recruitment (3.0 days versus 2.0 days; P,0.01). C. difficile isolates were successfully recovered from 149 (91%) of the CDI cases, of which all were toxigenic and 72 (48%) had the ribotype 027/NAP1.
The proportion of patients suffering from symptoms of 10 or more days was higher amongst CDI cases compared with controls (57.2% versus 26.1%, p,0.01). Of the CDI cases, 29.3% (48/164)
were assessed as having severe disease, while 46% (53/116) of cases experienced recurrent episodes during the 3-month follow-up period.
Power calculations
For both biomarkers, power to detect a significant difference was calculated as$97% for the majority of analyses (Table S1). However, for analysis of 30-day mortality for both FL and FC and prolonged symptoms for FL, we had inadequate power.
Faecal concentrations of FC and FL in CDI
Median levels of both FL and FC were significantly higher in CDI cases compared to AAD controls (Tables 3 & 4). This was confirmed by percentile case-control analysis [Tables 3 & 4; p-value,0.0001 for both]. ROC case-control analysis of FL resulted in a cut-off value of 8.1 ng/ml with an AUC of 0.86 (95% CI 0.80– 0.92), producing a sensitivity of 81.7% (95% CI 75.8–87.6%), specificity of 76.9% (65.4–88.4%), positive predictive value (PPV) of 91.8% (87.3–96.3%) and negative predictive value (NPV) of 57.1% (45.5–68.7%) [Figure 1]. This result is similar to the recommended kit cut-off point (7.25 ng/ml). For FC our optimal cut-off value differed from that proposed by the manufacturer (148 mg/kg versus 50mg/kg, respectively), suggesting that FC levels are elevated in the AAD group. ROC analysis resulted in an AUC of 0.86 (0.81–0.92), producing sensitivity of 81.8% (75.8– 87.8%), specificity of 76.5% (64.9–88.1%), whilst PPV and NPV were 91.5% (86.9–96.1%) and 57.4% (45.6–69.2%), respectively (Figure 1). There was a high degree of correlation between FC and FL (r2= 0.74) consistent across all patients groups [Figure S1]. Figure 1. ROC curve analyses of Faecal Lactoferrin and Faecal Calprotectin concentrations inClostridium difficileinfection cases (n = 164) versus Antibiotic-associated diarrhoea controls (n = 52).
Sub-group percentile analysis identified that FL but not FC correlated with severe disease (FL: 104.6 vs. 40.1 ng/ml, p = 0.02; FC: 969.3 vs. 512.7 mg/kg, p = 0.09) [Figure 2; for FC please see Figure S2]. There was considerable overlap for FL levels between patients with severe and non-severe disease (Figure 2). For duration of symptoms, a significant association was observed with FC only when extreme percentiles were compared (p = 0.02), but this was not significant when all percentiles were included (p = 0.08). No significant associations were identified with the other outcome measures [Figure 2; for FC please see Figure S2]. Carriers of the ribotype 027 generally displayed higher levels of both faecal markers (median 1011 vs. 658 mg/kg, p = 0.09 for FC; median 83.2 versus 51.0 ng/ml, p = 0.57 for FL), but this was not significant. Median (range) levels of both FC and FL were higher in culture positive compared with culture negative samples but not significantly (712.2 (9.7–6,415.4) versus 345.8 (22.9–21,450.2) mg/ kg, p = 0.46 for FC; 63.5 (0.5–1,839.0) vs. 31.7 (2.6–318.5) ng/ml, p = 0.22 for FL). Median levels of both FC and FL were however significantly higher in culture negative patients compared to AAD controls (345.8 versus 66.5 mg/kg, p,0.01 for FC; 31.7 versus 2.7 ng/ml, p,0.001 for FL).
Discussion
FC and FL are derived from neutrophils in faecal material, and have been shown to correlate with the degree of inflammation in diseases such as IBD. Since CDI is also characterised histologically by intense neutrophilic infiltration [39], FC and FL may represent potential biomarkers of disease activity. Using a prospective cohort of inpatient CDI cases and AAD controls, we confirmed previous findings that both FC and FL increase during CDI (p,0.0001) [20,23,24,26,27]. There was a high degree of correlation between the two biomarkers, not surprising given their cellular origin. No previous CDI studies have evaluated both faecal biomarkers in the same patient group. These findings are consistent with those seen in IBD [12,13,15–18,21].
lower for both FL and FC (2.7 ng/ml versus 22.6–22.8mg/ml and 66.5 mg/kg versus 106mg/g, respectively; Table 1) than reported previously in the two FL studies and one FC study that included diarrhoea controls in their analysis [20,24,26]. Another study showed that 171 of 196 healthy controls (87%) had an FC level less than 15 mg/l [23], a similar observation to that seen in our AAD controls (41/51; 80%). Considerable variability was observed in different patients with CDI, which is consistent with data from IBD studies for both FL (4.34–179mg/ml) [13,16–18,21,40] and FC (164–2171 mg/kg) [13,14,16,17,19,22,40–43].
While our data show that FC and FL can differentiate between CDI and AAD, the use of these biomarkers for diagnosis per se would not add much value to the diagnostic paradigms currently in place. However, identification of patients with complicated CDI disease (for example disease leading to more prolonged symptoms and recurrent disease) would be useful. Our results show an association between FL levels and disease severity (p = 0.02) but not with FC (p = 0.09). This is an isolated finding, which taken together with the fact that there was a great deal of variability in actual concentrations, with significant overlap between the two groups (Figure 2), limits its clinical applicability. Furthermore, we observed no association with the other outcome measures evaluated. It is important to note that we had adequate statistical power to detect all of these outcomes except for 30-day mortality and FL and prolonged symptoms (Table S1).
Direct comparisons between this and other studies are limited by variability in methodologies adopted, the lack of quantitative data, and differences in the severity grading criteria [28–30]. Another problem may result from the potential short-lived characteristics of the biomarkers, which may hamper the predictive power of these markers unless they are captured within specific timeframes. A longitudinal study of FL [44] suggested that FL could be used to monitor disease activity and response since FL tends to return to baseline very rapidly following remission [29,44].
Our study has limitations. Firstly, we only used a single laboratory test (ELISA for CDT) for the primary identification of CDI cases. Although this is still a common procedure, modern algorithms currently make use of a more sensitive first step screening - based on either GDH, or NAAT - to minimise the odds of reporting false negative results. Therefore it is possible that our cohort may have lacked a fully representative range of cases. Furthermore, our AAD controls were not a homogenous group of patients and it is difficult to assess their fitness for this sort of analysis given that antimicrobials and/or PPIs may not be the sole underlying cause of their gastrointestinal tract dysbiosis.
Nevertheless, our data highlight the difficulties in using FL and FC as biomarkers for CDI. The variability observed would reduce predictive accuracy, and cannot be completely ascribed to variations in disease severity. Part of the variability may be due to differences in laboratory methodology. The volume of diluent for specimen suspension, and laboratory handling can each influence results, and caution should be exercised in the
interpretation of single results [45]. Although serial testing may have some value, it would add to the cost, and may be challenging in diseases such as CDI, thus further reducing its utility. Furthermore, these biomarkers can be elevated due to other diseases [45], and this is particularly important for CDI where infected patients are usually elderly with multiple co-morbidities.
There are no guidelines concerning the use of faecal biomarkers for the classification of CDI cases. In IBD research, where faecal biomarkers constitute a potential non-invasive alternative to colonoscopy, the most recent diagnostics guidance by UK National Institute for Health and Care Excellence (NICE) [46] still recommends that further research is needed on the use and clinical utility of faecal marker testing. Biomarkers which can act as indicators of disease, disease relapse and disease stratification, are also needed to direct CDI therapies more effectively. Our results suggest that FC and FL have limited applicability in this role.
Supporting Information
Figure S1 Correlation plot of Faecal Lactoferrin and Faecal Calprotectin concentrations in all patients (cases and controls combined; n = 210).
(TIF)
Figure S2 Boxplots for faecal calprotectin concentra-tions in relation to Clostridium difficile infection outcomes. i) Severity at baseline (AUC = 0.59); ii) Prolonged symptoms (AUC = 0.58); iii) 30-day mortality (AUC = 0.49); and iv) 90-day recurrence (AUC = 0.58). Faecal calprotectin was measured in 159 CDI cases. Data regarding duration of symptoms and disease recurrence was unavailable for 18 and 47 cases, respectively.
(TIF)
Table S1 Assessment of power across Clostridium difficile infection outcome analyses. a: To achieve 80% power we would require 749 patients in both sample groups. b: To achieve 80% power we would require 1370 patients in both sample groups. c: To achieve 80% power we would require 167 patients in both sample groups.
(DOCX)
Acknowledgments
We would like to thank the patients for taking part in the study, as well as the nursing and medical staff at the Royal Liverpool University Hospital who helped with recruitment.
Author Contributions
Conceived and designed the experiments: CP MB NB MP. Performed the experiments: AS FM PR AH. Analyzed the data: AS FM RK. Contributed to the writing of the manuscript: AS FM MP. Recruited the patients: ML. Collected clinical, admission & follow-up information: ML AS FM.
References
1. Bartlett JG, Chang TW, Gurwith M (1978) Antibiotic-associated pseudomem-branous colitis due to toxin-producing clostridia. New England Journal of Medicine 298: 531–534.
2. Hurley BW, Nguyen CC (2002) The spectrum of pseudomembranous enterocolitis and antibiotic-associated diarrhea. ArchInternMed 162: 2177– 2184.
3. Kelly CP, Pothoulakis C, Lamont JT (1994) Clostridium difficile colitis. New England Journal of Medicine 330: 257–262.
4. Babcock GJ, Broering TJ, Hernandez HJ, Mandell RB, Donahue K, et al. (2006) Human monoclonal antibodies directed against toxins A and B prevent
Clostridium difficile-induced mortality in hamsters. InfectImmun 74: 6339– 6347.
5. Lyras D, O’Connor JR, Howarth PM, Sambol SP, Carter GP, et al. (2009) Toxin B is essential for virulence of Clostridium difficile. Nature 458: 1176– 1179.
6. Hatheway CL (1990) Toxigenic clostridia. Clin Microbiol Rev 3: 66–98. 7. Hippenstiel S, Soeth S, Kellas B, Fuhrmann O, Seybold J, et al. (2000) Rho
8. Ishida Y, Maegawa T, Kondo T, Kimura A, Iwakura Y, et al. (2004) Essential involvement of IFN-gamma in Clostridium difficile toxin A-induced enteritis. J Immunol 172: 3018–3025.
9. Kelly CP, Kyne L (2011) The host immune response to Clostridium difficile. J Med Microbiol 60: 1070–1079.
10. Savidge TC, Pan WH, Newman P, O’brien M, Anton PM, et al. (2003) Clostridium difficile toxin B is an inflammatory enterotoxin in human intestine. Gastroenterology 125: 413–420.
11. Planche TD, Davies KA, Coen PG, Finney JM, Monahan IM, et al. (2013) Differences in outcome according to Clostridium difficile testing method: a prospective multicentre diagnostic validation study of C difficile infection. Lancet Infect Dis 13: 936–945.
12. D’Inca R, Dal PE, Di LV, Ferronato A, Fries W, et al. (2007) Calprotectin and lactoferrin in the assessment of intestinal inflammation and organic disease. IntJColorectal Dis 22: 429–437.
13. Sipponen T, Savilahti E, Kolho KL, Nuutinen H, Turunen U, et al. (2008) Crohn’s disease activity assessed by fecal calprotectin and lactoferrin: correlation with Crohn’s disease activity index and endoscopic findings. Inflamm Bowel Dis 14: 40–46.
14. Schoepfer AM, Beglinger C, Straumann A, Trummler M, Vavricka SR, et al. (2010) Fecal calprotectin correlates more closely with the Simple Endoscopic Score for Crohn’s disease (SES-CD) than CRP, blood leukocytes, and the CDAI. Am J Gastroenterol 105: 162–169.
15. Jones J, Loftus EV, Panaccione R, Chen LS, Peterson S, et al. (2008) Relationships between disease activity and serum and fecal biomarkers in patients with Crohn’s disease. Clin Gastroenterol Hepatol 6: 1218–1224. 16. Sipponen T, Ka¨rkka¨inen P, Savilahti E, Kolho KL, Nuutinen H, et al. (2008)
Correlation of faecal calprotectin and lactoferrin with an endoscopic score for Crohn’s disease and histological findings. Aliment Pharmacol Ther 28: 1221– 1229.
17. Sipponen T, Savilahti E, Ka¨rkka¨inen P, Kolho KL, Nuutinen H, et al. (2008) Fecal calprotectin, lactoferrin, and endoscopic disease activity in monitoring anti-TNF-alpha therapy for Crohn’s disease. Inflamm Bowel Dis 14: 1392–1398. 18. Langhorst J, Elsenbruch S, Koelzer J, Rueffer A, Michalsen A, et al. (2008) Noninvasive markers in the assessment of intestinal inflammation in inflamma-tory bowel diseases: performance of fecal lactoferrin, calprotectin, and PMN-elastase, CRP, and clinical indices. AmJGastroenterol 103: 162–169. 19. Schoepfer AM, Beglinger C, Straumann A, Trummler M, Renzulli P, et al.
(2009) Ulcerative colitis: correlation of the Rachmilewitz endoscopic activity index with fecal calprotectin, clinical activity, C-reactive protein, and blood leukocytes. Inflamm Bowel Dis 15: 1851–1858.
20. van Langenberg DR, Gearry RB, Wong HL, Ward M, Gibson PR (2010) The potential value of faecal lactoferrin as a screening test in hospitalized patients with diarrhoea. Intern Med J 40: 819–827.
21. Schoepfer AM, Trummler M, Seeholzer P, Seibold-Schmid B, Seibold F (2008) Discriminating IBD from IBS: comparison of the test performance of fecal markers, blood leukocytes, CRP, and IBD antibodies. Inflamm Bowel Dis 14: 32–39.
22. Garcı´a-Sa´nchez V, Iglesias-Flores E, Gonza´lez R, Gisbert JP, Gallardo-Valverde JM, et al. (2010) Does fecal calprotectin predict relapse in patients with Crohn’s disease and ulcerative colitis? J Crohns Colitis 4: 144–152.
23. Shastri YM, Bergis D, Povse N, Scha¨fer V, Shastri S, et al. (2008) Prospective multicenter study evaluating fecal calprotectin in adult acute bacterial diarrhea. Am J Med 121: 1099–1106.
24. Whitehead SJ, Shipman KE, Cooper M, Ford C, Gama R (2014) Is there any value in measuring faecal calprotectin in Clostridium difficile positive faecal samples? J Med Microbiol.
25. LaSala PR, Ekhmimi T, Hill AK, Farooqi I, Perrotta PL (2013) Quantitative fecal lactoferrin in toxin-positive and toxin-negative Clostridium difficile specimens. J Clin Microbiol 51: 311–313.
26. Archbald-Pannone L, Sevilleja JE, Guerrant R (2010) Diarrhea, clostridium difficile, and intestinal inflammation in residents of a long-term care facility. JAmMedDirAssoc 11: 263–267.
27. Vaishnavi C, Bhasin D, Kochhar R, Singh K (2000) Clostridium difficile toxin and faecal lactoferrin assays in adult patients. MicrobesInfect 2: 1827–1830. 28. El Feghaly RE, Stauber JL, Deych E, Gonzalez C, Tarr PI, et al. (2013) Markers
of intestinal inflammation, not bacterial burden, correlate with clinical outcomes in Clostridium difficile infection. Clin Infect Dis 56: 1713–1721.
29. Boone JH, Dipersio JR, Tan MJ, Salstrom SJ, Wickham KN, et al. (2013) Elevated lactoferrin is associated with moderate to severe Clostridium difficile disease, stool toxin, and 027 infection. Eur J Clin Microbiol Infect Dis 32: 1517– 1523.
30. Steiner TS, Flores CA, Pizarro TT, Guerrant RL (1997) Fecal lactoferrin, interleukin-1beta, and interleukin-8 are elevated in patients with severe Clostridium difficile colitis. ClinDiagnLab Immunol 4: 719–722.
31. Pawlowski SW, Archbald-Pannone L, Carman RJ, Alcantara-Warren C, Lyerly D, et al. (2009) Elevated levels of intestinal inflammation in Clostridium difficile infection associated with fluoroquinolone-resistant C. difficile. JHospInfect 73: 185–187.
32. Bidet P, Barbut F, Lalande V, Burghoffer B, Petit JC (1999) Development of a new PCR-ribotyping method for Clostridium difficile based on ribosomal RNA gene sequencing. FEMS Microbiol Lett 175: 261–266.
33. Health Protection Agency.Clostridium difficileRibotyping Network for England and Northern Ireland 2008/09 2009. http://www.hpa.org.uk/webc/ hpawebfile/hpaweb_c/1258560554236.
34. Lemee L, Dhalluin A, Testelin S, Mattrat MA, Maillard K, et al. (2004) Multiplex PCR targeting tpi (triose phosphate isomerase), tcdA (Toxin A), and tcdB (Toxin B) genes for toxigenic culture of Clostridium difficile. J Clin Microbiol 42: 5710–5714.
35. Public Health England (2013) Updated guidance on the management and treatment ofClostridium difficileinfection; Available: http://www.hpa.org.uk/ webc/HPAwebFile/HPAweb_C/1317138914904.
36. Caplin B, Kumar S, Davenport A (2011) Patients’ perspective of haemodialysis-associated symptoms. Nephrol Dial Transplant 26: 2656–2663.
37. Daskivich TJ, Chamie K, Kwan L, Labo J, Dash A, et al. (2011) Comorbidity and competing risks for mortality in men with prostate cancer. Cancer 117: 4642–4650.
38. Daskivich TJ, Kwan L, Dash A, Greenfield S, Litwin MS (2014) Weighted Versus Unweighted Charlson Score to Predict Long-term Other-cause Mortality in Men with Early-stage Prostate Cancer. Eur Urol.
39. Price AB, Davies DR (1977) Pseudomembranous colitis. J Clin Pathol 30: 1–12. 40. Langhorst J, Elsenbruch S, Mueller T, Rueffer A, Spahn G, et al. (2005) Comparison of 4 neutrophil-derived proteins in feces as indicators of disease activity in ulcerative colitis. Inflamm Bowel Dis 11: 1085–1091.
41. Summerton CB, Longlands MG, Wiener K, Shreeve DR (2002) Faecal calprotectin: a marker of inflammation throughout the intestinal tract. EurJGastroenterolHepatol 14: 841–845.
42. Tibble J, Teahon K, Thjodleifsson B, Roseth A, Sigthorsson G, et al. (2000) A simple method for assessing intestinal inflammation in Crohn’s disease. Gut 47: 506–513.
43. Costa F, Mumolo MG, Bellini M, Romano MR, Ceccarelli L, et al. (2003) Role of faecal calprotectin as non-invasive marker of intestinal inflammation. Dig Liver Dis 35: 642–647.
44. Boone JH, Lyerly DM, Wilkins TD, Carman RJ (2012) Fecal lactoferrin as a biomarker for determining disease severity and for treating infection in patients with clostridium difficile disease. US: Techlab, Inc. Patent no. US20120276060 A1.
45. Kopylov U, Rosenfeld G, Bressler B, Seidman E (2014) Clinical Utility of Fecal Biomarkers for the Diagnosis and Management of Inflammatory Bowel Disease. Inflamm Bowel Dis.