AMTD
2, 3221–3264, 2009Aerosol impact on the NO2 airmass
factor
J. Leit ˜ao et al.
Title Page
Abstract Introduction
Conclusions References
Tables Figures
◭ ◮
◭ ◮
Back Close
Full Screen / Esc
Printer-friendly Version
Interactive Discussion
Atmos. Meas. Tech. Discuss., 2, 3221–3264, 2009 www.atmos-meas-tech-discuss.net/2/3221/2009/ © Author(s) 2009. This work is distributed under the Creative Commons Attribution 3.0 License.
Atmospheric Measurement Techniques Discussions
This discussion paper is/has been under review for the journal Atmospheric Measure-ment Techniques (AMT). Please refer to the corresponding final paper in AMT
if available.
On the improvement of NO
2
satellite
retrievals – aerosol impact on the airmass
factors
J. Leit ˜ao1, A. Richter1, M. Vrekoussis1, A. Kokhanovsky1, Q. J. Zhang2, M. Beekmann2, and J. P. Burrows1
1
Institute of Environmental Physics, University of Bremen, Bremen, Germany
2
Laboratoire Inter-Universitaire des Syst `emes Atmosph `eriques (LISA), CNRS et Universit ´es Paris 12 et Paris 7, Cr ´eteil, France
Received: 18 November 2009 – Accepted: 19 November 2009 – Published: 11 December 2009
Correspondence to: J. Leit ˜ao (jleitao@iup.physik.uni-bremen.de)
AMTD
2, 3221–3264, 2009Aerosol impact on the NO2 airmass
factor
J. Leit ˜ao et al.
Title Page
Abstract Introduction
Conclusions References
Tables Figures
◭ ◮
◭ ◮
Back Close
Full Screen / Esc
Printer-friendly Version
Interactive Discussion Abstract
The accurate determination of nitrogen dioxide (NO2) tropospheric vertical columns from satellite measurements depends, partly, on the airmass factor (AMF) used. A sensitivity study was performed with the radiative transfer model SCIATRAN to better understand the impact of aerosols in the calculation of NO2AMFs. This influence was
5
studied by varying the NO2 and aerosol vertical distributions, as well as physical and optical properties of the particles. The key factors for these calculations were identified as the relation between trace gas and aerosol vertical profiles, the optical depth of the aerosol layer, and single scattering albedo. Overall it was found that aerosol mixed with the trace gas increases the measurements’ sensitivity. The largest change, a
10
factor of∼2 relative to the situation without aerosols, was found when a low layer of
aerosol (600 m) was combined with a homogenous NO2 layer of 1.0 km. A layer of
aerosol above the NO2will usually reduce the sensitivity of the satellite measurement, a situation found mostly for runs with discrete elevated aerosol layers representative for long-range transport of aerosols that can generate a decrease of the AMF values of up
15
to 70%. The use of measured aerosol profiles and modelled NO2 resulted, generally, in a much smaller changes of AMF relative to the pure Rayleigh case. Exceptions are some events of elevated layers with high aerosol optical depth that lead to a strong decrease of the AMF values. These results highlight the importance of aerosols in the retrieval of tropospheric NO2 columns from space and indicate the need for detailed
20
information on aerosol properties and vertical distribution.
1 Introduction
The possibility of measuring trace gases (e.g. ozone (O3), nitrogen dioxide (NO2), sul-phur dioxide (SO2), among others) from space provides a unique opportunity to ob-serve the Earth and its atmosphere from above and, consequently, monitor the air
25
AMTD
2, 3221–3264, 2009Aerosol impact on the NO2 airmass
factor
J. Leit ˜ao et al.
Title Page
Abstract Introduction
Conclusions References
Tables Figures
◭ ◮
◭ ◮
Back Close
Full Screen / Esc
Printer-friendly Version
Interactive Discussion
atmospheric pollution is currently performed by several instruments flying on satellites. One common technique is the use of backscattered solar radiation from which informa-tion can be retrieved on the amounts of aerosols and trace gases in the atmosphere. Some instruments were mainly developed for trace gas observations, as it is the case for GOME (Burrows et al., 1999) flying on ERS-2, SCIAMACHY (Burrows et al., 1995;
5
Bovensmann et al., 1999) on the ENVISAT platform, OMI (Levelt et al., 2006) on EOS-AURA and more recently GOME-2 (Callies et al., 2000) launched on MetOp-A. These also provide interesting information on aerosols albeit at low spatial resolution. Other instruments such as MODIS (King et al., 1992) flying on Terra and Aqua, MISR (Diner et al., 1998) also on Terra measuring with multi-angle viewpoint, or MERIS (B ´ezy et
10
al., 2000) on the ENVISAT platform, are better suited for aerosol retrievals since they provide high spatial resolution and, in some cases, multiple viewing directions. More recently, the active lidar system CALIOP (Winker et al., 2003) flying on the CALIPSO satellite has become available which for the first time can resolve aerosol vertical dis-tributions with high resolution.
15
Nitrogen oxides (NOx=NO+NO2) can be considered one of the main pollutants emit-ted in urban and industrialized areas mainly in fossil fuel combustion processes. NOx play a key role in the basic tropospheric chemistry acting as a precursor for photo-chemical ozone production and acidification of the atmosphere via nitric acid (Seinfeld and Pandis, 1998). Furthermore, they also contribute to global climate change by
in-20
terfering, directly and indirectly, with the Earth’s radiative budget (Solomon et al., 1999; IPCC, 2007; Vasilkov et al., 2009). According to the recent Fourth Assessment Report
(AR4, IPCC, 2007 and references therein) the main anthropogenic sources of NOx
include fossil fuel combustion and industrial processes followed by biomass burning. NOxis also emitted via natural processes mostly during lightning events and as result of
25
AMTD
2, 3221–3264, 2009Aerosol impact on the NO2 airmass
factor
J. Leit ˜ao et al.
Title Page
Abstract Introduction
Conclusions References
Tables Figures
◭ ◮
◭ ◮
Back Close
Full Screen / Esc
Printer-friendly Version
Interactive Discussion
emissions in the rapidly developing economies in Asia are expected to continue their in-crease. In the mid-1990s NOxemission rates for Asia were reported by Akimoto (2003) to exceed the amount emitted in North America and Europe, and in 2005, Richter et
al. found a high enhancement of NO2 columns over China measured by GOME and
SCIAMACHY. This continuous trend was illustrated in the latest AR4 report and various
5
recent publications (e.g. Zhang et al., 2007; van der A et al., 2008) where the increase in NOxemissions is identified as being mostly related to the economical development of the country and consequential growing number of power plants. Furthermore, massive use of fertilizers and intensification of agricultural practices were also significant factors in this process. While the global budget of anthropogenic sources is relatively well
con-10
strained, the natural emissions are still rather uncertain. The most common methods to estimate NOx emissions are “bottom-up” inventories. More recently, a “top-down” approach using NO2 satellite measurements to estimate global or regional emissions has been used in several studies, namely using inverse modelling strategies (e.g. Mar-tin et al., 2003; Beirle et al., 2004; Konovalov et al., 2006, 2008; van der A et al., 2008
15
and references therein). The satellite datasets offer advantages both on the time and spatial scales with a continuous global coverage that can often be achieved with high temporal resolution (approx. 1 to 6 days depending on the instrument coverage).
Although a great fraction of aerosols is part of the natural components of the Earth’s atmosphere, they can still be harmful for human health and contribute to visibility
degra-20
dation when present in high amounts (Chang et al., 2009 and references therein; Wang et al., 2009). In addition to their relevance as pollutants, they play a major role in cli-mate change by their direct and indirect impact on radiative forcing (e.g. IPCC, 2007). Aerosols vary strongly in size and composition, and their proper characterization, in particular using remote sensing, is still a challenge. In recent years numerous
ex-25
AMTD
2, 3221–3264, 2009Aerosol impact on the NO2 airmass
factor
J. Leit ˜ao et al.
Title Page
Abstract Introduction
Conclusions References
Tables Figures
◭ ◮
◭ ◮
Back Close
Full Screen / Esc
Printer-friendly Version
Interactive Discussion
Aerosol present in the atmosphere interacts with radiation consequently influencing the remote sensing measurements of atmospheric trace gases. Depending on the par-ticles’ optical properties, the amount of aerosol and its vertical distribution relative to that of the trace gas of interest, the sensitivity of the satellite measurements can ei-ther be increased or decreased. As the anthropogenic sources of aerosols and oei-ther
5
pollutants are often collocated, a proper characterization of the aerosols’ impact on the retrieval is needed to accurately quantify trace gas amounts derived from satellite observations. This is of particular importance if long-term trends of, for example, tropo-spheric NO2are studied which are accompanied by large changes also in the aerosol loading.
10
This study assesses the importance of aerosol for the retrieval of tropospheric NO2 columns from satellite observations. To this end, a number of different scenarios was defined with varying aerosol settings and NO2 distributions. They were used for ra-diative transfer calculations with the SCIATRAN model (Rozanov et al., 2005) in order to evaluate changes in the measurements’ sensitivity relative to a scenario without
15
aerosols. The results show to which parameters the measurements are most sensitive and to which extent the modification of aerosol properties affects the results. As far we are aware, a comprehensive study as ours has not been conducted before.
The paper starts with a brief discussion of aerosol effects on radiative transfer fol-lowed by a short description of the satellite retrieval. The selection process of data
20
used and definition of the case scenarios considered is presented in Sect. 2 together with some initial findings. The next section focuses on the results of the sensitivity study, presenting the variations of NO2airmass factors in response to changes in the boundary layer height, variation in the aerosol layer distribution and use of different single scattering albedo values. General conclusions are presented in the final section
25
AMTD
2, 3221–3264, 2009Aerosol impact on the NO2 airmass
factor
J. Leit ˜ao et al.
Title Page
Abstract Introduction
Conclusions References
Tables Figures
◭ ◮
◭ ◮
Back Close
Full Screen / Esc
Printer-friendly Version
Interactive Discussion 1.1 The effect of aerosols on the radiative transfer
Aerosols in the atmosphere interact with electromagnetic radiation both by scattering and by absorbing light. The scattering efficiency of aerosols strongly depends on their concentration, size and shape, as well as on their refractive index, determined by their chemical composition. Aerosol scattering also depends on the scattering angle and
5
usually has a pronounced maximum for forward scattering. The details of the angular distribution of the phase function vary with the aerosol composition and the size of the particles relative to the wavelength of the radiation and also depend on particle shape and internal structure. The absorbing properties of aerosols are usually expressed via the single scattering albedo (SSA) which is defined as the ratio of scattering to
10
extinction and depends on particle composition. For remote sensing applications, the total amount of aerosols present in the atmosphere is often specified by an aerosol optical depth (AOD) which is the vertical integral of the extinction by aerosols from the top of the atmosphere to the ground. Both the AOD and the SSA depend on wavelength.
15
Satellite measurements of tropospheric trace gases using scattered solar light are based on detection of the absorption along the light path from the sun through the atmosphere to the instrument. As scattering is a statistical process, many different light paths contribute to the signal observed at the top of the atmosphere. The overall absorption signal is to a first approximation determined by the amount of absorption
20
along the individual light paths weighted with their relative contributions to the total radiance measured. Aerosols in the atmosphere can change both, the individual light path lengths and their contributions to total radiance observed at the satellite.
Qualitatively, the effects of an aerosol layer on tropospheric measurements using scattered sun light can be separated into four groups:
25
AMTD
2, 3221–3264, 2009Aerosol impact on the NO2 airmass
factor
J. Leit ˜ao et al.
Title Page
Abstract Introduction
Conclusions References
Tables Figures
◭ ◮
◭ ◮
Back Close
Full Screen / Esc
Printer-friendly Version
Interactive Discussion – Increased sensitivity within and above the aerosol layer as result of larger
scatter-ing probability and therefore a larger contributions of these paths to the radiance observed at the satellite (albedo effect);
– Decreased sensitivity below the aerosol layer as more photons are scattered back to the satellite before they can reach these altitudes (shielding effect);
5
– Decreased sensitivity within and below the aerosol layer in cases of strongly ab-sorbing aerosols as the number of photons returning from this region is reduced.
One way of expressing the sensitivity of the measurement is to calculate the airmass factor (AMF) which is defined as the ratio between the apparent (slant) column of the absorber retrieved from a measurement and the vertical atmospheric column (see next
10
section). The larger the airmass factor, the higher the sensitivity of the measurement. The aerosol effects discussed above are illustrated in Fig. 1 where the NO2 airmass factor is shown as function of altitude for three different scenarios, highlighting the increased sensitivity in the presence of aerosols in the upper part of the layer and above it as well as the reduced sensitivity close to the surface. With the exception of
15
the last point, the effects of aerosols listed above are very similar to the considerations made for clouds (e.g. Hild et al., 2002; Beirle et al., 2009; Kokhanovsky and Rozanov, 2009). The overall impact of aerosols on a measurement will depend on the relative importance of the 4 effects which depends on aerosol properties, aerosol amounts, surface reflectance and the vertical distribution of aerosol and trace gas of interest.
20
The results can be both, an increase or a decrease in observed absorption signal depending on the specific conditions.
1.2 Satellite retrieval
The retrieval of tropospheric NO2 columns from space is performed in several steps. First, NO2slant column densities (SC) are retrieved with the DOAS (Differential Optical
25
AMTD
2, 3221–3264, 2009Aerosol impact on the NO2 airmass
factor
J. Leit ˜ao et al.
Title Page
Abstract Introduction
Conclusions References
Tables Figures
◭ ◮
◭ ◮
Back Close
Full Screen / Esc
Printer-friendly Version
Interactive Discussion
calculated by eliminating the stratospheric contribution from the total columns retrieved (further details regarding the retrieval can be found, for example in Leue et al. (2001), Richter and Burrows (2002), Martin et al. (2002) and Boersma et al. (2004)). When dividing this tropospheric SC by an airmass factor (AMF) a NO2 tropospheric vertical column density (VC) is obtained. Therefore, the AMF concept can be interpreted as
5
the relation between the optical path through the atmosphere and the vertical optical path in the layer of interest (Solomon et al., 1987). This AMF is computed using ra-diative transfer calculations that require information on measurement conditions (such as, observation geometry and wavelength) and atmospheric characteristics (e.g. ver-tical distribution of the chemical species, surface albedo, aerosol loading and clouds).
10
Hence, an appropriate selection of the a priori assumptions used is essential to obtain the correct values of the AMF and thus the NO2VC. In the event of selecting an AMF that is too high, the resulting VC will be underestimated. Likewise, the determined NO2 VC will be too large if the value of the AMF used for the conversion of the SC is too small.
15
Several aspects contributing to the total error in the determination of tropospheric NO2columns from the satellite measurements were studied by Boersma et al. (2004). In that analysis was concluded that including realistic aerosol in the radiative transfer calculations would increase the airmass factors by up to 40% depending on aerosol type and aerosol optical depth. The vertical profile of the aerosols was assumed to be
20
exponential with a scale height of 2.0 km and the vertical NO2profile was not specified. The conclusion from this study was that the correction for the aerosol impact cannot be simply separated from the effect of clouds and that if a cloud retrieval scheme is adopted, it will account for a large part of the aerosol effect by retrieving a different cloud fraction and height. Martin et al. (2003) also analysed the aerosol impact on the
25
AMTD
2, 3221–3264, 2009Aerosol impact on the NO2 airmass
factor
J. Leit ˜ao et al.
Title Page
Abstract Introduction
Conclusions References
Tables Figures
◭ ◮
◭ ◮
Back Close
Full Screen / Esc
Printer-friendly Version
Interactive Discussion
A similar sensitivity study to the one presented here was carried out by Gloudemans et al. (2008) to analyse, among other aspects, the impact of aerosols in the retrieval
of CH4 and CO (in the IR region) from the SCIAMACHY instrument. One of the main
findings from this study was that, depending on the location of the plume and type of aerosol, the omission of aerosol influence in the retrieval process can lead to significant
5
errors in the total column of CH4. Thomas et al. (2005), with a similar study for SO2 (retrieved in the UV region) concluded that aerosols are relevant mainly for optical thickness above 0.3 and in the presence of desert dust plumes in the boundary layer (BL). If these two conditions were realised at the same time the authors estimated
that the column would be underestimated by 5–10%. For the TOMS SO2 retrieval,
10
Krueger et al. (1995) showed that neglecting a rather thin aerosol layer may result in a systematic overestimation of the retrieved total SO2content.
Furthermore, recently, the aerosol impact on ground-based zenith-sky DOAS mea-surements was also investigated by Chen et al. (2009). The aerosol effect was studied by changing the extension of aerosol and NO2 layers, together and independently of
15
each other, and varying also the SSA. From this analysis an error of 10% was deter-mined. Nevertheless, for these measurements, the uncertainties caused by unknown aerosol properties and vertical profiles of both aerosol and NO2tended to cancel each other.
In current retrieval methods the presence of aerosols in the atmosphere is included
20
in many different ways. Some retrieval processes do not explicitly correct for aerosol impact, arguing that the cloud correction scheme also accounts for a large part of the aerosol effect (Boersma et al., 2004, 2007). Another approach is to use a static a priori profile for aerosol loading and type (N ¨uß, 2005; Richter et al., 2005). Finally, some retrievals include full aerosol treatment in the radiative transfer using aerosol fields
25
AMTD
2, 3221–3264, 2009Aerosol impact on the NO2 airmass
factor
J. Leit ˜ao et al.
Title Page
Abstract Introduction
Conclusions References
Tables Figures
◭ ◮
◭ ◮
Back Close
Full Screen / Esc
Printer-friendly Version
Interactive Discussion
2 Methodology
Numerous factors need to be accounted for when considering the effect of aerosols on the NO2 measurements. In the present study, these effects were analysed in de-tail by considering multiple scenarios where the aerosol vertical distribution was varied together with its load and optical properties. In addition, the NO2 vertical profile was
5
also varied. In a first step, simplified scenarios were investigated with, for example, NO2and aerosol vertical distribution as box profiles and considering purely scattering or partly absorbing aerosols. The results from these simulations provide insight into the direction and magnitude of the effects of different parameters on the satellite sensi-tivity. More realistic results were obtained in a second phase where measured aerosol
10
profiles from different locations were used and the NO2profiles considered were taken from model simulations for urban and rural conditions. In both cases, the interference exerted by aerosols can then be analysed by comparing these scenarios with a refer-ence scenario where no aerosol is considered in the radiative transfer calculations.
2.1 General radiative transfer settings 15
Airmass factors were calculated with the radiative transfer model SCIATRAN 2.2 (Rozanov et al., 2005). The calculations were performed at four different wavelengths (425, 437.5, 440 and 450 nm), in nadir observation, and six solar zenith angles (SZA, from 20◦ to 70◦in steps of 10◦). SCIATRAN was operated using the discrete ordinate
method for solution of the radiative transfer equation in plane parallel geometry
ac-20
AMTD
2, 3221–3264, 2009Aerosol impact on the NO2 airmass
factor
J. Leit ˜ao et al.
Title Page
Abstract Introduction
Conclusions References
Tables Figures
◭ ◮
◭ ◮
Back Close
Full Screen / Esc
Printer-friendly Version
Interactive Discussion 2.2 NO2profile
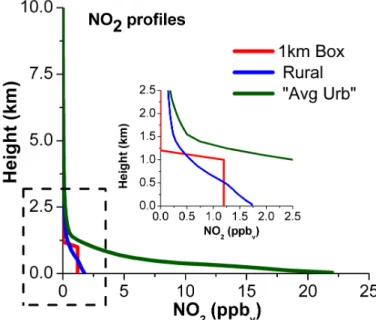
For the initial analysis, the NO2profiles were defined as simplified box profiles, where the NO2is homogenously distributed within a boundary layer of either 600 m or 1.0 km or 2.0 km height. This homogenous distribution is, most probably, not often found close to the major anthropogenic sources, i.e. in urban locations. For that reason, in the final
5
case scenarios simulated, two different NO2profiles, from surface to 6.5 km, were used: average urban and rural. These profiles are an average from CHIMERE (Schmidt et al., 2001; Honor ´e et al., 2008) model runs with a 9×9 km2resolution and for the period
from 23 May to 11 June 2007 (randomly selected). The NO2volume mixing ratio above 6.5 km decreases slowly to a value of 1.5×10⁻⁶ppm at 100 km. The model results are
10
based on a simulation for Paris downtown, a location in the close vicinity of Paris at 15 km East and a rural region at 100 km East of Paris. Since the first two sites are very similar, and, considering that the typical size of a satellite pixel would include both of these measurements, their average is defined as average urban – “Avg Urb”. In Fig. 2 the different NO2mixing ratio profiles are shown from surface up to 10 km.
15
As it can be seen in the profiles presented in Fig. 2, the NO2 profile determined by the model for the urban conditions is not at all similar to a homogenous distribution over a boundary layer of 1.0 km or even 600 m. This has a significant impact on the results as it will be further discussed in Sect. 3.2. In addition, the large difference between the urban and rural profiles illustrates how the NO2 vertical distribution can
20
show significant variations over a short distance. This might be a crucial point for satellite retrievals where, at the spatial resolution of current a priori data, both urban and rural scenes are often contained in one model grid cell (Heckel et al., 2009).
2.3 Aerosol settings
Currently, several datasets with aerosol characteristics are available from records of
25
AMTD
2, 3221–3264, 2009Aerosol impact on the NO2 airmass
factor
J. Leit ˜ao et al.
Title Page
Abstract Introduction
Conclusions References
Tables Figures
◭ ◮
◭ ◮
Back Close
Full Screen / Esc
Printer-friendly Version
Interactive Discussion
the current uncertainties on the definition of aerosol optical properties. This is the case of, for instance, the Aerosol Robotic Network (AERONET, Holben et al., 1998) that provides long-term and continuous measurements of aerosol optical, microphysical and radiative properties (e.g. AOD). In addition, data is also provided from many lidar networks established in different continents, such as the European Aerosol Research
5
Lidar Network (EARLINET, Mattis et al., 2002), or the Asian dust network (AD-net, Murayama et al., 2001) that monitor both the horizontal and vertical distribution of aerosols and its optical properties. In the present study data taken from these networks was applied in the definition of the aerosol optical properties and its vertical distribution. However, these data are not the only source of information as, nowadays, many of the
10
instruments flying on different satellites measure the same features with the advantage of broad spatial coverage (e.g. MODIS, MISR, MERIS, CALIPSO, etc.).
The aerosol settings used in the radiative transfer model are linked to the optical properties and vertical profiles. These are based on data from measurements so that they can be a better representation of the atmospheric aerosol characteristics.
15
The optical properties and size distributions of aerosol, at 440 nm, were mainly taken from records of 12 worldwide AERONET stations presented in Dubovik et al. (2002). This dataset is representative for the usual classification of four different aerosol types that have distinctive physicochemical, optical and radiative properties: urban/industrial, biomass burning, desert dust and oceanic. The precision of the AERONET dataset is
20
discussed in detail in several publications but this subject will not be explored here be-cause the accuracy of these measurements and representativeness of the dataset is not central to the conclusions to be drawn.
Aerosols emitted in urban areas and from open vegetation fires are, on average, dominated by small particles (Seinfeld and Pandis, 1998). Yet, the size distribution of
25
AMTD
2, 3221–3264, 2009Aerosol impact on the NO2 airmass
factor
J. Leit ˜ao et al.
Title Page
Abstract Introduction
Conclusions References
Tables Figures
◭ ◮
◭ ◮
Back Close
Full Screen / Esc
Printer-friendly Version
Interactive Discussion
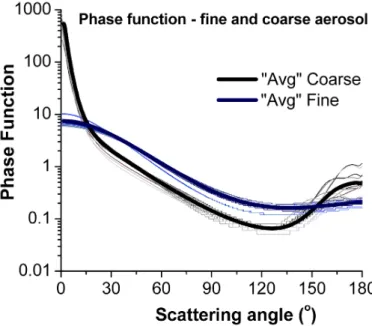
from the source. On the other hand, mostly coarse particles are found in desert dust scenes or oceanic aerosol (Seinfeld and Pandis, 1998). The selection of results pre-sented here will follow these assumptions, i.e. not every simulated case will be shown but mostly those which are more representative of the aerosol type in consideration. In order to facilitate the interpretation of results, a mixing of fine and coarse aerosol, as it
5
would happen in reality, was not simulated. For each of the aerosol types, the phase functions (see Fig. 3) for both fine and coarse particles were considered. These angular distributions of scattered light were determined with a FORTRAN program developed by Michael Mishchenko available at http://www.giss.nasa.gov/staff/mmishchenko/brf/.
In the first phase of the study, the aerosol vertical distribution was defined as a box
10
shaped profile with variable height and with extinction coefficients representative for three aerosol loads: 0.1 (low pollution level), 0.5 (moderate pollution) and 0.9 (heavily polluted scene) aerosol optical depth. Aerosol absorption was set to the average from all the SSA (ω0) values given at 440 nm in Dubovik et al. (2002): 0.93. The SSA differs according to type and source of aerosol and, therefore, is in part dependent on the
15
location of measurement (see, for example, Hu et al., 2007). Thus, this parameter was varied between 0.8 and 0.95 and the changes in the AMF analyzed as well (see Sect. 3.4). For the majority of the scenarios, the impact of aerosol absorption was simply investigated by comparing the AMF determined with runs whereω0was set to 0.93 and others where ω0=1.0. This allowed determining the maximum effect in the
20
results when reducing the absorbing ability of aerosol.
As mentioned above, the first set of scenarios considers well defined layers of ho-mogenously distributed aerosol. Alternatively, the aerosol’s vertical distribution was defined in different ways: following the NO2 profile; starting at surface level and with the top layer lower or higher than that of the NO2 profile; furthermore, discrete
ele-25
AMTD
2, 3221–3264, 2009Aerosol impact on the NO2 airmass
factor
J. Leit ˜ao et al.
Title Page
Abstract Introduction
Conclusions References
Tables Figures
◭ ◮
◭ ◮
Back Close
Full Screen / Esc
Printer-friendly Version
Interactive Discussion
The scenarios A to H will probably not be realised for all types of aerosols. Normally, the urban aerosol is assumed to be either in homogenous layers extending from the surface to the top of BL or, often, following an exponential decrease with height. In general, one can assume that the majority of anthropogenic sources are the same for both NO2 and aerosols and, therefore, they would have similar spatial distributions.
5
However, depending on the source location and transport processes, the aerosol layer can extend to a higher altitude, whereas NO2 will be in general more concentrated closer to the source region and at lower levels, due to a shorter life time. For that reason, the extension of each layer was also varied independently so that different scenarios could be analysed. The scenarios with elevated discrete aerosol layers are
10
mostly adequate to illustrate plumes of biomass burning smoke and desert dust that are transported several hundreds to thousand kilometres away from the source and which can be lifted to higher altitudes during transport. Several studies have registered aerosol from fire events transported to great distances away from the initial source region: smoke from fires in the African savanna that is transported across the Atlantic
15
Ocean (Husar et al., 1997; Ansmann et al., 2009); emissions from boreal fires in Siberia and/or Canada (Damoah et al., 2004; Murayama et al., 2004; M ¨uller et al., 2005); or, on a more regional scale, the transport within Europe (Amiridis et al., 2009). This long range transport often occurs in the free troposphere, but the plumes will also be part of the boundary layer either by intrusion processes or due to the low initial injection height
20
(M ¨uller et al., 2003; Labonne et al., 2007). These same processes also take place with desert dust plumes (Husar et al., 1997) and in some occasions the desert particles are found from the low troposphere to much higher above in the atmosphere (Mattis et al., 2002; Murayama et al., 2003). Desert storms are responsible for a great fraction of aerosol emissions and most of it is released either from the Sahara or the Asian
25
AMTD
2, 3221–3264, 2009Aerosol impact on the NO2 airmass
factor
J. Leit ˜ao et al.
Title Page
Abstract Introduction
Conclusions References
Tables Figures
◭ ◮
◭ ◮
Back Close
Full Screen / Esc
Printer-friendly Version
Interactive Discussion
In the attempt of simulating more realistic situations than those described above, in a second stage, the definition of the case studies was based on data available from different measurement datasets. The size distribution and corresponding phase func-tions were maintained from the initial stage. Nevertheless, the extinction coefficients used for the profile definition were based on lidar measurements performed at
numer-5
ous locations at different times of the year (see representation of profiles in Fig. 4). Still, the profiles considered in this study are not the exact representation of the orig-inal ones. Often adjustments were required in order to obtain a profile from surface to the top of atmosphere of 100 km. Moreover, as these are meant to be examples for case studies their representativeness is not a subject of this analysis and do not
10
influence the conclusions drawn.
Theω0values required to determine absorption coefficients were either taken from the corresponding records or based on typical values available from other studies that focused specifically on each of the aerosol types. Because lidar measurements (both satellite and ground-based) are usually performed at 355 nm and/or 532 nm an
15
˚
Angstr ¨om exponent ( ˚Angstr ¨om, 1929) was necessary to convert these values to the corresponding ones at 440 nm (within the wavelength region where NO2is retrieved). These values were also taken from the referred literature. A compilation of the settings used for the scenarios of the final phase of this study is presented in Table 2. The oceanic aerosol type was not included at this stage because this aerosol is normally
20
only observed in very low concentrations at polluted sites and is usually mixed with other types of aerosol. Therefore, for simplicity of the analysis, it is assumed that its influence in the NO2retrieval is similar to that of the other types considered.
3 Results
A comprehensive analysis was performed with airmass factors of NO2 calculated for
25
AMTD
2, 3221–3264, 2009Aerosol impact on the NO2 airmass
factor
J. Leit ˜ao et al.
Title Page
Abstract Introduction
Conclusions References
Tables Figures
◭ ◮
◭ ◮
Back Close
Full Screen / Esc
Printer-friendly Version
Interactive Discussion
layer variations are analysed, followed by impact in modifications of the extension of aerosol layer and ending in the single scattering albedo effects. For completeness of the study, the NO2 AMFs were calculated with all different types of aerosol with all profiles considered. However, depending on the aerosol source, the typical size and vertical distribution are quite different. For that reason, the results presented in the next
5
sections are focused on the more realistic cases, considering also the results from the second phase of the analysis when measured aerosol profiles were used. In addition, all results presented here were calculated at 440 nm as this is the wavelength for which the AERONET aerosol optical properties are given. Extension of the calculations to the wavelength range often used for NO2 retrieval revealed an average increase of AMF
10
by 10% from 425 to 450 nm. This variation is relatively small and will largely cancel if it is linear with wavelength but might be relevant in some cases. For different solar zenith angles (SZA), the general trend shows that the AMF increases for higher sun, but for specific cases, this tendency can also be reverted. In some circumstances (not presented here), when considering fine aerosol, a decrease occurs with high sun, and
15
in other cases, with coarse particles, a small increase is then followed by decay after 50◦or 60◦. The variation of the size parameters (mean radius and its standard deviation
within the fine or coarse mode categories) of the different aerosol types representative for the locations considered in this study was rather small. The similarity in values resulted in nearly identical phase functions with noticeable differences only between the
20
two general size distributions considered: fine and coarse (see Fig. 3). As a result, the NO2 AMF determined within the various scenarios with fine particles are very similar, and the same occurs for those with coarse aerosol. When comparing to the scenario without aerosol it was found that fine particles have a higher impact on intensifying the
changes on the AMF than the coarse ones. However, this effect depends on many
25
AMTD
2, 3221–3264, 2009Aerosol impact on the NO2 airmass
factor
J. Leit ˜ao et al.
Title Page
Abstract Introduction
Conclusions References
Tables Figures
◭ ◮
◭ ◮
Back Close
Full Screen / Esc
Printer-friendly Version
Interactive Discussion
is a consequence of the reduction of available light when such aerosol is present in the atmosphere. It is also important to note that at 440 nm the Rayleigh optical thickness is 0.32. Consequently, in scenarios I and N, the molecular scattering dominates.
3.1 Changes in boundary layer height
The height of the boundary layer differs for different locations and is also dependent on
5
seasonal variations. To investigate the effect of BL height changes alone, a study was carried out varying this height to 0.6, 1.0 and 2.0 km, and maintaining both the NO2 and aerosol homogenously distributed in this layer. In Fig. 5 the results obtained for urban fine and coarse aerosol with different aerosol optical thickness are presented.
These results show that an increase of the BL height leads to an increase of AMF
10
values. Consequently, if a too low the BL height is assumed in the retrieval, the
tro-pospheric columns of NO2 will be overestimated. The AMF increases by about 20%
when the boundary layer top changes from 0.6 to 2.0 km. The largest effect was found for the simulation with coarse aerosol and optical thickness of 0.1 with 37% variation, at 440 nm. Interestingly, the effect seems to decrease with growing aerosol load. Such
15
a variation is probably a result of the increase in scattering (and therefore the effective albedo) which will improve the sensitivity of the satellite measurements to the lower atmosphere. For every case it was found that the smallest AMFs are determined for the conditions without aerosol (not shown). Thus, one can conclude that, in these scenarios, the presence of aerosol contributes to an increase of the sensitivity of the
20
measurements, even if quite small for coarse particles and low aerosol load. In prac-tice, this indicates that, for the cases exemplified here, if aerosol is not accounted for in the retrieval, the NO2VC will be overestimated.
The figure also reveals, as mentioned above, the difference in behaviour between fine and coarse particles. The AMFs resulting from the simulations with fine aerosol
25
AMTD
2, 3221–3264, 2009Aerosol impact on the NO2 airmass
factor
J. Leit ˜ao et al.
Title Page
Abstract Introduction
Conclusions References
Tables Figures
◭ ◮
◭ ◮
Back Close
Full Screen / Esc
Printer-friendly Version
Interactive Discussion
scattering on fine particles (see phase function in Fig. 3) which increases the ratio of photons scattered towards the satellite under this observation geometry and therefore improves the sensitivity.
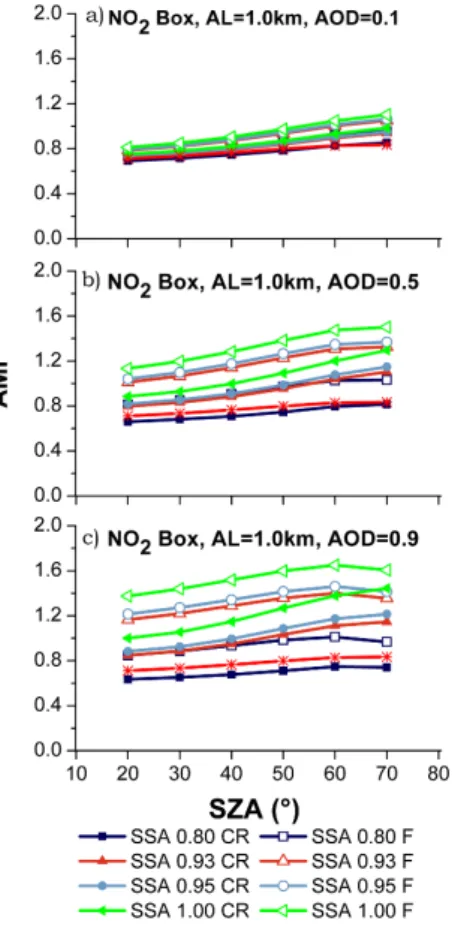
3.2 Changes in extension of aerosol layer
In the previous section, NO2and aerosol had the same vertical profiles representing a
5
situation where both are well mixed. In the following scenarios, the vertical extension of the aerosol layer was varied while the NO2profile was kept constant. This was done for two NO2profiles, a simple 1.0 km box profile and the more realistic urban profile as modelled by CHIMERE. Figure 6 shows the results side by side for different AODs.
As it can be observed, in general, any aerosol mixed with the trace gas tends to
en-10
hance the NO2signal, indicating that an overestimation of the NO2VC will likely occur when the aerosol presence is neglected in the retrieval. However, the magnitude of the influence does vary as it depends on the relative position of trace gas and aerosol, in particular the aerosol load above the trace gas. In addition, the size of the particles also plays a role in the calculations. As for the box profiles discussed above, at the
15
same AOD, fine particles have a larger influence on the airmass factors, due to the generally higher backscattering (see Fig. 3).
In the simulations with box profiles, the interplay between reduction and enhance-ment of sensitivity can explain the observed variations: if the aerosol layer is close to the surface, i.e. with its top at 600 m, below the top of the trace gas layer, the sensitivity
20
will be enhanced due to higher reflectivity and multiple scattering. An increase of the AMF by 11% on average is found when the top of aerosol layer lowers from 1.0 km to the 600 m and, in the case of highly polluted scenes with AOD=0.9, the difference be-tween the values can be as high as 25%. Compared to the simulation without aerosol, the sensitivity can be enhanced by up to a factor of two. On the other hand, when the
25
AMTD
2, 3221–3264, 2009Aerosol impact on the NO2 airmass
factor
J. Leit ˜ao et al.
Title Page
Abstract Introduction
Conclusions References
Tables Figures
◭ ◮
◭ ◮
Back Close
Full Screen / Esc
Printer-friendly Version
Interactive Discussion
cancels the enhancement of sensitivity in the lower part. Still, compared to the AMF values obtained without aerosol, the fine particles will slightly increase the NO2signal, with the exception of high solar zenith angles. In comparison, the coarse particles have smaller influence on the measurements.
The differences found in the AMFs calculated with AOD=0.1 and higher values
indi-5
cate the importance of using the right AOD in the retrieval. An underestimation of the AOD will lead to an overestimation of the VC. The scenario F (aerosol layer extending to 2.0 km) is an exception to this statement as the AMF values do not vary much for different AODs.
In qualitative terms, the interpretation of the scenarios with the urban NO2profile is
10
quite similar. However, for the latter, the AMF values are smaller as the NO2 is more concentrated at the surface where the satellite sensitivity is the smallest. This is directly observed in the “no aerosol” case where the AMF decreases from 0.81 (at 440 nm and 40◦SZA) to 0.70 (due to the shielding e
ffect related to Rayleigh scattering). In addition, shielding effect of aerosols is also more pronounced for the NO2urban profile than for
15
the 1.0 km box one, leading to an overall reduced effect of aerosols. In the case with an aerosol layer of coarse particles above the NO2, even a slight decrease in the AMF is observed. Thus overall the importance of aerosols is reduced if a more realistic NO2 profile is assumed.
The model profiles were also combined with aerosol profiles derived from
measure-20
ments in background areas (scenario I) and urban environments (scenarios J and K). The results are shown in Fig. 7 for calculations assuming fine and coarse particles sep-arately. Clearly, in these particular circumstances, the aerosol effect is much smaller than before, and very close to zero in the case of typical background profiles for both the NO2and aerosol. Independently of its detailed shape, the presence of an aerosol
25
AMTD
2, 3221–3264, 2009Aerosol impact on the NO2 airmass
factor
J. Leit ˜ao et al.
Title Page
Abstract Introduction
Conclusions References
Tables Figures
◭ ◮
◭ ◮
Back Close
Full Screen / Esc
Printer-friendly Version
Interactive Discussion
depend on the vertical distribution or total load of the aerosol but the combined effect of both, aerosol and NO2distribution. For coarse particles all the AMFs were smaller than for the case without aerosol, indicating that the aerosol might be preventing light from reaching down lower into the NO2 layer close to the surface (or back from this layer to the satellite instrument).
5
3.3 Changes in the position of the aerosol layer
The transport of dust plumes into European and certain Asian cities is not a rare event. Similarly, aerosol emitted from biomass burning events can undergo long-range trans-port and reach regions with anthropogenic pollution. These plumes are not only ob-served in the free troposphere but can, sporadically, make a large contribution to the
10
aerosol load measured in the boundary layer. Scenarios D, E and G (see Table 1) are simplified representations of such events with aerosol mostly being concentrated at higher altitudes. The results from these runs lead to the same conclusions as be-fore, i.e. an aerosol layer standing above the trace gas obstructs the observation from space (see Fig. 8). A decrease of 6% to∼70% is observed when comparing the AMFs
15
obtained for the scenario without aerosol and that with aerosol distributed from 1.0 to 2.0 km. This reduction is higher for larger aerosol load, i.e. optical thickness of 0.9. If such plumes, standing in high altitudes, are not accounted for in the retrieval process, the tropospheric VCs are underestimated. The differences of the results for the layers 1.0 to 2.0 km and 2.0 to 3.0 km (not presented here) were not significant. This indicates
20
that the height of the aerosol layer is not so relevant for the sensitivity of the measure-ments when there is no overlap of the layers of trace gas and aerosol. Contrary to this, in the case of aerosol mixed with NO2in the top of the layer (from 0.6 to 1.0 km) it was possible to notice (Fig. 8) that the particles do not interfere much with the mea-surements of the trace gas (cancelling of albedo and shielding effect). In fact, only with
25
small particles present will a slight enhancement (∼10% maximum) of the columns be
AMTD
2, 3221–3264, 2009Aerosol impact on the NO2 airmass
factor
J. Leit ˜ao et al.
Title Page
Abstract Introduction
Conclusions References
Tables Figures
◭ ◮
◭ ◮
Back Close
Full Screen / Esc
Printer-friendly Version
Interactive Discussion
a biomass burning plume will be quite different than that on NO2in the boundary layer as discussed here.
In a more realistic scenario, aerosols are also present close to surface in urban ar-eas. Therefore, profiles have been defined to include both the local plumes and those of long-range transport from biomass burning smoke or desert dust (e.g. scenarios L
5
and P from Table 2). An example of these results is presented in Fig. 9 for desert dust layers and fire plumes measured over different cities across the globe. As it can be seen from these findings, the effect of the aerosol layers transported above polluted areas can be quite different. Once more, the reduction in the sensitivity of the mea-surements, when compared with the “no aerosol” case, can be negligible or as large
10
as∼110% (for scenario O). This pronounced reduction is caused by the combination
of several factors: the large optical depth of the aerosol (AOD=1.05); its absorbing nature (ω0= 0.92); and the small fraction of particles that are mixed with the trace gas. This distribution of aerosol is the main difference between scenario L and O. The aerosol close to the surface present in scenario L may contribute to the cancelling of
15
the shielding effect and therefore explain the large discrepancy between the results of the scenarios. In the case of simulations M, N and P the AMFs are not so reduced mainly because of the lower aerosol loads.
For the desert dust cases, only coarse aerosol was considered in the radiative trans-fer calculations but both fine and coarse (not presented here) particles were used for
20
the biomass burning situations. The difference in the AMF calculated with each of the aerosol types is in the order of 20–25% with the higher values obtained for the runs with fine aerosol.
3.4 Changes in single scattering albedo
As mentioned above, for all the scenarios including box profiles the AMF were
cal-25
AMTD
2, 3221–3264, 2009Aerosol impact on the NO2 airmass
factor
J. Leit ˜ao et al.
Title Page
Abstract Introduction
Conclusions References
Tables Figures
◭ ◮
◭ ◮
Back Close
Full Screen / Esc
Printer-friendly Version
Interactive Discussion
and 0.95. These results are presented for both the simulations performed with the box profiles in scenario C (Fig. 10) and scenarios J and O (Fig. 11) where the NO2 mod-elled profiles and measured aerosol vertical distribution were considered (see Table 1 and Table 2 for more details on scenarios definitions). As expected, the SSA can have a great impact on the calculation of the AMF. An increase in the absorbing properties
5
of the aerosol (SSA decreases from 0.95 to 0.8) results in a general decrease of the AMF. While for low aerosol load the increase is in the order of 5–10%, in the highly polluted atmosphere with AOD=1.05 the effect of SSA on the AMF can be as high as 84%. Still, the variation of the AMF values is not only dependent on the aerosol amount but also on the profiles considered. The variation of the AMF caused by the changes
10
in the SSA values was found to vary for different aerosol vertical distributions.
4 Conclusions
Aerosols can have a significant impact on the retrieval of tropospheric trace gases us-ing UV/visible nadir measurements from space. In order to identify and quantify this impact, the effects of different aerosol parameters were investigated using both
ide-15
alised and realistic scenarios. Overall, a large variability in the results was observed with examples of both, increases and decreases of sensitivity. The most important fac-tors for the satellite sensitivity are the relative vertical distribution of aerosol and NO2, the AOD and the SSA. On the other hand, it was concluded that detailed differentiation of the size distribution of the aerosol is not a priority for the retrieval process. Diff
er-20
ences in the airmass factors were found when applying either coarse or fine aerosol. However, no large differences were evident when considering diverse size distributions within the two main types.
Variations of the vertical extension of a well mixed boundary layer of 1.0 km can result in large differences (max. 26%) of the airmass factors calculated, especially
25
AMTD
2, 3221–3264, 2009Aerosol impact on the NO2 airmass
factor
J. Leit ˜ao et al.
Title Page
Abstract Introduction
Conclusions References
Tables Figures
◭ ◮
◭ ◮
Back Close
Full Screen / Esc
Printer-friendly Version
Interactive Discussion
contribute to the inaccuracy of the calculated columns. The determined AMFs indicate that, if the boundary layer height is underestimated in the a priori, the tropospheric NO2 column will be overestimated (and vice-versa).
Aerosol mixed with the trace gas, even if only partly, will, by means of increased ef-fective albedo and multiple scattering, enhance the NO2signal. In contrast, any aerosol
5
layer that stands above the trace gas will act as a shield decreasing the sensitivity of the measurements. If an elevated aerosol layer is not accounted for, the computed NO2 columns will be too small, and this underestimation can be quite high. The magnitude of these effects will be determined by the relative vertical distribution of aerosol and NO2. A balance between enhancement and reduction of the signal will occur when the
10
aerosol is both mixed with and above the NO2 layer. As two examples, the AMF for a 1.0 km layer of NO2increases by a factor of two when mixed with a 600 m high aerosol layer of AOD 0.9, while for the case with an aerosol layer of AOD 0.1 between 2.0 to 3.0 km the AMF is reduced by∼78%.
The absorption properties of the particles also play an important role in the retrieval
15
of the trace gas. The largest airmass factors were always obtained for the purely scattering aerosol (ω0=1). A decreasing SSA reduces the measurement sensitivity. For highly polluted scenes (AOD>0.9) the airmass factor can change by a factor of 1.5 and more when the single scattering albedo is modified from 0.80 to 0.95.
When more realistic vertical profiles were applied for both NO2and aerosols, a much
20
smaller effect of aerosol was observed. Large decreases of the sensitivity of the mea-surements were found only for elevated or largely extended aerosol layers. These sit-uations usually correspond to cases of biomass burning events or desert dust storms. For the urban scenes the changes in the airmass factors were rather small, indicating that in these circumstances, the uncertainties introduced by neglecting the aerosol
im-25
AMTD
2, 3221–3264, 2009Aerosol impact on the NO2 airmass
factor
J. Leit ˜ao et al.
Title Page
Abstract Introduction
Conclusions References
Tables Figures
◭ ◮
◭ ◮
Back Close
Full Screen / Esc
Printer-friendly Version
Interactive Discussion
In the present study, only clear sky cases have been considered. For partially cloudy scenes the results would differ in particular if the data are corrected for cloud effects. The presence of aerosols will also impact on the retrieved cloud properties as dis-cussed in Boersma et al. (2004). Bearing in mind that for many scenarios evaluated here the effect of aerosols is to enhance the measurement sensitivity, it is not clear if
5
the resulting increase in cloud fraction and cloud top pressure would actually compen-sate the effect of aerosols or rather enhance it.
The continuing use of fossil fuels and biomass burning in a changing climate will result in changes in the amounts and distribution of NOx which is one of the key pre-cursors for tropospheric ozone. To assess accurately these changes and the efficiently
10
allocate efforts to mitigate pollution, precise knowledge of the global tropospheric col-umn of NO2 is essential. This study shows that to improve our current knowledge of the global distributions of tropospheric NO2, and its evolution, improved knowledge of the aerosol properties are required. These include the vertical profile, AOD, size distri-bution and also the scattering/absorption properties of the particles. Such data would
15
preferably come from simultaneous measurements of trace gas and aerosol properties from space or alternatively from a combination of satellite and ground-based measure-ments with model predictions.
Acknowledgements. This study was in part supported by the GEMS project funded by the Euro-pean Commission as part of its Sixth Framework Programme and by the University of Bremen.
20
We acknowledge the AERONET and EARLINET networks for the provision of aerosol datasets used in this study. In addition, we would like to thank Chieko Kittaka and David Winker who kindly provided CALIPSO climatologies. Finally, we would like to thank V. Rozanov, A. Rozanov and further SCIATRAN developers for the provision of the model and support throughout the study.
AMTD
2, 3221–3264, 2009Aerosol impact on the NO2 airmass
factor
J. Leit ˜ao et al.
Title Page
Abstract Introduction
Conclusions References
Tables Figures
◭ ◮
◭ ◮
Back Close
Full Screen / Esc
Printer-friendly Version
Interactive Discussion References
Akimoto, H.: Global air quality and pollution, Science, 302, 1716–1719, 2003.
Amiridis, V., Balis, D. S., Giannakaki, E., Stohl, A., Kazadzis, S., Koukouli, M. E., and Zanis, P.: Optical characteristics of biomass burning aerosols over Southeastern Europe determined from UV-Raman lidar measurements, Atmos. Chem. Phys., 9, 2431–2440, 2009,
5
http://www.atmos-chem-phys.net/9/2431/2009/. ˚
Angstr ¨om, A.: On the atmospheric transmission of Sun radiation and on dust in the air, Geogr. Ann., 11, 156–166, 1929.
Ansmann, A., Baars, H., Tesche, M., M ¨uller, D., Althausen, D., Engelmann, R., Paulique-vis, T., and Artaxo, P.: Dust and smoke transport from Africa to South America: Lidar
10
profiling over Cape Verde and the Amazon rainforest, Geophys. Res. Lett., 36, L11802, doi:10.1029/2009GL037923, 2009.
Balis, D. S., Amiridis, V., Zerefos, C., Gerasopoulos, E., Andreae, M., Zanis, P., Kazantzidis, A., Kazadzis, S., and Papayannis, A.: Raman lidar and sunphotometric measurements of aerosol optical properties over Thessaloniki, Greece during a biomass burning episode,
At-15
mos. Environ., 37, 4529–4538, 2003.
Beirle, S., Platt, U., von Glasow, R., Wenig, M., and Wagner, T.: Estimate of nitrogen ox-ide emissions from shipping by satellite remote sensing, Geophys. Res. Lett., 31, L18102, doi:10.1029/2004GL020312, 2004.
Beirle, S., Salzmann, M., Lawrence, M. G., and Wagner, T.: Sensitivity of satellite observations
20
for freshly produced lightning NOx, Atmos. Chem. Phys., 9, 1077–1094, 2009,
http://www.atmos-chem-phys.net/9/1077/2009/.
B ´ezy, J.-L., Delwart, S., and Rast, M.: MERIS – a new generation of ocean colour sensor onboard ENVISAT, ESA Bull., 103, 48–56, 2000.
Boersma, K. F., Eskes, H. J., and Brinksma, E. J.: Error analysis for tropospheric NO2retrieval
25
from space, J. Geophys. Res., 109, D04311, doi:10.1029/2003JD003962, 2004.
Boersma, K. F., Eskes, H. J., Veefkind, J. P., Brinksma, E. J., van der A, R. J., Sneep, M., van den Oord, G. H. J., Levelt, P. F., Stammes, P., Gleason, J. F., and Bucsela, E. J.: Near-real time retrieval of tropospheric NO2from OMI, Atmos. Chem. Phys., 7, 2103–2118, 2007,
http://www.atmos-chem-phys.net/7/2103/2007/.
AMTD
2, 3221–3264, 2009Aerosol impact on the NO2 airmass
factor
J. Leit ˜ao et al.
Title Page
Abstract Introduction
Conclusions References
Tables Figures
◭ ◮
◭ ◮
Back Close
Full Screen / Esc
Printer-friendly Version
Interactive Discussion
Bovensmann, H., Burrows, J. P., Buchwitz, M., Frerick, J., Noel, S., Rozanov, V. V., Chance, K. V., and Goede, A. P. H.: SCIAMACHY: Mission objectives and measurement modes, J. Atmos. Sci., 56(2), 127–150, doi:10.1175/1520-0469, 1999.
Burrows, J. P., Holzle, E., Goede, A. P. H., Visser, H., and Fricke, W.: SCIAMACHY – Scanning Imaging Absorption Spectrometer for Atmospheric Chartography, Acta Astronaut., 35, 445–
5
451, 1995.
Burrows, J. P., Weber, M., Buchwitz, M., Rozanov, V., Ladst ¨atter-Weißenmayer, A., Richter, A., DeBeek, R., Hoogen, R., Bramstedt, K., Eichmann, K.-U., Eisinger, M., and Perner, D.: The Global Ozone Monitoring Experiment (GOME): Mission concept and first scientific results, J. Atmos. Sci., 56(2), 151–175, doi:10.1175/1520-0469, 1999.
10
Callies, J., Corpaccioli, E., Eisinger, M., Hahne, A., and Lefebvre, A.: GOME-2 – Metop’s second generation sensor for operational ozone monitoring, ESA Bull., 102, 28–36, 2000. Chang, D., Song, Y., and Liu, B.: Visibility trends in six megacities in China 1973–2007, Atmos.
Res., 94, 161–167, 2009.
Chazette, P., Randriamiarisoa, H., Sanak, J., Couvert, P., and Flamant, C.: Optical properties of
15
urban aerosol from airborne and ground-based in situ measurements performed during the Etude et Simulation de la Qualit ´e de l’air en Ile de France (ESQUIF) program, J. Geophys. Res., 110, D02206, doi:10.1029/2004JD004810, 2005.
Chen, D., Zhou, B., Beirle, S., Chen, L. M., and Wagner, T.: Tropospheric NO2column densities
deduced from zenith-sky DOAS measurements in Shanghai, China, and their application to
20
satellite validation, Atmos. Chem. Phys., 9, 3641–3662, 2009, http://www.atmos-chem-phys.net/9/3641/2009/.
Damoah, R., Spichtinger, N., Forster, C., James, P., Mattis, I., Wandinger, U., Beirle, S., Wag-ner, T., and Stohl, A.: Around the world in 17 days – hemispheric-scale transport of forest fire smoke from Russia in May 2003, Atmos. Chem. Phys., 4, 1311–1321, 2004,
25
http://www.atmos-chem-phys.net/4/1311/2004/.
Diner, D. J., Beckert, J. C., Reilly, T. H. Bruegge, C. J., Conel, J. E., Kahn, R. A., Martonchik, J. V., Ackerman, T. P., Davies, R., Gerstl, S. A. W., Gordon, H. R., Muller, J.-P., Myneni, R. B., Sellers, P. J., Pinty, B., and Verstraete, M. M.: Multi-angle Imaging Spectroradiometer (MISR) instrument description and experiment overview, IEEE Trans. Geosci. Remote, 36,
30
AMTD
2, 3221–3264, 2009Aerosol impact on the NO2 airmass
factor
J. Leit ˜ao et al.
Title Page
Abstract Introduction
Conclusions References
Tables Figures
◭ ◮
◭ ◮
Back Close
Full Screen / Esc
Printer-friendly Version
Interactive Discussion
Dubovik, O., Holben, B., Eck, T. F., Smirnov, A., Kaufman, Y. F., King, M. D., Tanr ´e, D., and Slutsker, I.: Variability of absorption and optical properties of key aerosol types observed in worldwide locations, J. Atmos. Sci., 59, 590–608, 2002.
Gloudemans, A. M. S., Schrijver, H., Hasekamp, O. P., and Aben, I.: Error analysis for CO and CH4total column retrievals from SCIAMACHY 2.3µm spectra, Atmos. Chem. Phys., 8,
5
3999–4017, 2008,
http://www.atmos-chem-phys.net/8/3999/2008/.
Heckel, A., Kim, S.-W., Frost, G. J., Richter, A., Trainer, M., and Burrows, J. P.: Influence of under-sampling in a priori data on tropospheric NO2satellite retrievals, Atmos. Meas. Tech.
Discuss., to be submitted, 2009.
10
Hild, L., Richter, A., Rozanov, V., and Burrows, J. P.: Air mass factor calculations for GOME measurements of lightning-produced NO2, Adv. Space Res., 29(11), 1685–1690, 2002.
Holben, B. N., Eck, T. F., Slutsker, I., Tanr ´e, D., Buis, J. P., Setzer, A., Vermote, E., Reagan, J. A., Kaufman, Y., Nakajima, T., Lavenu, F., Jankowiak, I., and Smirnov, A.: AERONET – A federated instrument network and data archive for aerosol characterization, Remote Sens.
15
Environ., 66, 1–16, 1998.
Honor ´e, C., Rou¨ıl, L., Vautard, R., Beekmann, M., Bessagnet, B., Dufour, A., Elichegaray, C., Flaud, J.-M., Malherbe, L., Meleux, F., Menut, L., Martin, D., Peuch, A., Peuch, V. H., and Poisson, N.: Predictability of European air quality: The assessment of three years of oper-ational forecasts and analyses by the PREV’AIR system, J. Geophys. Res., 113, D04301,
20
doi:10.1029/2007JD008761, 2008.
Hu, R.-M., Martin, R. V., and Fairlie, T. D.: Global retrieval of columnar aerosol sin-gle scattering albedo from spacebased observations, J. Geophys. Res., 112, D02204, doi:10.1029/2005JD006832, 2007.
Husar, R. B., Prospero, J. M., and Stowe, L. L.: Characterization of tropospheric aerosols
25
over the oceans with the NOAA advanced very high resolution radiometer optical thickness operational product, J. Geophys. Res., 102(D14), 16889–16909, 1997.
IPCC: Climate Change 2007: The Physical Science Basis. Contribution of Working Group I to the Fourth Assessment Report of the Intergovernmental Panel on Climate Change, edited by: Solomon, S., Qin, D., Manning, M., Chen, Z., Marquis, M., Averyt, K. B., Tignor, M., and
30
AMTD
2, 3221–3264, 2009Aerosol impact on the NO2 airmass
factor
J. Leit ˜ao et al.
Title Page
Abstract Introduction
Conclusions References
Tables Figures
◭ ◮
◭ ◮
Back Close
Full Screen / Esc
Printer-friendly Version
Interactive Discussion
King, M. D., Kaufman, Y. J., Menzel, W. P., and Tanr ´e, D.: Remote-sensing of cloud, aerosol, and water-vapor properties from the Moderate Resolution Imaging Spectrometer (MODIS), IEEE Trans. Geosci. Remote, 30(1), 2–27, 1992.
Kokhanovsky, A. A. and Rozanov, V. V.: Retrieval of NO2vertical columns under cloudy
con-ditions: A sensitivity study based on SCIATRAN calculations, Atmos. Res., 93, 695–699,
5
2009.
Konovalov, I. B., Beekmann, M., Richter, A., and Burrows, J. P.: Inverse modelling of the spatial distribution of NOxemissions on a continental scale using satellite data, Atmos. Chem. Phys.,
6, 1747–1770, 2006, http://www.atmos-chem-phys.net/6/1747/2006/.
Konovalov, I. B., Beekmann, M., Burrows, J. P., and Richter, A.: Satellite measurement based
10
estimates of decadal changes in European nitrogen oxides emissions, Atmos. Chem. Phys., 8, 2623–2641, 2008, http://www.atmos-chem-phys.net/8/2623/2008/.
Krueger, A., Walter, L., Bhartia, P. K., Schnetzler, C., Krotkov, N., Sprod, I., and Bluth, G.: Vol-canic sulfur dioxide measurements from the total ozone mapping spectrometer instruments, J. Geophys. Res., 100(D7), 14057–14076, 1995.
15
Labonne, M., Br ´eon, F.-M., and Chevallier, F.: Injection height of biomass burning aerosols as seen from a spaceborne lidar, Geophys. Res. Lett., 34, L11806, doi:10.1029/2007GL029311, 2007.
Lee, C., Martin, R. V., van Donkelaar, A., O’Byrne, G., Krotkov, N., Richter, A., Huey, G., and Holloways, J. S.: Retrieval of vertical columns of sulfur dioxide from SCIAMACHY and
20
OMI: Air mass factor algorithm development and validation, J. Geophys. Res., 114, D22303, doi:10.1029/2009JD012123, 2009.
Leue, C., Wenig, M., Wagner, T., Klimm, O., Platt, U., and J ¨ahne, B.: Quantitative analysis of emissions from Global Ozone Monitoring Experiment satellite image sequences, J. Geophys. Res., 106(D6), 5493–5505, 2001.
25
Levelt, P. F., van den Oord, G. H. J., Dobber, M. R., M ¨alkki, A., Visser, H., de Vries, J., Stammes, P., Lundell, J. O. V., and Saari, H.: The Ozone Monitoring Instrument, IEEE Trans. Geosci. Remote, 44(5), 1093–1101, doi:10.1109/TGRS.2006.872333, 2006.
Martin, R. V., Chance, K., Jacob, D. J., Kurosu, T. P., Spurr, R. J. D., Bucsela, E., Gleason, J. F., Palmer, P. I., Bey, I., Fiore, A. M., Li, Q., Yantosca, R. M., and Koelemeijer, R. B. A.: An
30