ACPD
15, 5619–5662, 2015What’s the real role of iron-oxides
X. L. Zhang et al.
Title Page
Abstract Introduction
Conclusions References
Tables Figures
◭ ◮
◭ ◮
Back Close
Full Screen / Esc
Printer-friendly Version Interactive Discussion
Discussion
P
a
per
|
Discussion
P
a
per
|
Discussion
P
a
per
|
Discussion
P
a
per
|
Atmos. Chem. Phys. Discuss., 15, 5619–5662, 2015 www.atmos-chem-phys-discuss.net/15/5619/2015/ doi:10.5194/acpd-15-5619-2015
© Author(s) 2015. CC Attribution 3.0 License.
This discussion paper is/has been under review for the journal Atmospheric Chemistry and Physics (ACP). Please refer to the corresponding final paper in ACP if available.
What’s the real role of iron-oxides in the
optical properties of dust aerosols?
X. L. Zhang1,2, G. J. Wu2, C. L. Zhang3, T. L. Xu2,4, and Q. Q. Zhou1
1
Key laboratory of Wetland Ecology and Environment, Northeast Institute of Geography and Agroecology, Chinese Academy of Sciences, Changchun 130102, China
2
Key Laboratory of Tibetan Environment Changes and Land Surface Processes, Institute of Tibetan Plateau Research, CAS Center for Excellence and Innovation in Tibetan Plateau Earth System Sciences, Chinese Academy of Sciences, Beijing 100101, China
3
Research Center for Eco-Environmental Sciences, Chinese Academy of Sciences, Beijing, 100085, China
4
University of Chinese Academy of Sciences, Beijing 100049, China
Received: 16 January 2015 – Accepted: 9 February 2015 – Published: 26 February 2015
Correspondence to: X. L. Zhang ([email protected]) and G. J. Wu ([email protected])
ACPD
15, 5619–5662, 2015What’s the real role of iron-oxides
X. L. Zhang et al.
Title Page
Abstract Introduction
Conclusions References
Tables Figures
◭ ◮
◭ ◮
Back Close
Full Screen / Esc
Printer-friendly Version Interactive Discussion
Discussion
P
a
per
|
Discussion
P
a
per
|
Discussion
P
a
per
|
Discussion
P
a
per
|
Abstract
Iron oxides compounds constitute an important component of mineral dust aerosol. Several previous studies have shown that these minerals are strong absorbers at vis-ible wavelengths and thus that they play a critical role in the overall climate forcing caused by dust aerosol. When compiling a database of complex refractive indices of
5
possible mineral species of iron-oxides to study their optical properties, we found that uniformly continuous optical constants for a single type of iron-oxides in the wavelength range between 0.2 and 50 µm is very scarce and that the use of hematite to represent all molecular or mineral iron-oxides types is a popular hypothesis. However, the crucial problem is that three continuous datasets for complex refractive indices of hematite
10
are employed in climate models, but there are significant differences between them. Thus, the real role of iron-oxides in the optical properties of dust aerosols becomes a key scientific question, and we address this problem by considering different refrac-tive indices, size distributions, and more logical weight fractions and mixing states of hematite. Based on the microscopic observations, a semi-external mixture that
em-15
ploys an external mixture between Fe-aggregates and other minerals and partly inter-nal mixing between iron-oxides and aluminosilicate particles is advised as the optimal approximation. The simulations demonstrate that hematite with a spectral refractive in-dices from Longtin et al. (1988) shows approximately equal absorbing capacity to the mineral illite over the whole wavelength region from 0.55 to 2.5 µm, and only enhances
20
the optical absorption of aerosol mixture atλ <0.55 µm. Using the dataset from Querry (1985) may overestimate the optical absorption of hematite at both visible and near-infrared wavelengths. More laboratory measurements of the refractive index of iron-oxides, especially for hematite and goethite in the visible spectrum, should therefore be taken into account when assessing the effect of mineral dust on climate forcing.
ACPD
15, 5619–5662, 2015What’s the real role of iron-oxides
X. L. Zhang et al.
Title Page
Abstract Introduction
Conclusions References
Tables Figures
◭ ◮
◭ ◮
Back Close
Full Screen / Esc
Printer-friendly Version Interactive Discussion
Discussion
P
a
per
|
Discussion
P
a
per
|
Discussion
P
a
per
|
Discussion
P
a
per
|
1 Introduction
Iron oxides in dusts are now identified as being important component for a number of climatic, environmental and biological processes. Over the past decade, iron-oxide minerals have been shown to be able to strongly absorb solar radiation (Tegen et al., 1997; Sokolik and Toon, 1999; Lafon et al., 2004; Qin and Mitchell, 2009; Redmond
5
et al., 2010), and thus have a direct impact on the Earth’s radiation balance (Balkanski et al., 2007; Scanza et al., 2015; Smith and Grainger, 2014). Based on the ability to absorb acidic gases and water vapor (Baltrusaitis et al., 2007; Wijenayaka et al., 2012; Song and Boily, 2013), iron oxides also contribute to heterogeneous reactions and cloud processes (Shi et al., 2011; Dupart et al., 2012), further influencing the radiation
10
balance. In particular, layers of dust on snow and ice cover accelerate the melting of snow and ice by diminishing the surface albedo (Painter et al., 2010; Ginot et al., 2014) and the heat-absorbing properties of iron oxides in these dust layers can add to this effect (Kaspari et al., 2014; Reynolds et al., 2013; Dang and Hegg, 2014). Moreover, the deposited iron-bearing dust aerosols provide critical nutrients to marine and terrestrial
15
ecosystems, which associated with consequential important drawdown of atmospheric carbon dioxide (Jickells et al., 2005; Shao et al., 2011; Nickovic et al., 2013). However, these effects can lead to either positive or negative net radiative forcing. This large uncertainty results from our limited knowledge of the physical, chemical and optical properties of atmospheric iron oxides on various space and time scales (Tegen et al.,
20
1997; Sokolik et al., 2001; Formenti et al., 2011).
The element iron can be found among numerous mineralogical species, such as feldspars, clays (e.g. illite, smectite, chlorite and biotite), iron-oxides, iron-hydroxides and so on. A useful mineralogical classification frequently used in soil science distin-guishes two categories of iron: (i) “structural iron” (in either the Fe(II) or Fe(III)
oxida-25
ACPD
15, 5619–5662, 2015What’s the real role of iron-oxides
X. L. Zhang et al.
Title Page
Abstract Introduction
Conclusions References
Tables Figures
◭ ◮
◭ ◮
Back Close
Full Screen / Esc
Printer-friendly Version Interactive Discussion
Discussion
P
a
per
|
Discussion
P
a
per
|
Discussion
P
a
per
|
Discussion
P
a
per
|
Anderson and Jenne, 1970; Angel and Vincent, 1978), the latter kind of iron will be re-ferred to as free-iron and its corresponding oxides and hydroxides as iron-oxides. Ten of 16 known iron oxides, hydroxides and oxide-hydroxides are known occur in nature, with goethite, hematite and magnetite being the most abundant as rock-forming miner-als; ferrihydrite, maghemite and lepidocrocite being intermediately abundant in many
5
locations; and wüstite, akaganéite, feroxyhyte, and bernalite being the least abundant (Cornell and Schwertmann, 2006; Guo and Barnard, 2013). Dust aerosols from arid and semi-arid regions typically contain goethite, hematite, ferrihydrite and magnetite, and based on the mass contribution, hematite and goethite are the major components of free-iron in the atmospheric dust aerosols (Schroth et al., 2009; Shi et al., 2012;
10
Takahashi et al., 2013). Hematite (Fe2O3) is very common in hot, dry soils and imparts a red color to its sediments. Goethite (α-FeOOH) is a common weathered product in soils and loesses. It occurs in moist, acidic soils (Schwertmann, 1993), and is brown to yellow in color.
Sokolik and Toon (1999) found that hematite is an especially strong absorber at
15
ultra-violet (UV) and visible wavelengths, and it can also enhance the absorption of clay minerals and quartz through the formation of aggregates. Derimian et al. (2008) mentioned that iron oxides (primarily hematite and goethite) only affect the optical ab-sorbing ability of aeolian dust at short wavelengths (the blue spectral region). Since the importance of hematite relative to other dust mineral components was discussed
20
more fully in the study of Sokolik and Toon (1999), most subsequent modeling stud-ies have assumed the iron-oxides in dust aerosols to be in the form of hematite. An opposite viewpoint was put forward, however, by Balkanski et al. (2007) who have ar-gued that the optical absorption of dust with hematite at visible wavelengths might be lower than previous thought. The main reason is that internal mixing rule calculations
25
ACPD
15, 5619–5662, 2015What’s the real role of iron-oxides
X. L. Zhang et al.
Title Page
Abstract Introduction
Conclusions References
Tables Figures
◭ ◮
◭ ◮
Back Close
Full Screen / Esc
Printer-friendly Version Interactive Discussion
Discussion
P
a
per
|
Discussion
P
a
per
|
Discussion
P
a
per
|
Discussion
P
a
per
|
However, recent measurements on dust samples from east Asia, northern Africa and western Africa (Lafon et al., 2006; Formenti et al., 2008; Reynolds et al., 2014; Formenti et al., 2014) indicated that goethite was presented in higher concentration than hematite (i.e. the ratio of goethite to hematite is about 7 : 3, a result that will be detail introduced in Sect. 3.2.2). For dust in snow, goethite is also the dominant ferric
5
oxide that detected by reflectance spectroscopy and thus appears to be the main iron-oxide control on absorption of solar radiation (Reynolds et al., 2013). More recently hematite has been taken into account interactively in global climate simulations due to the availability of global mineralogical distribution maps (Nickovic et al., 2012; Journet et al., 2014), but this has been impracticable for geothite.
10
Furthermore, Müller et al. (2009) have measured the spectral imaginary refractive indices of hematite over the wavelengths from 590 to 790 nm during laboratory ex-periments, but these derived values are much lower than the data that employed in Sokolik and Toon (1999). The theoretical simulations of optical scattering of hematite and goethite at 470, 550, and 660 nm by Meland et al. (2011) also found that diff
er-15
ences are apparent for hematite in both the phase function and polarization results at 660 nm where the imaginary indices from different references differ. Additionally, two studies that refer to optical properties of hematite in dust samples have also argued that the imaginary values of hematite refractive index in Sokolik and Toon (1999) are more than a factor of 2 larger than those reported by Bedidi and Cervelle (1993) and
20
Longtin et al. (1988) at wavelengths below 600 nm (Moosmüller et al., 2012; Wagner et al., 2012).
Thus, what is the real role of iron-oxides in determining the overall impact of the optical properties of dust aerosols? This study will focus on investigating this impor-tant scientific question by considering heterogeneous optical refractive indices, mixing
25
ACPD
15, 5619–5662, 2015What’s the real role of iron-oxides
X. L. Zhang et al.
Title Page
Abstract Introduction
Conclusions References
Tables Figures
◭ ◮
◭ ◮
Back Close
Full Screen / Esc
Printer-friendly Version Interactive Discussion
Discussion
P
a
per
|
Discussion
P
a
per
|
Discussion
P
a
per
|
Discussion
P
a
per
|
2 Method and simulation
2.1 Complex refractive index
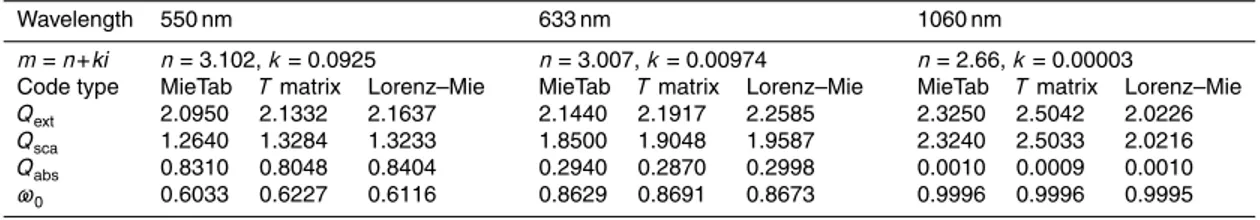
The complex refractive index (optical constant) is the most basic and significant pa-rameter for calculating the optical properties of aerosols, but values for the optical constants of hematite in the wavelength range 0.2 to 50 µm are scarce in published
5
references. Table 1 compiles information about the complex refractive indices of the major constituents of free-iron that we have found in the published literature. Sokolik and Toon (1999) employed the refractive indices of hematite from Querry et al. (1978), but Querry et al. (1978) mainly studied the optical constants of limestone and, as far as we can discover, do not contain any work on hematite at all. Since the publication of
10
Sokolik and Toon (1999), studies (Höller et al., 2003; Alfaro et al., 2004; Muñoz et al., 2006; Mishra and Tripathi, 2008; Otto et al., 2009; Meland et al., 2011; Wagner et al., 2012) have misquoted the data as Querry et al. (1978) or Querry (1987) when modeling the optical properties of hematite. Actually, Querry (1987) is entitled “Optical constants of minerals and other materials from the millimeter to the UV” and gives optical
con-15
stants of 29 materials, but still without referring to hematite. After careful searching, we have found that Querry (1985) has tabulated values for the refractive index (m=n+ki) of hematite. Moreover, Longtin et al. (1988) also reported spectral refractive indices for hematite from earlier measurements by Steyer (1974), Onari et al. (1977), Galuza et al. (1979) and Kerker et al. (1979). This dataset also has been used in modeling
20
the contribution of hematite to the optical properties of atmospheric dust aerosols in recent studies (Klaver et al., 2011a; Köhler et al., 2011; Hansell et al., 2011). Recently, the third unpublished continuous refractive indices of hematite (named TA2005 in Ta-ble 1) from the Aerosol Refractive Index Archive (ARIA) of Oxford University have been employed in the Community Atmosphere Model (Scanza et al., 2015). Because this
25
ACPD
15, 5619–5662, 2015What’s the real role of iron-oxides
X. L. Zhang et al.
Title Page
Abstract Introduction
Conclusions References
Tables Figures
◭ ◮
◭ ◮
Back Close
Full Screen / Esc
Printer-friendly Version Interactive Discussion
Discussion
P
a
per
|
Discussion
P
a
per
|
Discussion
P
a
per
|
Discussion
P
a
per
|
the optical constants would be directly refiected in the calculated results referred to above.
Bedidi and Cervelle (1993) also presented refractive indices for hematite and goethite derived from reflectance measurements at wavelengths of 350–750 nm. Glotch and Rogers (2007) reported the optical constants of hematite, goethite and
5
magnetite over the infrared (IR) wavelengths, and Hsu and Matijević(1985) also mea-sured the refractive indices of hematite in the wavelengths of 350–650 nm.
Hematite is a uniaxial crystal which crystallizes in the trigonal system, whose optic axis corresponds to the crystallographic c axis. Perpendicular to the c axis are two radiala axes. The dielectric constants of bulk hematite must therefore be measured
10
for two principal polarizations of the incident light, namely one with the electric vector in any direction perpendicular to thecaxis (the so-called ordinary ray or – O ray) and the other with the electric vector along the crystalline caxis (the extraordinary ray or – E ray). In this work we have calculated the average refractive indices for anisotropic hematite from all references in Table 1. The formula used is adopted from Longtin
15
et al. (1988) and is:
mavg=(2nE-ray/3+nO-ray/3)+(2kE-ray/3+kO-ray/3)i. (1)
The reported values for the complex refractive index from the sources in Table 1 are markedly different, especially the imaginary part which controls the optical absorption. In order to visually demonstrate the variation of optical constants from different
refer-20
ences, values of the real (n) and logarithmic values of imaginary parts (k) are shown in Fig. 1.
For the real part of the refractive index for iron-oxides, there is a reasonable agree-ment between the hematite and magnetite datasets from the different references (Fig. 1c). Because the real refractive index of hematite shows large fluctuations at
25
ACPD
15, 5619–5662, 2015What’s the real role of iron-oxides
X. L. Zhang et al.
Title Page
Abstract Introduction
Conclusions References
Tables Figures
◭ ◮
◭ ◮
Back Close
Full Screen / Esc
Printer-friendly Version Interactive Discussion
Discussion
P
a
per
|
Discussion
P
a
per
|
Discussion
P
a
per
|
Discussion
P
a
per
|
(1993) and the other at IR wavelengths from Glotch and Rogers (2007), but the wave-length gap between these two datasets hampers continuity. Unfortunately, Meland et al. (2011) have checked the former dataset for goethite using simulations accord-ing to Mie andT matrix theories and show that it may be in error. Nevertheless, we can see that goethite has optical constants similar to hematite. The real refractive index of
5
hematite is larger than that of magnetite at wavelengths less than 2 µm, but is smaller between 2 and 33 µm (Fig. 1c and d).
For the imaginary part of the refractive index of iron-oxides, hematite and goethite have different optical properties at short wavelengths, both in terms of magnitude and spectral dependence (Bedidi and Cervelle, 1993). Between 460 and 700 nm the
imag-10
inary part of the complex refractive index (representing absorption) of goethite is up to 3 times smaller than that of hematite. As a consequence, the proportions of hematite and goethite in mineral dust can potentially change the magnitude and the spectral dependence of shortwave absorption of mineral dust. However, the limited and dis-continuous refractive indices of goethite have constrained the evaluation of the effects
15
of specific compositions of goethite and hematite to dust optical properties and solar radiation balance over broader wavelength ranges.
From Fig. 1a, we clearly see that thek values for hematite from QE1985 and from LG1988 show significant differences for wavelengths between 650 nm and 15 µm. These differences are present at visible wavelengths and disappear at ultraviolet
20
wavelengths, but the two datasets have similar trends at UV and visible wavelengths (Fig. 1b). Note that the hematite optical constants vary dramatically across the visible wavelengths. In particular, the imaginary part of the index for hematite shows a sharp decrease with increasing wavelength in the red. As a consequence there is a large variability in the imaginary refractive index values for hematite taken from different
pub-25
ACPD
15, 5619–5662, 2015What’s the real role of iron-oxides
X. L. Zhang et al.
Title Page
Abstract Introduction
Conclusions References
Tables Figures
◭ ◮
◭ ◮
Back Close
Full Screen / Esc
Printer-friendly Version Interactive Discussion
Discussion
P
a
per
|
Discussion
P
a
per
|
Discussion
P
a
per
|
Discussion
P
a
per
|
2.2 Particle size distribution
Size distribution is another important factor that affects the optical properties of parti-cles. Because Sokolik and Toon (1999) has employed the refractive index dataset for hematite from LG1985 to calculate the radiative properties, we adopt here the same particle size distribution but with the refractive index dataset for hematite from LG1988
5
to compare our results with Sokolik and Toon (1999). The lognormal distribution is applied to dust aerosols:
nn(lnr)≡ dN d lnr =
N0
√
2πlnσexp "
−1
2 lnr
−lnr0
lnσ
2#
, (2)
where r0 is the median radius, σ is the geometric SD, and N0 is the total particle
number density of the component in particles per cubic centimeter.
10
The optical properties of minerals are calculated on the assumption that they have one size mode but varying median radius. The particle size modes are selected as r0=0.5 and 0.7 µm, and σ=2.0. The size mode with median radius r0=0.5 µm is
believed to be representative of the particle size distribution of the lived, long-distance-transport mode of airborne dust (Patterson and Gillette, 1977; Arimoto et al.,
15
1997). The larger r0 is representative of a particle size mode which occurs near the
dust source (Gomes and Gillette, 1993). In reality, the size distribution of dust aerosols can have one or several modes, characterized by a specific composition (Mahowald et al., 2013).
2.3 Theoretical simulations 20
ACPD
15, 5619–5662, 2015What’s the real role of iron-oxides
X. L. Zhang et al.
Title Page
Abstract Introduction
Conclusions References
Tables Figures
◭ ◮
◭ ◮
Back Close
Full Screen / Esc
Printer-friendly Version Interactive Discussion
Discussion
P
a
per
|
Discussion
P
a
per
|
Discussion
P
a
per
|
Discussion
P
a
per
|
moderate departures from spherical shape are relatively unimportant in determining the scattering matrix for particles with high refractive index values, such as hematite. Therefore, we expect the aerosol asphericity to have a negligible impact on our cal-culated results of optical properties and subsequent calculations using the Mie theory (which assumes a spherical morphology for the dust particles).
5
There are several different computer codes that can be used to compute optical properties for a lognormal particle size distribution. The theoretical light scattering sim-ulations in this paper have used the MieTab software. MieTab uses a FORTRAN code with continued fraction modification produced by W. J. Lentz from the Mie code origi-nally developed by Dave and Center (1968). This modified code can be obtained from
10
http://diogenes.iwt.uni-bremen.de/vt/laser/codes/ddave.zip. In order to validate the ac-curacy of MieTab, we firstly compared it with a double precision Lorenz–Mie scattering code and a double precision T matrix code for a lognormal particle size distribution from Mishchenko et al. (2002). The double precision Lorenz–Mie andT matrix codes are available from http://www.giss.nasa.gov/staff/mmishchenko/t_matrix.html.
15
In addition to the wavelength dependent optical constants and the size distribution, theT matrix theory also requires assumptions about the particle shape. In this work we use an aspect ratio of 1.000001 to represent a spherical particle shape, because use of an aspect ratio exactly equal to 1 causes computational overflow in some cases. The calculated results from the three codes at different wavelengths and complex refractive
20
ACPD
15, 5619–5662, 2015What’s the real role of iron-oxides
X. L. Zhang et al.
Title Page
Abstract Introduction
Conclusions References
Tables Figures
◭ ◮
◭ ◮
Back Close
Full Screen / Esc
Printer-friendly Version Interactive Discussion
Discussion
P
a
per
|
Discussion
P
a
per
|
Discussion
P
a
per
|
Discussion
P
a
per
|
3 Results and discussion
3.1 Basic optical properties
We focus here on modeling the spectral optical properties of iron-oxides which are needed for climate modeling: the volume extinction coefficientβext(which is the sum of
the scattering coefficientβscaand the absorption coefficientβabs), the single scattering
5
albedoω0, and the asymmetry parameterg(a cosine weighted integral of the
scatter-ing phase function). This set of parameters allows the calculation of radiation forcscatter-ing in most climate models. Figure 2 shows calculated optical parameters for hematite (with complex refractive indices from QE1985 and LG1988) and illite with varying median radius at solar and infrared wavelengths. The volume total extinction coefficientsβext
10
have been normalized asβ∗
extfor particle number concentrationN=1 cm− 3
.
Figure 2a and b demonstrate how the normalized spectral extinction coefficient and the normalized spectral absorption coefficient vary due to the differences in the refrac-tive indices and median radius of the minerals. As shown in Fig. 2a,β∗
ext for hematite
has a spectrum which is clearly distinguishable from that for illite at UV, visible and
15
IR wavelengths. One point should be noted: hematite has a lower normalized spec-tral extinction coefficient than illite at wavelengths less than 1.3 µm, which means that hematite has a weaker optical extinction capacity than illite at these wavelengths. In the IR region, the spectral features of hematite inβ∗
extshow large differences in
volatil-ity, and mimic the features in the refractive index of hematite. The magnitude ofβ∗
ext
20
depends on the parameters of the particle size distribution.
Figure 2b shows the equivalent normalized spectral absorption coefficient for hematite from QE1985 and LG1988 at wavelengths less than 5 µm. The normalized absorption coefficient of hematite from QE1985 is about 100 times larger than that for illite at both visible and near-IR wavelengths, but the normalized absorption coefficient
25
be-ACPD
15, 5619–5662, 2015What’s the real role of iron-oxides
X. L. Zhang et al.
Title Page
Abstract Introduction
Conclusions References
Tables Figures
◭ ◮
◭ ◮
Back Close
Full Screen / Esc
Printer-friendly Version Interactive Discussion
Discussion
P
a
per
|
Discussion
P
a
per
|
Discussion
P
a
per
|
Discussion
P
a
per
|
tween 1 and 5 µm. If we adopt the complex refractive indices of QE1985, the calculated absorption coefficient of hematite indicates that hematite is an especially strong ab-sorber at UV and visible wavelengths. Conversely, the calculated absorption coefficient of hematite using LG1988 data suggests that hematite is an important aerosol com-ponent only for short-wavelength absorption. Considering the whole region from 0.2
5
to 5 µm, hematite with complex refractive indices from LG1988 has an approximately equal absorbing capacity to that of illite.
Figure 2c illustrates the single scattering albedo of hematite and illite at wave-lengths between 0.2 and 5 µm for different particle size distributions. The single scat-tering albedo of hematite is about 0.6 for wavelengths λ <0.55 µm and varies little
10
fromr0=0.7 µm to r0=0.5 µm. In contrast, illite has ω0 in the range from about 0.9
to 1 for λ <0.55 µm, showing strong spectral dependence at short wavelengths. For λ >0.55 µm, illite hasω0of about 0.99 for 0.55< λ <2.0 µm and this gradually reduces
to about 0.5 for 2.0< λ <5.0 µm, while hematite shows large differences ofω0
depend-ing on the source of the refractive indices. The sdepend-ingle scatterdepend-ing albedo decreases to
15
about 0.35 at UV wavelengths for hematite nanoparticles (which are always observed as aggregates with other clay mineral particles) with r0=0.01 µm and σ=2.0, but it
rapidly increases to nearly 1 at wavelengthsλ >0.7 µm.
Figure 2d compares the asymmetry parameter of hematite with refractive indices from QE1985 and LG1988 at UV and visible wavelengths with size modes ofr0=0.7,
20
0.5, and 0.01 µm. Forr0=0.5 and 0.7 µm, hematite from QE1985 hasg=0.3–0.99,g
decreasing asλincreases. The magnitudes of g from LG1988 are in the range from 0.2 to 0.99 with a few fluctuations. Forr0=0.01 µm, both datasets put gin the range
from about 0.15 to 0.38. Thus, the magnitude ofgdepends significantly on the particle size distribution.
ACPD
15, 5619–5662, 2015What’s the real role of iron-oxides
X. L. Zhang et al.
Title Page
Abstract Introduction
Conclusions References
Tables Figures
◭ ◮
◭ ◮
Back Close
Full Screen / Esc
Printer-friendly Version Interactive Discussion
Discussion
P
a
per
|
Discussion
P
a
per
|
Discussion
P
a
per
|
Discussion
P
a
per
|
3.2 Physical and mineralogical properties
3.2.1 Size and morphology
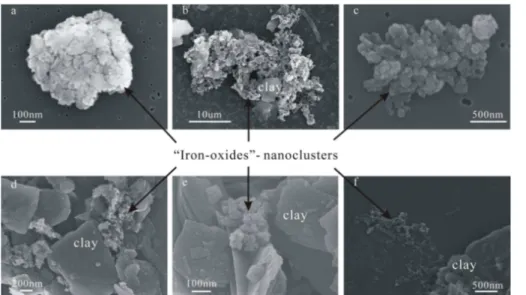
Many electron microscopy observations (Greeland et al., 1968; Tipping, 1981; Postma and Brockenhuus-Schack, 1987; Poulton and Canfield, 2005; Raiswell and Anderson, 2005; Shi et al., 2009; Deboudt et al., 2012; Wagner et al., 2012; Guo and Barnard,
5
2013) have shown that poorly ordered iron-oxides commonly occur as spheroidal to ellipsoidal nanoparticles that may be single or aggregated, and may be unattached or attached to quartz or clay minerals (Fig. 3). The reasons for the aggregation and the at-tachment are not well understood but are likely to be related to interactions of surface charge characteristics between iron-oxides and quartz or clay minerals (Poulton and
10
Canfield, 2005). According to Hinds (1982), the binding mechanisms that hold sepa-rate aerosols together in an agglomesepa-rate formed in the air include the van der Waals force, the electrostatic force and the surface tension of adsorbed liquid films. As men-tioned above, the dispersed nanoparticles of iron-oxides which are attracted to larger dust particles have more prominent optical absorption than aggregated iron-oxides, but
15
the use of size distributions for nanoparticles (such asr0=0.01 µm and σ=2.0) will
overestimate the optical absorption of iron-oxides in natural dust aerosol samples.
3.2.2 Abundance of total iron and iron-oxides
By employing the optical parameters of hematite and clay minerals calculated above, we can model the optical effects of hematite in dust aerosols. Problems associated
20
with this are the actual variation of iron-oxides content and the state of the mixture with other minerals and these should be accounted for when modeling the optical properties of dust aerosols.
The total iron content in dust aerosol bulk samples is always measured in terms of the Fe2O3mass percentage of the total oxide mass by elemental analysis (i.e. XRF, PIXE
25
ACPD
15, 5619–5662, 2015What’s the real role of iron-oxides
X. L. Zhang et al.
Title Page
Abstract Introduction
Conclusions References
Tables Figures
◭ ◮
◭ ◮
Back Close
Full Screen / Esc
Printer-friendly Version Interactive Discussion
Discussion
P
a
per
|
Discussion
P
a
per
|
Discussion
P
a
per
|
Discussion
P
a
per
|
Israel. The observed Fe percentage for the Dunhuang site in China during ACE-Asia is 4.0±0.9 % (Zhang et al., 2003). A value of 4.45±0.49 % (Guieu et al., 2002) has been proposed as characterizing Saharan dust. The elemental analysis by XRF yielded total iron oxide contents between 2.0 and 5.0 weight % for four Saharan mineral dust sam-ples of different color and origin (Linke et al., 2006). Moreover, Lafon et al. (2004, 2006)
5
reported that the total iron content (the Fe2O3 percentage) varies from 6.2 to 8.7 % in
six atmospheric samples and three wind tunnel generated samples. The total iron con-tent ranges from 1.82 to 11.8 % (with an especially high value of 30.0 % in the sample collected from Bamako, Mali) in entrained PM2.5from ten soil samples representing the
Arabian Peninsula, the Sahara and Sahel regions and samples from northeast Africa
10
and south-central Asia (Moosmüller et al., 2012). Furthermore, percentage values of iron content from several datasets reported by previous studies vary mainly between 4 and 11 % (e.g., Gomes and Gillette, 1993; Chiapello et al., 1997; Gao et al., 2001).
One additional aspect should be discussed here for the proper interpretation of the obtained data: how representative is the total iron concentration of the free iron oxide
15
content of dust aerosols? Free-iron is present as a major aerosol component affecting the short-wavelength absorption of mineral dust. However, iron oxide represents only part of the total iron, which may also exist in the crystal lattice of numerous other dust minerals. The iron oxide-to-total iron ratio in natural and soil-derived aerosols has been characterized by applying an adapted reductive extraction method as commonly
20
used in soil science (Lafon et al., 2004, 2006). This method provides no structural information about the extractable iron and therefore cannot distinguish between the presence of goethite or hematite in the samples. Fortunately, this method can provide an upper limited to the free-iron content for the optical modeling.
Lafon et al. (2004, 2006) reported considerable variability in the iron oxide-to-total
25
ACPD
15, 5619–5662, 2015What’s the real role of iron-oxides
X. L. Zhang et al.
Title Page
Abstract Introduction
Conclusions References
Tables Figures
◭ ◮
◭ ◮
Back Close
Full Screen / Esc
Printer-friendly Version Interactive Discussion
Discussion
P
a
per
|
Discussion
P
a
per
|
Discussion
P
a
per
|
Discussion
P
a
per
|
have calculated an average of 0.52. Formenti et al. (2014) reported that iron oxides account, by mass, for 0.38 to 0.72 of the total elemental iron based on X-ray absorp-tion analysis of samples of mineral dust emitted from or transported to western Africa. Reynolds et al. (2013) reported that the percent iron in goethite and hematite relative to iron in all iron-bearing phases ranges from 0.2 to 0.52 for dust samples in
Aus-5
tralia as determined from Mössbauer spectra. Based on an average compiled from the literature, Kandler et al. (2009, 2011) have assumed that only 20 % of the total iron con-tent is hematite when determining the complex refractive index of dust aerosols. Alfaro et al. (2004) found in their dust samples comparable total iron contents in the range of 3.0 to 6.5 weight %, and they assigned a significant amount of 2.8 to 5.8 % of this
10
iron as present in iron oxide mineral phases. This result is consistent with the reported 2.8–5.0 % of free-iron in aerosol samples collected from three different locations over the world (Lafon et al., 2004, 2006). Takahashi et al. (2011) indicated that the content of iron-oxides is less than 5 weight % in Asian dust. Moreover, Klaver et al. (2011a) re-ported that the iron oxides-to-total iron ratio for the analysed samples varied between
15
0.4 and 0.61, accounting for between 1 and 3 % of the total gravimetric mass, and For-menti et al. (2008) also illustrated that iron oxides (speciation hematite and goethite) represented 2.4 and 4.5 % of the total mineral dust mass. As mentioned above, only about half of the total iron content is represented by free-iron.
XRD analytical technology has also been applied to identify the content of hematite
20
and goethite in some cases and less than 2 % iron oxides was detected (Bernabé et al., 2005; Shi et al., 2005; Linke et al., 2006; Kandler et al., 2009; Lawrence et al., 2010; Klaver et al., 2011a; Wagner et al., 2012). Depending on the crystal phase of interest, this method has a detection limit of 0.1 to 0.5 weight % for iron oxides (Balsam et al., 2014). Discrepancies between the quantified free-iron content detected by the
25
ACPD
15, 5619–5662, 2015What’s the real role of iron-oxides
X. L. Zhang et al.
Title Page
Abstract Introduction
Conclusions References
Tables Figures
◭ ◮
◭ ◮
Back Close
Full Screen / Esc
Printer-friendly Version Interactive Discussion
Discussion
P
a
per
|
Discussion
P
a
per
|
Discussion
P
a
per
|
Discussion
P
a
per
|
Single particle analysis has also been conducted for detecting the free iron oxides. Fe-rich particles (iron oxides) represented no more than 5 % of the particle number in aerosol samples and hematite or goethite were found more often in the fine frac-tion(Chou et al., 2008; Kandler et al., 2009; Schladitz et al., 2009; Kang et al., 2009; Scheuvens et al., 2011; Malek et al., 2011; Wagner et al., 2012; Menéndez et al.,
5
2014).
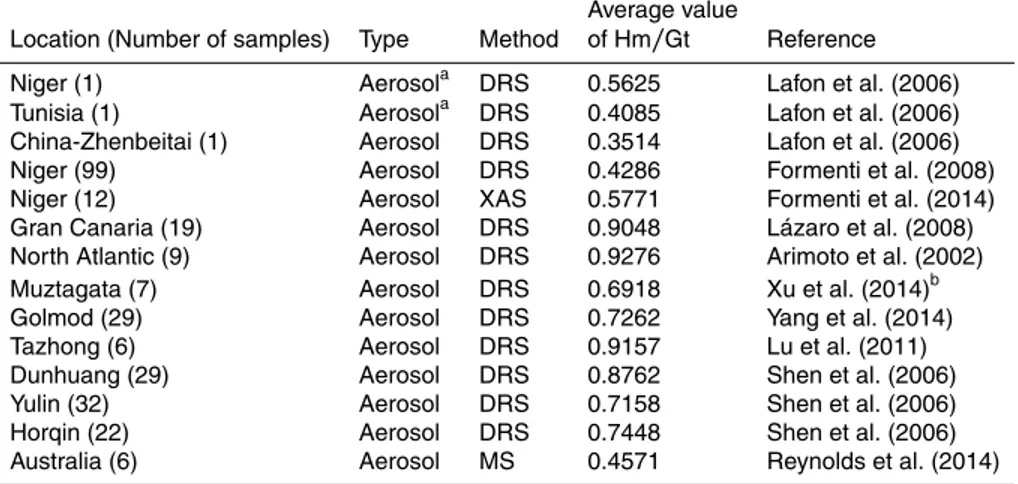
The technology of diffuse reflectance spectroscopy (DRS) has normally been to quantify the ratio of hematite to goethite in a particular dust sample (Lafon et al., 2006; Shen et al., 2006; Lázaro et al., 2008; Formenti et al., 2008, 2014). The accurate quan-tification of goethite and ferrihydrite in dust is extremely difficult owing to similarities in
10
structure and associated absorption spectra of these two minerals (Scheinost et al., 1998; Torrent and Barrón, 2002; Schroth et al., 2009). This has the critical implication that the content of goethite measured by absorption spectroscopy is actually the sum of goethite and ferrihydrite. This does not, however, affect the optical calculations due to their optical similarity. Table 3 summarizes the measured ratios of hematite to goethite
15
in global dust aerosol samples and shows higher ratios of Hm/Gt in Asian dust sam-ples compared to African samsam-ples. Over the whole world, it is concluded that goethite predominates over hematite with a relative abundance of 50–75 % of iron oxides in dust aerosols.
Based on the above reported results, we conclude that the iron-oxides account for
20
approximately half of the mass of elemental Fe and for between 2 and 5 % of the dust mass. Most of them are composed of goethite, representing between 50 and 75 % of the iron oxide mass.
3.2.3 Mixing states
As free-iron particles are always mixed with other kinds of particle, the condition of
25
ACPD
15, 5619–5662, 2015What’s the real role of iron-oxides
X. L. Zhang et al.
Title Page
Abstract Introduction
Conclusions References
Tables Figures
◭ ◮
◭ ◮
Back Close
Full Screen / Esc
Printer-friendly Version Interactive Discussion
Discussion
P
a
per
|
Discussion
P
a
per
|
Discussion
P
a
per
|
Discussion
P
a
per
|
also included inside particles (Deboudt et al., 2012). Inversions calculated assuming external mixing are better able to explain the wavelength dependence of dust absorp-tion by varying only hematite concentraabsorp-tion than inversions using internal mixing (Koven and Fung, 2006; Formenti et al., 2014). Thus, a semi-external mixing assumption is clearly an optimal approximation for iron-oxides mixed with aluminosilicate particles.
5
Moreover, this assumption has the advantages of simplicity of calculation, interpreta-tion, and the possibility of comparing with model results.
3.3 Further simulation and verification
Sokolik and Toon (1999) also suggested that the radiative properties of a mixture would strongly depend on the relative abundance of individual minerals due to the large
vari-10
ations in the optical properties of individual minerals. Therefore, we model the optical properties for a range of possible weight fractions of hematite in the clay-size mode while the remaining mass is illite which represents the clay minerals. As mentioned above, we adopt 0 % hematite as the lower limit for the aerosol samples with no free-iron particles, 2.5 % hematite for the transported dust aerosol samples, 5 % hematite
15
for the locally emitted dust samples and 7.5 % hematite for the upper limit.
Dust mineralogical composition is often expressed as a weighted fraction of individ-ual components in the total dust sample. Because the relationship of number concen-tration and mass concenconcen-tration can be expressed as:
Mi=M0·Wi =Ni·ρi·
4 3π(r0)
3
·exp
9 2(lnσ)
2
, (3)
20
ACPD
15, 5619–5662, 2015What’s the real role of iron-oxides
X. L. Zhang et al.
Title Page
Abstract Introduction
Conclusions References
Tables Figures
◭ ◮
◭ ◮
Back Close
Full Screen / Esc
Printer-friendly Version Interactive Discussion
Discussion
P
a
per
|
Discussion
P
a
per
|
Discussion
P
a
per
|
Discussion
P
a
per
|
external mixtures of minerals can be modeled by:
Kextmix=X K∗
ext(i)·Ni
=X K∗
ext(i)·
M0·Wi
ρi·43π(r0)3·exp
9 2(lnσ)2
!
. (4)
Figure 4a shows the differences between the single scattering albedo calculated for the mixture of illite and hematite with complex refractive indices from LG1988 at visible and infrared wavelengths. Compared toω0 for illite with no hematite, it is not hard to
5
see thatω0for mixtures with different amount of hematite show significant differences
in four wavelengh ranges, namely, 0.2–0.7, 2.5–8.7, 8.7–12.5 and 15.0–17.5 µm. For 0.2< λ <0.7 µm and 15.0 < λ <17.5 µm, ω0 for the mixtures is smaller than ω0 for
pure illite, which means the presence of hematite enhances the optical absorption of the mixtures. For 2.5< λ <8.7 µm,ω0for the mixtures is larger than for pure illite, which
10
means the presence of hematite enhances the optical scattering of the mixtures. But for 8.7< λ <12.5 µm,ω0shows more complicated fluctuations.
Figure 4b shows the differences betweenω0for illite mixed with different amounts of
hematite with refractive indices from QE1985 at solar wavelengths. The magnitude of ω0 for a mixture increases when the median radiusr0increases. In order to compare
15
the effects for hematite with refractive indices from two different sources for the same mixture state, we also plotω0for illite mixed with 7.5 % hematite with refractive indices
from LG1988 in Fig. 4b. Evidently, for 0.55< λ <2.5 µm, the dataset of QE1985 will lead to higher optical absorption, although the two datasets have the same optical scattering and absorption forλ <0.55 µm.
20
In order to check the further effects of the mixing state of hematite on the single scat-tering albedo, we use two sets of assumptions that bracket the actual state of hematite mixing: internal mixing (Int), in which individual dust particles are a combination of all components present; and external mixing (Ext), in which different components exist as separate particles.
25
Approxi-ACPD
15, 5619–5662, 2015What’s the real role of iron-oxides
X. L. Zhang et al.
Title Page
Abstract Introduction
Conclusions References
Tables Figures
◭ ◮
◭ ◮
Back Close
Full Screen / Esc
Printer-friendly Version Interactive Discussion
Discussion
P
a
per
|
Discussion
P
a
per
|
Discussion
P
a
per
|
Discussion
P
a
per
|
mations have to be made to calculate the optical properties of internal mixed particles. Three common approximations for the calculation of these latter optical properties are the volume mixing method, the Bruggeman approximation and the Maxwell–Garnett approximation (Chy´ylek et al., 1988; Bohren and Huffman, 1998). Detail information about the three methods is given by Sokolik and Toon (1999). We have calculated the
5
single scattering albedo (SSA) of illite–hematite mixtures with different hematite con-tents using internal mixing according to the above three internal approximations and also using external mixing.
The calculated SSA values for illite–hematite mixtures using internal and external mixture assumptions as a function of wavelength and hematite mass fraction are
il-10
lustrated in Fig. 5. For the case of external mixing, the SSAs at 405 nm show good agreement for refractive indices from QE1985 and LG1988, but the calculated SSAs at 870 nm for hematite with refractive indices from QE1985 are much smaller than those using LG1988. This is explained by Fig. 4b where the two datasets have the same optical scattering and absorbing properties forλ <0.55 µm but the dataset of QE1985
15
leads to higher optical absorption forλ >0.55 µm. The calculated SSAs with the three different internal mixing methods are all much smaller than those for external mixing both at 405 and 870 nm since the assumption of an external mixture results in less absorption and less wavelength dependence of absorption than does the assumption of an internal mixture for small amounts of hematite. The basic reason for this is due to
20
the extremely high imaginary refractive index for hematite at short wavelengths. For the case of internal mixing, the SSAs from the volume mixing method are smaller than for the other methods. This is due to the averaged imaginary refractive index being larger than for the other two approximations. On the basis of the study of Peterson (1968), only the effective refractive index of the non-metallic part of the dust can be calculated
25
ACPD
15, 5619–5662, 2015What’s the real role of iron-oxides
X. L. Zhang et al.
Title Page
Abstract Introduction
Conclusions References
Tables Figures
◭ ◮
◭ ◮
Back Close
Full Screen / Esc
Printer-friendly Version Interactive Discussion
Discussion
P
a
per
|
Discussion
P
a
per
|
Discussion
P
a
per
|
Discussion
P
a
per
|
The calculated SSAs using the Bruggeman approximation are consistent with those from the Maxwell–Garnet approximation for low hematite contents at both 405 and 870 nm but differ from them for hematite content larger than 10 %. Both the Maxwell– Garnet and Bruggeman approximations are derived from the same integral equation for the propagation of electromagnetic waves in an inhomogeneous medium but under
5
a different set of approximations (Chy´ylek et al., 1988; Bohren and Huffman, 1998). In previous studies, the Bruggeman approximation (Sokolik and Toon, 1999; Lafon et al., 2006; Koven and Fung, 2006; Mishra and Tripathi, 2008; Thomas and Gau-tier, 2009; McConnell et al., 2010; Klaver et al., 2011a; Wagner et al., 2012; Mishra et al., 2012) has been more often used for calculating the complex refractive index of
10
silicate–hematite mixtures than the Maxwell–Garnet approximations (Balkanski et al., 2007; Hansell Jr. et al., 2011).
The Bruggeman approximation allows for the calculation of an effective dielectric constant of multicomponent mixtures without distinguishing between matrix and inclu-sions. If we do not know which is the main body for the silicate and the hematite in an
15
aerosol, it is better to choose the Bruggeman approximation. For the Maxwell–Garnet approximation a decision must be made as to which component is the matrix and which is an inclusion. The Maxwell–Garnett approximation is designed for small inclusions in-side a host matrix and thus it is not suitable for hematite>50 % in the mixture, so the calculated SSAs show abnormal fluctuation for hematite>50 % in Fig. 5. This
phe-20
nomenon disappears if we consider the inverse Maxwell–Garnet approximation which makes hematite the host matrix. Actually, the variation of Fe2O3has been constrained
within the range 0–10 %, so we advise the use of the Maxwell–Garnet approximation in which the inclusions should be identical in composition but may be different in volume, shape and orientation.
25
ACPD
15, 5619–5662, 2015What’s the real role of iron-oxides
X. L. Zhang et al.
Title Page
Abstract Introduction
Conclusions References
Tables Figures
◭ ◮
◭ ◮
Back Close
Full Screen / Esc
Printer-friendly Version Interactive Discussion
Discussion
P
a
per
|
Discussion
P
a
per
|
Discussion
P
a
per
|
Discussion
P
a
per
|
at both wavelengths are dominated by and linearly correlated with the iron content of the entrained mineral dust. These measured results are also shown in Fig. 5 for com-parison with our theoretically calculated SSAs. The measured SSAs at 405 nm show good agreement with our external mixing SSA values calculated from both LG1988 and QE1985 for hematite<10 %, while they are much larger than our internal mixing SSA
5
values at this wavelength (Fig. 5a), potentially indicating that their samples are mainly external mixing with a small degree of internal mixing. In contrast, their SSA values at 870 nm are much larger than our external and internal mixing SSA values calculated from refractive indices from QE1985 but show good agreement with our external mix-ing SSA values calculated usmix-ing LG1988 values (Fig. 5b). This illustrates the fact that
10
the complex refractive indices of hematite from QE1985 have greatly overestimated absorption at 870 nm.
For purposes of quantitatively illustrating the optical effects of hematite in the mix-tures, we calculate ∆ω0 as the difference between the single scattering albedo of
a given hematite and illite mixture and the single scattering albedo of pure illite. The
15
latter represents the case when the dust contains no hematite. Thus, we have
∆ω0=
ωmixture0 −ωillite0
ωillite0 ×100 %. (5)
Figure 6 shows∆ω0calculated for hematite with refractive indices from QE1985 and
LG1988 at wavelengths less than 20 µm. We assumeM0=100 µg cm− 3
and a lognor-mal size distribution withr0=0.5 µm,σ=2.0. If the values of ∆ω0 are negative, this
20
means that hematite has high absorption at the corresponding wavelengths. Figure 6 demonstrates that hematite with refractive indices from LG1988 only enhances the op-tical absorption of aerosol mixtures forλ <0.55 µm but hematite with refractive indices from QE1985 enhances the absorption from UV to visible wavelengths. The magni-tude of∆ω0 for 5 % hematite is about 1 %. Another apparent difference is the
magni-25
tude of∆ω0 for hematite with refractive indices from the two datasets at wavelengths
ACPD
15, 5619–5662, 2015What’s the real role of iron-oxides
X. L. Zhang et al.
Title Page
Abstract Introduction
Conclusions References
Tables Figures
◭ ◮
◭ ◮
Back Close
Full Screen / Esc
Printer-friendly Version Interactive Discussion
Discussion
P
a
per
|
Discussion
P
a
per
|
Discussion
P
a
per
|
Discussion
P
a
per
|
QE1985 in climate models would lead to overestimation of the optical absorption at both visible and near-IR wavelengths.
Absorption from the mineral dust as measured using the corrected nephelometer and Particle Soot Absorption Photometer (PSAP) combination suggests that single scattering albedos at 550 nm (SSA550) range from 0.91 to 0.97 (with a mean of 0.97)
5
for iron oxide mass fractions between 1.3 and 3.5 % (Köhler et al., 2011). The SSAs at 532 nm were reported as 0.99±0.001 with Fe2O3mass fraction of 4.5 % for Cairo 2 and 0.98±0.002 with Fe2O3mass fraction of 4.5 % for Morocco (Linke et al., 2006). Johnson
and Osborne (2011) revealed that the use of the mineral dust refractive indices from Balkanski et al. (2007) assuming 1.5 % hematite gave reasonable agreement with the
10
measured single scattering albedo, consistent with the findings of Klaver et al. (2011a). Haywood et al. (2011) shown that mineral dust is relatively non-absorbing at 550 nm due to the relatively small fraction of iron oxides present (1–3 %).
Balkanski et al. (2007) addressed this difference and argued that dust absorption at visible wavelengths might be lower than previously thought because mixing rule
cal-15
culations with a hematite content of 1.5 % by volume, supposedly representative of median dust absorption, showed a very good agreement with the AERONET measure-ments. The same question is presented in Fig. 7a of Formenti et al. (2014): that the calculated SSA using a higher imaginary index of iron-oxides also overestimated the absorbing ability of Saharan dust in comparison with field observation.
20
Given all that, the complex refractive index of iron-oxides is therefore a key param-eter in effects of dust aerosols on the radiation balance, and the optical constants of hematite from different sources become a major source of uncertainty in radiative forc-ing calculation. Further work is needed to provide experimental measurements of the refractive index of iron-oxides, especially for hematite and goethite in the visible region
25
ACPD
15, 5619–5662, 2015What’s the real role of iron-oxides
X. L. Zhang et al.
Title Page
Abstract Introduction
Conclusions References
Tables Figures
◭ ◮
◭ ◮
Back Close
Full Screen / Esc
Printer-friendly Version Interactive Discussion
Discussion
P
a
per
|
Discussion
P
a
per
|
Discussion
P
a
per
|
Discussion
P
a
per
|
4 Summary
In this paper we have investigated the spectral optical properties of iron-oxides. There are still problems that need to be solved in order to accurately study the real role of iron-oxides in determining the overall impact of dust aerosols on climate forcing, as follows:
5
(1) Although there have been many published investigations of the complex refractive index of different iron-oxides, uniformly continuous optical constants for a single type of iron-oxides from 0.2 to 50 µm are very scarce. Some of them are inconsistent and careful checking of their accuracy is therefore essential.
(2) The abundance of specific iron-oxide types (such as goethite and magnetite)
10
remains unknown. Although many studies have measured the mass ratio of goethite to hematite as about 7 : 3, the absence of goethite optical constants at 0.75–8.5 µm restricts the usefulness of this ratio. Thus, using hematite to represent all types of iron-oxides is a popular hypothesis.
(3) Microscopic observations and optical simulations have shown that semi-external
15
mixtures employing both external mixtures of Fe-aggregates and other minerals and partly internal mixing between iron-oxides and aluminosilicate particles is the optimal mixing approximation.
(4) For hematite, there are two datasets of complex refractive indices that differ sig-nificantly. Compared with LG1988, the complex refractive indices of QE1985 greatly
20
overestimate the optical absorption at both visible and near-IR wavelengths.
As about 87 % of solar spectral irradiance is distributed at wavelengths from 0.4 to 2.5 µm (ASTM G-173, http://rredc.nrel.gov/solar/spectra/am1.5/), hematite with refrac-tive indices from LG1988 shows approximately equal absorption to the clay mineral illite over the whole region from 0.2 to 2.5 µm, and only enhances the optical
absorp-25
ACPD
15, 5619–5662, 2015What’s the real role of iron-oxides
X. L. Zhang et al.
Title Page
Abstract Introduction
Conclusions References
Tables Figures
◭ ◮
◭ ◮
Back Close
Full Screen / Esc
Printer-friendly Version Interactive Discussion
Discussion
P
a
per
|
Discussion
P
a
per
|
Discussion
P
a
per
|
Discussion
P
a
per
|
the refractive indices of iron-oxides, especially of hematite and goethite in the visible spectrum, should therefore be made in order to accurately assess the effect of mineral dust on climate forcing.
Acknowledgements. We are grateful to Yahui Yue at ITPCAS and Yongliang Li at BNU for completing the SEM–EDX analysis and Michael Mishchenko at NASA GISS for offering the 5
T matrix and Lorenz–Mie codes. This work was supported by the National Natural Science Foundation of China (Grant No. 41205108 and 41271074).
References
Alfaro, S., Lafon, S., Rajot, J., Formenti, P., Gaudichet, A., and Maille, M.: Iron oxides and light absorption by pure desert dust: an experimental study, J. Geophys. Res.-Atmos., 109, 10
D08208, doi:10.1029/2003JD004374, 2004.
Anderson, B. and Jenne, E.: Free-iron and-manganese oxide content of reference clays, Soil Sci., 109, 163–169, 1970.
Angel, B. and Vincent, W.: Associated with the surface of kaolins, Clay Clay Miner., 26, 263– 272, 1978.
15
Arimoto, R., Balsam, W., and Schloesslin, C.: Visible spectroscopy of aerosol particles collected on filters: iron-oxide minerals, Atmos. Environ., 36, 89–96, 2002.
Arimoto, R., Ray, B., Lewis, N., Tomza, U., and Duce, R.: Mass–particle size distributions of atmospheric dust and the dry deposition of dust to the remote ocean, J. Geophys. Res.-Atmos., 102, 15867–15874, 1997.
20
Balkanski, Y., Schulz, M., Claquin, T., and Guibert, S.: Reevaluation of Mineral aerosol radia-tive forcings suggests a better agreement with satellite and AERONET data, Atmos. Chem. Phys., 7, 81–95, doi:10.5194/acp-7-81-2007, 2007.
Balsam, W., Ji, J., Renock, D., Deaton, B. C., and Williams, E.: Determining hematite content from NUV/Vis/NIR spectra: limits of detection, Am. Mineral., 99, 2280–2291, 2014.
25
Baltrusaitis, J., Cwiertny, D. M., and Grassian, V. H.: Adsorption of sulfur dioxide on hematite and goethite particle surfaces, Phys. Chem. Chem. Phys., 9, 5542–5554, 2007.
Bedidi, A. and Cervelle, B.: Light scattering by spherical particles with hematite and goethitelike optical properties: effect of water impregnation, J. Geophys. Res.-Sol. Ea., 98, 11941–11952, 1993.
ACPD
15, 5619–5662, 2015What’s the real role of iron-oxides
X. L. Zhang et al.
Title Page
Abstract Introduction
Conclusions References
Tables Figures
◭ ◮
◭ ◮
Back Close
Full Screen / Esc
Printer-friendly Version Interactive Discussion
Discussion
P
a
per
|
Discussion
P
a
per
|
Discussion
P
a
per
|
Discussion
P
a
per
|
Bernabé, J., Carretero, M., and Galán, E.: Mineralogy and origin of atmospheric particles in the industrial area of Huelva (SW Spain), Atmos. Environ., 39, 6777–6789, 2005.
Bohren, C. F. and Huffman, D. R.: Absorption and Scattering of Light by Small Particles, John Wiley and Sons, New York, 1998.
Chiapello, I., Bergametti, G., Chatenet, B., Bousquet, P., Dulac, F., and Soares, E. S.: Origins 5
of African dust transported over the northeastern tropical Atlantic, J. Geophys. Res.-Atmos., 102, 13701–13709, 1997.
Chou, C., Formenti, P., Maille, M., Ausset, P., Helas, G., Harrison, M., and Osborne, S.: Size distribution, shape, and composition of mineral dust aerosols collected during the African monsoon multidisciplinary analysis special observation period 0: dust and biomass – burning 10
experiment field campaign in Niger, January 2006, J. Geophys. Res.-Atmos., 113, D00C10, doi:10.1029/2008JD009897, 2008.
Chy´ylek, P., Srivastava, V., Pinnick, R. G., and Wang, R.: Scattering of electromagnetic waves by composite spherical particles: experiment and effective medium approximations, Appl. Optics, 27, 2396–2404, 1988.
15
Cornell, R. M. and Schwertmann, U.: The Iron Oxides: Structure, Properties, Reactions, Oc-currences and Uses, John Wiley and Sons, New York, 2006.
Dang, C. and Hegg, D. A.: Quantifying light absorption by organic carbon in western North American snow by serial chemical extractions, J. Geophys. Res.-Atmos., 119, 10247– 210261, 2014.
20
Dave, J. and Center, I. P. A. S.: Subroutines for Computing the Parameters of the Electromag-netic Radiation Scattered by a Sphere, IBM Scientific Center, Palo Alto, California, 1968. Deboudt, K., Gloter, A., Mussi, A., and Flament, P.: Red–speciation and mixing state
of iron in individual African dust particles, J. Geophys. Res.-Atmos., 117, D12307, doi:10.1029/2011JD017298, 2012.
25
Derimian, Y., Karnieli, A., Kaufman, Y. J., Andreae, M. O., Andreae, T. W., Dubovik, O., Maen-haut, W., and Koren, I.: The role of iron and black carbon in aerosol light absorption, Atmos. Chem. Phys., 8, 3623–3637, doi:10.5194/acp-8-3623-2008, 2008.
Dupart, Y., King, S. M., Nekat, B., Nowak, A., Wiedensohler, A., Herrmann, H., David, G., Thomas, B., Miffre, A., and Rairoux, P.: Mineral dust photochemistry induces nucleation 30
ACPD
15, 5619–5662, 2015What’s the real role of iron-oxides
X. L. Zhang et al.
Title Page
Abstract Introduction
Conclusions References
Tables Figures
◭ ◮
◭ ◮
Back Close
Full Screen / Esc
Printer-friendly Version Interactive Discussion
Discussion
P
a
per
|
Discussion
P
a
per
|
Discussion
P
a
per
|
Discussion
P
a
per
|
Ebert, M., Weinbruch, S., Hoffmann, P., and Ortner, H. M.: The chemical composition and complex refractive index of rural and urban influenced aerosols determined by individual particle analysis, Atmos. Environ., 38, 6531–6545, 2004.
Formenti, P., Rajot, J. L., Desboeufs, K., Caquineau, S., Chevaillier, S., Nava, S., Gaudichet, A., Journet, E., Triquet, S., and Alfaro, S.: Regional variability of the composition of mineral dust 5
from western Africa: results from the AMMA SOP0/DABEX and DODO field campaigns, J. Geophys. Res.-Atmos., 113, D00C13, doi:10.1029/2008JD009903, 2008.
Formenti, P., Schütz, L., Balkanski, Y., Desboeufs, K., Ebert, M., Kandler, K., Petzold, A., Scheuvens, D., Weinbruch, S., and Zhang, D.: Recent progress in understanding physical and chemical properties of African and Asian mineral dust, Atmos. Chem. Phys., 11, 8231– 10
8256, doi:10.5194/acp-11-8231-2011, 2011.
Formenti, P., Caquineau, S., Chevaillier, S., Klaver, A., Desboeufs, K., Rajot, J., Belin, S., and Briois, V.: Dominance of goethite over hematite in iron oxides of mineral dust from Western Africa: quantitative partitioning by X-ray absorption spectroscopy, J. Geophys. Res.-Atmos., 119, 12740–12754, doi:10.1002/2014JD021668, 2014.
15
Galuza, A., Eremenko, V., and Kirichenko, A.: Analysis of hematite reflection spectrum by the Kramers–Kronig method, Sov. Phys. Solod State, 21, 654–656, 1979.
Ganor, E. and Foner, H.: The mineralogical and chemical properties and the behaviour of ae-olian Saharan dust over Israel, in: The Impact of Desert Dust Across the Mediterranean, Springer, Kluwer Academic Publishers, Dordrecht, the Netherlands, 163–172, 1996.
20
Gao, Y., Kaufman, Y., Tanre, D., Kolber, D., and Falkowski, P.: Seasonal distributions of aeolian iron fluxes to the global ocean, Geophys. Res. Lett., 28, 29–32, 2001.
Gillespie, J. B. and Lindberg, J. D.: Ultraviolet and visible imaginary refractive index of strongly absorbing atmospheric particulate matter, Appl. Optics, 31, 2112–2115, 1992.
Ginot, P., Dumont, M., Lim, S., Patris, N., Taupin, J.-D., Wagnon, P., Gilbert, A., Arnaud, Y., 25
Marinoni, A., Bonasoni, P., and Laj, P.: A 10 year record of black carbon and dust from a Mera Peak ice core (Nepal): variability and potential impact on melting of Himalayan glaciers, The Cryosphere, 8, 1479–1496, doi:10.5194/tc-8-1479-2014, 2014.
Glotch, T. D. and Rogers, A. D.: Evidence for aqueous deposition of hematite- and sulfate- rich light-toned layered deposits in Aureum and Iani Chaos, Mars, J. Geophys. Res.-Planet., 112, 30
E06001, doi:10.1029/2006JE002863, 2007.
ACPD
15, 5619–5662, 2015What’s the real role of iron-oxides
X. L. Zhang et al.
Title Page
Abstract Introduction
Conclusions References
Tables Figures
◭ ◮
◭ ◮
Back Close
Full Screen / Esc
Printer-friendly Version Interactive Discussion
Discussion
P
a
per
|
Discussion
P
a
per
|
Discussion
P
a
per
|
Discussion
P
a
per
|
Gomes, L. and Gillette, D. A.: A comparison of characteristics of aerosol from dust storms in central Asia with soil-derived dust from other regions, Atmos. Environ. A-Gen., 27, 2539– 2544, 1993.
Greenland, D. J., Oades, J., and Sherwin, T.: Elecrron-microscope observations of iron oxides in some red soils, J. Soil Sci., 19, 123–126, 1968.
5
Guieu, C., Loÿe-Pilot, M. D., Ridame, C., and Thomas, C.: Chemical characterization of the Sa-haran dust end-member: some biogeochemical implications for the western Mediterranean Sea, J. Geophys. Res.-Atmos., 107, ACH 5-1–ACH 5–11, 2002.
Guo, H. and Barnard, A. S.: Naturally occurring iron oxide nanoparticles: morphology, surface chemistry and environmental stability, J. Mater. Chem., 1, 27–42, 2013.
10
Höller, R., Ito, K., Tohno, S., and Kasahara, M.: Wavelength-dependent aerosol single-scattering albedo: measurements and model calculations for a coastal site near the Sea of Japan during ACE-Asia, J. Geophys. Res.-Atmos., 108, 8648, doi:10.1029/2002JD003250, 2003.
Hansell Jr., R. A., Reid, J. S., Tsay, S. C., Roush, T. L., and Kalashnikova, O. V.: A sensitivity 15
study on the effects of particle chemistry, asphericity and size on the mass extinction effi -ciency of mineral dust in the earth’s atmosphere: from the near to thermal IR, Atmos. Chem. Phys., 11, 1527–1547, doi:10.5194/acp-11-1527-2011, 2011.
Haywood, J., Johnson, B., Osborne, S., Baran, A., Brooks, M., Milton, S., Mulcahy, J., Wal-ters, D., Allan, R., and Klaver, A.: Motivation, rationale and key results from the GERBILS 20
Saharan dust measurement campaign, Q. J. Roy. Meteor. Soc., 137, 1106–1116, 2011. Henning, T. and Mutschke, H.: Low-temperature infrared properties of cosmic dust analogues,
Astron. Astrophys., 327, 743–754, 1997.
Henning, T., Begemann, B., Mutschke. H., and Dorschner, J.: Optical properties of oxide dust grains, Astron. Astrophys. Sup., 112, 143–149, 1995.
25
Hinds, W. C.: Aerosol Technology: Properties, Behavior, and Measurement of Airborne Parti-cles, Wiley-Interscience, New York, 442 p., 1, 1982.
Hsu, W. P. and Matijević, E.: Optical properties of monodispersed hematite hydrosols, Appl. Optics, 24, 1623–1630, 1985.
Jickells, T., An, Z., Andersen, K. K., Baker, A., Bergametti, G., Brooks, N., Cao, J., Boyd, P., 30