ACPD
14, 12797–12817, 2014CPCs at lwo temperatures
D. Wimmer et al.
Title Page
Abstract Introduction
Conclusions References
Tables Figures
◭ ◮
◭ ◮
Back Close
Full Screen / Esc
Printer-friendly Version Interactive Discussion
Discussion
P
a
per
|
Discus
sion
P
a
per
|
Discussion
P
a
per
|
Discussion
P
a
per
|
Atmos. Chem. Phys. Discuss., 14, 12797–12817, 2014 www.atmos-chem-phys-discuss.net/14/12797/2014/ doi:10.5194/acpd-14-12797-2014
© Author(s) 2014. CC Attribution 3.0 License.
This discussion paper is/has been under review for the journal Atmospheric Chemistry and Physics (ACP). Please refer to the corresponding final paper in ACP if available.
Technical Note: Using DEG CPCs at upper
tropospheric temperatures
D. Wimmer1,2, K. Lehtipalo2,3, T. Nieminen2, J. Duplissy2, S. Ehrhart1,4,
J. Almeida1,4, L. Rondo1, A. Franchin2, F. Kreissl1, H. E. Manninen2, M. Kulmala2, J. Curtius1, and T. Petäjä2
1
Goethe-University of Frankfurt, Institute for Atmospheric and Environmental Sciences, 60438 Frankfurt am Main, Germany
2
University of Helsinki, Department of Physics, 00014 Helsinki, Finland
3
Airmodus Ltd, Helsinki, Finland
4
CERN, 1211 Geneva, Switzerland
Received: 21 March 2014 – Accepted: 14 April 2014 – Published: 20 May 2014 Correspondence to: D. Wimmer (daniela.wimmer@helsinki.fi)
ACPD
14, 12797–12817, 2014CPCs at lwo temperatures
D. Wimmer et al.
Title Page
Abstract Introduction
Conclusions References
Tables Figures
◭ ◮
◭ ◮
Back Close
Full Screen / Esc
Printer-friendly Version Interactive Discussion
Discussion
P
a
per
|
Discus
sion
P
a
per
|
Discussion
P
a
per
|
Discussion
P
a
per
|
Abstract
Over the last few years, several Condensation Particle Counters (CPC) capable of measuring in the sub-3 nm size range have been developed. Here we study the perfor-mance of Diethylene glycol (DEG) based CPCs at different temperatures during Cos-mics Leaving Outdoor Droplets (CLOUD) measurements at CERN. The data shown 5
here is the first set of verification measurements for sub-3 nm CPCs under upper tro-pospheric temperatures using atmospherically relevant aerosol particles. To put the results in perspective we calibrated the DEG-CPC at room temperature, resulting in a cut-offdiameter of 1.4 nm. All diameters refer to mobility equivalent diameters in this manuscript. At upper tropospheric temperatures between−25◦C and−65◦C, we found
10
cut-offsizes in the range of 2.5 and 2.8 nm. Due to low number concentration after size classification, the cut-offdiameters have a high uncertainty (±0.3 nm) associated with
them. Operating two laminar flow DEG CPCs with different cut-offsizes together with other aerosol instruments, we looked at the growth rates of aerosol population in the CLOUD chamber for particles smaller than 10 nm at different temperatures. A more 15
consistent picture emerged when we normalized the growth rates to a fixed gas-phase sulfuric acid concentration. All of the instruments detected larger growth rates at lower temperatures, and the observed growth rates decreased as a function of temperature, converging with each other at temperatures over 0◦C. The theoretical calculations had a much smaller temperature dependency.
20
1 Introduction
Condensation particle counters (CPCs) measure the total number concentration of par-ticles by activating and growing the aerosol parpar-ticles with a supersaturated vapour. Once the particles are grown they are counted optically with a laser (McMurry et al., 2000). They provide information about the total particle concentration above a certain 25
ACPD
14, 12797–12817, 2014CPCs at lwo temperatures
D. Wimmer et al.
Title Page
Abstract Introduction
Conclusions References
Tables Figures
◭ ◮
◭ ◮
Back Close
Full Screen / Esc
Printer-friendly Version Interactive Discussion
Discussion
P
a
per
|
Discus
sion
P
a
per
|
Discussion
P
a
per
|
Discussion
P
a
per
|
which is defined as the diameter of the particles that are successfully counted with at least 50 % efficiency. By using several CPCs with different cut-offdiameters, additional information such as the growth rates can be retrieved (Kulmala et al., 2007). In this paper all diameters refer to mobility diameters. CPCs capable of measuring reliably in the size range below 3 nm have been developed only recently (Kuang et al., 2011; 5
Vanhanen et al., 2011; Jiang et al., 2011a; Sipilä et al., 2009). CPCs are widely used for ground-based measurements, but they are also deployed during airborne measure-ments (Crumeyrolle et al., 2010; O’Dowd et al., 1998; Schobesberger et al., 2013b), where ambient conditions, such as temperature and pressure, are changing. It has been shown (Kulmala et al., 2007; Wimmer et al., 2013; Kangasluoma et al., 2013) that 10
the counting efficiency curves of the sub-3 nm CPCs change according to the particle composition. As the working principle of laminar flow CPCs is based on creating super-saturation and activation by temperature differences, their performance might depend also on the ambient temperature. One issue with CPCs measuring at low temperatures is whether the particles evaporate during the transition from the cold measurement en-15
vironment to the warmer CPC. Another issue is whether the temperature profile (and thus supersaturation) inside the instrument changes when cold sample air is brought in, maybe resulting in a cut-offshift.
At CLOUD measurements were performed to study nucleation under upper tropo-spheric temperatures. Therefore it is highly interesting to determine whether the cut-off 20
size of the DEG CPC that was used to directly measure the nucleation rate at 2 nm was changing due to the ambient temperature. As the growth rates at small sizes can be size dependent (Kulmala et al., 2013; Nieminen et al., 2010) it is also important to measure them reliably as a function of diameter. Growth rates were determined at 2 nm from different instruments and compared to each other. Here especially the compari-25
son with an ion spectrometer gives important additional information as this method is temperature independent, which is not the case for CPCs.
ACPD
14, 12797–12817, 2014CPCs at lwo temperatures
D. Wimmer et al.
Title Page
Abstract Introduction
Conclusions References
Tables Figures
◭ ◮
◭ ◮
Back Close
Full Screen / Esc
Printer-friendly Version Interactive Discussion
Discussion
P
a
per
|
Discus
sion
P
a
per
|
Discussion
P
a
per
|
Discussion
P
a
per
|
measurements). Especially we studied how the counting efficiency curve of the DEG CPC changes due to temperature, and we also studied how the growth rates behave for different instruments at low temperatures.
2 The CLOUD facility
The Cosmics Leaving OUtdoor Droplets (CLOUD) experiment was designed to study 5
nucleation in a controlled environment under various conditions (Duplissy et al., 2010; Kirkby et al., 2011). In the design, great care was taken to ensure high cleanliness, as it has been shown that impurities of trace gases (already at concentrations as low as few pptv), such as NH3 influence the nucleation rates (Ball et al., 1999; Kirkby et al.,
2011; Schobesberger et al., 2013a). The chamber as well as all the gas lines and 10
connections to the chamber are made of stainless steel. The CLOUD facility comprises a 26.1 cm3cylindrical stainless steel chamber with a fibre optic UV system (Kupc et al., 2011). It includes a very stable temperature control unit (0.01 K) with a temperature range from−70◦C up to+100◦C. Two mixing fans are installed in the upper and lower
part of the chamber to ensure homogenous internal mixing (Vogtländer et al., 2012). 15
Measurements can be performed under high ion pair production rates (pion beam from CERN proton-synchrotron on, clearing field grounded), natural level of ion production rates (beam off, clearing field grounded) and completely neutral conditions (beam off, clearing field on). The clearing field is created by applying±30 kV to two circular grids at
the top and the bottom of the chamber, removing the small ions, which are continuously 20
generated by the galactic cosmic rays in less than 1 s. The nucleation measurements in the CLOUD5 campaign, which took place in fall 2011, were mainly performed at three different ranges of temperatures: between [206–208] K, [221–223] K and [245– 248] K. To compare the performance of the chamber and the instruments to previous experiments, measurements at+5◦C were also performed. In CLOUD the instruments 25
ACPD
14, 12797–12817, 2014CPCs at lwo temperatures
D. Wimmer et al.
Title Page
Abstract Introduction
Conclusions References
Tables Figures
◭ ◮
◭ ◮
Back Close
Full Screen / Esc
Printer-friendly Version Interactive Discussion
Discussion
P
a
per
|
Discus
sion
P
a
per
|
Discussion
P
a
per
|
Discussion
P
a
per
|
sampling lines were thermally coupled to the chamber, using copper. To avoid thermal exchange with the room air, the sampling lines were wrapped with thermal insulation material on top of the copper wires.
For the measurements analyzed in this study only sulphuric acid and water were in-troduced into the chamber. A Chemical Ionisation Mass Spectrometer (CIMS, Kürten 5
et al., 2010) was used for measuring the gaseous sulphuric acid (SA) concentration. The sub-5 nm CPCs that were used for measuring the total particle concentrations and calculating nucleation rates were a Particle Size Magnifier (PSM; Airmodus A09), a butanol based laminar flow CPC (3776; TSI Inc.) and two DEG based laminar flow CPCs. Details about the setup and performance of the DEG CPCs can be found in 10
Wimmer et al.., 2013. It should be noted that the DMA that was used for size selecting the particles for the calibration measurements shown here was a standard nano-DMA, whereas for the calibration measurements at room temperature, a high resolution DMA was used, which means that the calibrations in the laboratory have a better size reso-lution. A comparison of the performance of the different DMAs can be found in Jiang 15
et al. (2011b).
3 Calibrating CPCs using the CLOUD chamber as an aerosol source
A set of calibration measurements was performed using the equipment available in CLOUD. The calibration unit consisted of the CLOUD chamber as the particle source. Doing so, the calibration particle composition was exactly the same as during the nu-20
cleation experiments. The particle production was triggered by switching on the UV lamp after adding SO2, O3and water vapour to the chamber. The particles were
sam-pled from a core sampling probe, which was used to minimize the diffusion losses. The core sampling probe consisted of a coaxial tube of with a conical tip and an outer di-ameter of 6 mm. A fraction of the flow was sampled through that tube from the center 25
ACPD
14, 12797–12817, 2014CPCs at lwo temperatures
D. Wimmer et al.
Title Page
Abstract Introduction
Conclusions References
Tables Figures
◭ ◮
◭ ◮
Back Close
Full Screen / Esc
Printer-friendly Version Interactive Discussion
Discussion
P
a
per
|
Discus
sion
P
a
per
|
Discussion
P
a
per
|
Discussion
P
a
per
|
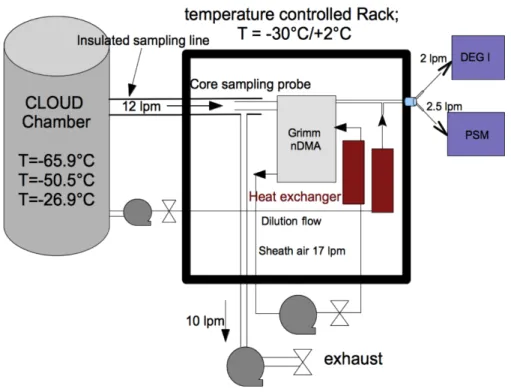
which were size selected with a nano Differential Mobility Analyzer (nano-DMA; Grimm Aerosol Technik, S-DMA, 55-100) were used for the calibration. The laminar flow DEG CPC is the instrument that was calibrated. Figure 1 shows the setup for the calibration measurements. To measure the total concentration after the DMA, as a first test, an electrometer was used as a reference. The particle concentrations after the size selec-5
tion were low due to the low charging probability and internal losses in the DMA. This resulted in an unacceptably high noise to signal ratio and therefore it was decided to use a PSM as the reference instrument instead of using an electrometer. The PSM has a significantly lower cut-offsize than the laminar flow DEG CPC and a steep count-ing efficiency curve (d50=1.1 nm,d90=1.5 nm for ammonium sulphate Wimmer et al., 10
2013) and it is a single particle counter. We assume that the PSM behaves similarly to the laminar flow DEG CPC regarding the ambient temperature. With this setup, the problem with a too low signal to noise ratio could be reduced.
During the calibration measurements, the DMA was set to stepping mode, to obtain better statistics for each size bin, since the particle population in the chamber was grow-15
ing constantly. Another experimental challenge during the calibration measurements was to not only produce enough particles, but also keep them growing slowly enough, as the size range of the DMA was limited to below 10 nm. Slow enough growth was achieved by switching on the UV lights at very low intensities for a few minutes, letting the particles grow for a couple of minutes. As soon as the particles grew to sizes bigger 20
than 10 nm, the UV was switched on again to trigger new growth of small particles. To ensure stable temperature of the calibration system, the DMA was located in a tem-perature controlled rack, which was kept at−30◦C for the measurements at−65.9◦C
and−50.5◦C, whereas the rack was at+2◦C for the measurements at−26.9◦C. Due
to technical limitations of the temperature control of the racks and the heat load of the 25
ACPD
14, 12797–12817, 2014CPCs at lwo temperatures
D. Wimmer et al.
Title Page
Abstract Introduction
Conclusions References
Tables Figures
◭ ◮
◭ ◮
Back Close
Full Screen / Esc
Printer-friendly Version Interactive Discussion
Discussion
P
a
per
|
Discus
sion
P
a
per
|
Discussion
P
a
per
|
Discussion
P
a
per
|
exchanger. The dilution flow after the DMA was taken from a different sampling line to guarantee the same composition and temperature of the stream. By setting the sheath flow to 17 lpm, a good sheath air to sample flow rate ratio was achieved to ensure a narrow size distribution in the DMA (Jiang et al., 2011b).
4 Method for determining growth rates from the DEG CPCs
5
The low cut-off CPCs (DEG-CPCs and PSMs) have been used at CLOUD also to determine the initial growth rate (GR) of the particles (Lehtipalo, 2014). This is relevant e.g. for scaling the nucleation rates, measured at larger sizes (Kirkby et al., 2011; Alemeida et al., 2013; Kulmala et al., 2013) down to smaller sizes (e.g. 1.7 nm). To determine whether the shift in the cut-offcurves influences the scientific outcome of 10
the measurements with the laminar flow DEG CPCs significantly, the growth rates have been determined and compared to other instruments (NAIS, Mirme et al., 2013, and PSM). As the two laminar flow DEG CPCs used here were developed for CLOUD mainly and they have not been used before for atmospheric measurements the method for calculating the growth rates from these instruments had to be determined.
15
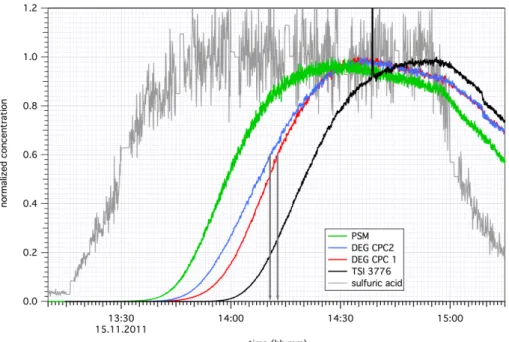
An example illustrating the chosen method is shown in Fig. 2. The total measured number concentration was normalized to the maximum for each run separately. Next the time steps when the concentrations reached half of the maximum concentrations were determined. Based on the rise times of the different CPCs used here (PSMd50=
1.1 nm, TSI 3776d50=2.9 nm), the difference in the cut-offdiameter of the two DEG
20
CPCs was estimated to be 0.3 nm. The time difference was then used for determining the growth rates. The times used for the growth rate analysis are marked with arrows in Fig. 2. The half maximum points here were reached at 14:10:45 and 14:12:50 UTC resulting in a time difference of 125 s and therefore in a GR of 9.3 nm h−1. In addition, the GRs from the PSMs were determined in the same manner (Lehtipalo et al., 2014). 25
The temperature in the chamber in this case was−50◦C and the electrodes of the high
ACPD
14, 12797–12817, 2014CPCs at lwo temperatures
D. Wimmer et al.
Title Page
Abstract Introduction
Conclusions References
Tables Figures
◭ ◮
◭ ◮
Back Close
Full Screen / Esc
Printer-friendly Version Interactive Discussion
Discussion
P
a
per
|
Discus
sion
P
a
per
|
Discussion
P
a
per
|
Discussion
P
a
per
|
at different temperatures and sulphuric acid concentrations. To be able to compare the determined GR at different temperatures the growth rates were normalized to the same sulfuric acid concentration (107cm−3). The normalization was done using the following equation
GRnorm=GRcalc(SA)×107/SAmeas, (1)
5
GRcalc here means the GRs calculated from the CPC measurements. Growth rates
higher than 20 nm h−1 have been neglected, as then the time difference between the two laminar flow DEG CPCs becomes too small.
5 Results
5.1 Upper tropospheric temperature calibration results
10
Figure 3 shows the calibration curves at different temperatures (−65.9◦C, −50.5◦C, −26.9◦C, +25◦C). Due to the huge scatter and large error bars a number of the red
data points seem to indicate a small cut-offat −65◦C, but the majority of the data is
at zero and the fit shows that the cut-off is shifted. The data points Fig. 3 are taken from the experiments with the highest particle concentrations after the DMA. Three-15
parameter sigmoidal fits are applied to the measured data points
fit(dp)=a+b/(1+exp(−(dp−b)/c)), (2)
and are weighted based on the error bars of the measured data points. To fit the
−65.9◦C data, the parameter c had to be fixed to 0.3 and also the base value
(pa-rametera) was fixed to 0, otherwise the fit would not have converged due to the large 20
error bars in the smaller sizes. The values at half maximum (=parameterb) given by the fits are 2.5±0.05 for the data points at−65.9◦C, 2.6±0.1 for−26.9◦C and 2.8±0.05
ACPD
14, 12797–12817, 2014CPCs at lwo temperatures
D. Wimmer et al.
Title Page
Abstract Introduction
Conclusions References
Tables Figures
◭ ◮
◭ ◮
Back Close
Full Screen / Esc
Printer-friendly Version Interactive Discussion
Discussion
P
a
per
|
Discus
sion
P
a
per
|
Discussion
P
a
per
|
Discussion
P
a
per
|
typically 10 cm−3, the relative errors of the measurements are large. This means that the results are qualitative. Time and technical limitations prevented the acquisition of more data. Nevertheless there is a clear shift in the cut-off diameter towards larger sizes at lower temperatures. This could indicate that there is some evaporation of the smallest particles, preventing detection in the CPC. The reason for that might also be 5
due to the fact that the rack with the calibration setup was at−30◦C for all the
measure-ments, because the temperature control for the rack was not capable of going lower, as the heat load in the rack was bigger than expected. The trend is not very clear on the other hand as the−26.9◦C curve does not fall in line with the other results. The
shift in the cut-off size could also be caused by shifts in the temperature- dependent 10
diffusion losses, but the calculation (Baron and Willeke, 2001) shows that this diff er-ence is negligible. The diffusion loss corrected d50 is at 2.7 nm, whereas it is 2.8 nm
for the uncorrected data points for the −26.9◦C data points. Another explanation for
the unexpected behaviour for the calibration results at−26.9◦C might be that for those
measurements the temperature inside the temperature controlled rack was at+2◦C
15
whereas it was−30◦C for the other low temperature calibration measurements.
5.2 Comparison of growth rates
Figure 4 shows the growth rates in nm h−1on the x-axis as a function of temperature for the laminar flow DEG CPCs, the PSMs and the NAIS. The growth rates are normalized to a sulfuric acid concentration of 107cm−3. As the growth rates were calculated from 20
different nucleation experiments performed at different sulfuric acid concentrations, the normalization was done as described in Eq. (1). All the GRs are determined at about 2 nm. The GRs are averaged for the different temperature ranges [206–208] K, [221– 223] K and [245–248] K and also the temperatures are averaged for each range. The error bars show the standard deviation of the averages of the growth rates. When 25
ACPD
14, 12797–12817, 2014CPCs at lwo temperatures
D. Wimmer et al.
Title Page
Abstract Introduction
Conclusions References
Tables Figures
◭ ◮
◭ ◮
Back Close
Full Screen / Esc
Printer-friendly Version Interactive Discussion
Discussion
P
a
per
|
Discus
sion
P
a
per
|
Discussion
P
a
per
|
Discussion
P
a
per
|
the+5◦C and
+25◦C data. The GR calculated from the DEG CPCs and the PSM agree
within a factor of 1.2, whereas the GR from the NAIS are about a factor of 2.2 higher compared to the DEG CPCs at −65◦C. The higher GR from the NAIS might be due
to the fact that it was measuring negatively charged particles only which are expected to be higher than neutral GRs, also they were calculated following the mode of the 5
distribution (i.e. the maximum concentration in the respective size bin). The calculated collision limited growth rates show the opposite trend, which is very likely due to the effect that it does not take evaporation into account.
5.3 Theoretical calculation of growth rates
The GR can be described as, 10
GR=kc∆dp, (3)
∆dpis the change of diameter due to the condensing sulphuric acid andkc is the
con-densation rate. The concon-densation rate and the change in diameter was determined for a particle of 2 nm with the SAWNUC model (Lovejoy et al., 2004). Equation (3) is only valid for situations without evaporation. Very small particles have higher evapo-15
ration rates than bigger particles, due to the Kelvin effect (McKenzie et al., 1984). In fact particles below the critical diameter, if such a diameter exists, will mainly evapo-rate while particles bigger than the critical diameter will grow. In these calculations the evaporation effect on the growth rate is given by,
GR=(kc−ke)∆dp. (4)
20
Withke being the evaporation rate as described by Lovejoy et al., 2004. This equa-tion allows the evaporaequa-tion of particles if the vapour pressure of condensing vapour is low, i.e. evaporation dominates over condensation. At higher temperatures the growth rates were calculated for a sulphuric acid concentration of 7×108cm−3, as at this
ACPD
14, 12797–12817, 2014CPCs at lwo temperatures
D. Wimmer et al.
Title Page
Abstract Introduction
Conclusions References
Tables Figures
◭ ◮
◭ ◮
Back Close
Full Screen / Esc
Printer-friendly Version Interactive Discussion
Discussion
P
a
per
|
Discus
sion
P
a
per
|
Discussion
P
a
per
|
Discussion
P
a
per
|
chamber (Kirkby et al., 2011). NH3can lower the saturation vapour pressure of sulfuric acid over these small aerosols, though the magnitude of this effect depends on the composition in gas and aerosol phase (Clegg et al., 2008). SAWNUC includes only aerosols containing H2SO4 and water in the calculation, the calculations give never-theless a good indication about the growth rate behaviour when evaporation can not 5
be neglected. The results from those calculations compared to the experimental data are shown as the purple triangles in Fig. 4. The comparison with the data shows that the SAWNUC predictions show a similar temperature trend as the experimental data (i. e. smaller GR for higher temperatures). This drop off at higher temperatures remains unclear, nevertheless the higher GR retrieved from the NAIS data compared to the 10
SAWNUC model sand to the GRs from the CPCs at the lower temperatures might be due to a charge enhancement (Laakso et al., 2003).
6 Conclusions
We investigated the performance of the Diethylene Glycol (DEG) based CPC under temperatures typical for the upper troposphere, by performing a set of calibration mea-15
surements at temperatures between−25◦C and −65◦C. Here the CLOUD chamber
was used as aerosol particle source and a nano-DMA to size select the particles. As the total particle concentration was low, a single particle counter (Particle Size Mag-nifier; PSM) was used as reference instrument for the calibration measurements. The results show that there is a shift in the cut-offdiameter of the CPC towards bigger sizes 20
compared to the laboratory calibrations at room temperature. The cut-off sizes were 2.5 nm for −65.9◦C, 2.8 nm for −50.5◦C, 2.5 nm for −26.9◦C and 1.4 nm for +25◦C
(room temperature) for a DEG CPC. The calibrations at−26.9◦C do not fall in line with
the other temperatures as the cut-offcurve is between the−50◦C and−65.9◦C
mea-surements. However as the maximum concentration of particles after the DMA was 25
ACPD
14, 12797–12817, 2014CPCs at lwo temperatures
D. Wimmer et al.
Title Page
Abstract Introduction
Conclusions References
Tables Figures
◭ ◮
◭ ◮
Back Close
Full Screen / Esc
Printer-friendly Version Interactive Discussion
Discussion
P
a
per
|
Discus
sion
P
a
per
|
Discussion
P
a
per
|
Discussion
P
a
per
|
towards the bigger sizes, but the exact numbers for the cut-off diameters need to be treated carefully. Nevertheless for the first time, a sub-3 nm CPC has been calibrated under upper tropospheric relevant temperatures. In addition the calibration ments were done using the same particle composition as for the nucleation measure-ments. That means that the shift in the cut-off diameters is only due to the different 5
temperatures and not influenced by the chemical composition of the particles.
We used a method to analyze growth rates based on the difference in the cut-off
sizes between two DEG CPCs, using the results from the calibration measurements and compared the calculated growth rates with those derived from other instruments. To evaluate the validity of the results, the GR have been compared to the growth rates 10
determined from mixing type CPCs (PSMs) and an ion spectrometer (NAIS) at diff er-ent temperatures. All the instrumer-ents show higher GRs for lower temperatures. The average value of the growth rates from the NAIS show somewhat higher values (factor of 2.2) compared to the GRs determined from the DEG CPCs. The growth rates be-tween PSM and DEG CPCs agree within a factor of 1.2. The growth rates converge 15
for all instruments for temperatures above 0◦C. This indicates that growth rates at low temperatures might be under-estimated. However the CPCs detect both charged and neutral particles, whereas the NAIS measured only negatively charged particles. The GRs calculated from kinetically limited collision rates of sulfuric acid and water show the opposite temperature trend, but here evaporation is not taken into account. The 20
SAWNUC (Lovejoy et al., 2004) model where evaporation is taken into account, shows a similar temperature trend. We have shown that when using CPCs at upper tropo-spheric temperatures, it has to be taken into account that cut-off diameters might be shifted towards bigger sizes. This effect might be due to evaporation of the smallest particles or to a change in the saturator temperature (i.e. supersaturaiton) profile. This 25
ACPD
14, 12797–12817, 2014CPCs at lwo temperatures
D. Wimmer et al.
Title Page
Abstract Introduction
Conclusions References
Tables Figures
◭ ◮
◭ ◮
Back Close
Full Screen / Esc
Printer-friendly Version Interactive Discussion
Discussion
P
a
per
|
Discus
sion
P
a
per
|
Discussion
P
a
per
|
Discussion
P
a
per
|
Acknowledgements. We would like to thank CERN for supporting CLOUD with important technical and financial resources, and for providing a particle beam from the CERN Proton Synchrotron. We also thank P. Carrie, L.-P. De Menezes, J. Dumollard, F. Josa, I. Krasin, R. Kristic, A. Laassiri, O. S. Maksumov, B. Marichy, H. Martinati, S. V. Mizin, R. Sitals, A. Wasem and M. Wilhelmsson for their important contributions to the experiment. We would 5
like to thank Francesco Riccobono for helping with the setup of the calibration unit and we would also like to thank Jasper Kirkby for giving the opportunity to use the CLOUD cham-ber for the calibration measurements. This research has received funding from the EC Sev-enth Framework Programme (Marie Curie Initial Training Network “CLOUD-ITN” no. 215072, MC-ITN “CLOUD-TRAIN” no. 316662, Starting “MOCAPAF” grant no. 57360 and ERC-10
Advanced “ATMNUCLE” grant no. 227463), the German Federal Ministry of Education and Re- search (project nos. 01LK0902A and 01LK1222A), the Swiss National Science Foundation (project nos. 200020 135307 and 206620 130527), the Academy of Finland (Center of Ex-cellence project no. 1118615), the Academy of Finland (135054, 133872, 251427, 139656, 139995, 137749, 141217, 141451), the Finnish Funding Agency for Technology and Inno-15
vation, the Väisälä Foundation, the Nessling Foundation, the Austrian Science Fund (FWF; project no. P19546 and L593), the Portuguese Foundation for Science and Technology (project no. CERN/FP/116387/2010), the Swedish Research Council, Veten-skapsradet (grant 2011-5120), the Presidium of the Russian Academy of Sciences and Russian Foundation for Basic Research (grants 08-02-91006-CERN and 12-02-91522-CERN), and the US National Science 20
Foundation (grants AGS1136479 and CHE1012293).
References
Almeida, J., Schobesberger, S., Kürten, A., Ortega, K. I., Kupiainen, O., Praplan, A. P., Amorim, A., Bianchi, F., Breitenlechner, M., David, A., Dommen, J., Donahue, N. M., Dow-nard, A., Dunne, E., Duplissy, J., Ehrhart, S., Flagan, R. C., Franchin, A., Roberto, G., 25
ACPD
14, 12797–12817, 2014CPCs at lwo temperatures
D. Wimmer et al.
Title Page
Abstract Introduction
Conclusions References
Tables Figures
◭ ◮
◭ ◮
Back Close
Full Screen / Esc
Printer-friendly Version Interactive Discussion
Discussion
P
a
per
|
Discus
sion
P
a
per
|
Discussion
P
a
per
|
Discussion
P
a
per
|
Tröstl, J., Tsagkogeorgas, G., Vaattovaara, P., Viisanen, Y., Virtanen, A., Vrtala, A., Wag-ner, P., WeingartWag-ner, E., Wex, H., Williamson, C., Wimmer, D., Ye, P., Yli-Juuti, T., Carslaw, K., Kulmala, M., Curtius, J., Baltensperger, U., Worsnop, D., Vehkamäki, H., and Kirkby, J.: Molecular understanding of amine-sulphuric acid particle nucleation in the atmosphere, Na-ture, 502, 359–363, 2013. 12803
5
Ball, S. M., Hanson, D. R., Eisele, F. L., and McMurry, P. H.: Laboratory studies of particle nucleation: initial results for H2SO4, H2O and NH3 vapors, J. Geophys. Res., 104, 23709– 23718, 1999. 12800
Baron, P. A. and Willeke, K.: Aerosol Measurement, Wiley Interscience, University of Michigan, 2001.
10
Clegg, S. L., Kleeman, M. J., Griffin, R. J., and Seinfeld, J. H.: Effects of uncertainties in the thermodynamic properties of aerosol components in an air quality model – Part 2: Predic-tions of the vapour pressures of organic compounds, Atmos. Chem. Phys., 8, 1087–1103, doi:10.5194/acp-8-1087-2008, 2008. 12807
Crumeyrolle, S., Manninen, H. E., Sellegri, K., Roberts, G., Gomes, L., Kulmala, M., Weigel, R., 15
Laj, P., and Schwarzenboeck, A.: New particle formation events measured on board the ATR-42 aircraft during the EUCAARI campaign, Atmos. Chem. Phys., 10, 6721–6735, doi:10.5194/acp-10-6721-2010, 2010. 12799
Duplissy, J., Enghoff, M. B., Aplin, K. L., Arnold, F., Aufmhoff, H., Avngaard, M., Bal-tensperger, U., Bondo, T., Bingham, R., Carslaw, K., Curtius, J., David, A., Fastrup, B., 20
Gagné, S., Hahn, F., Harrison, R. G., Kellett, B., Kirkby, J., Kulmala, M., Laakso, L., Laakso-nen, A., Lillestol, E., Lockwood, M., Mäkelä, J., Makhmutov, V., Marsh, N. D., NiemiLaakso-nen, T., Onnela, A., Pedersen, E., Pedersen, J. O. P., Polny, J., Reichl, U., Seinfeld, J. H., Sipilä, M., Stozhkov, Y., Stratmann, F., Svensmark, H., Svensmark, J., Veenhof, R., Verheggen, B., Viisanen, Y., Wagner, P. E., Wehrle, G., Weingartner, E., Wex, H., Wilhelmsson, M., and 25
Winkler, P. M.: Results from the CERN pilot CLOUD experiment, Atmos. Chem. Phys., 10, 1635–1647, doi:10.5194/acp-10-1635-2010, 2010. 12800
Jiang, J., Chen, M., Kuang, C., Attoui, M., and McMurry, P. H.: Electrical mobility spectrometer using a diethylene glycol condensation particle counter for measurement of aerosol size distributions down to 1 nm, Aerosol Sci. Tech., 45, 510–521, 2011a. 12799
30
ACPD
14, 12797–12817, 2014CPCs at lwo temperatures
D. Wimmer et al.
Title Page
Abstract Introduction
Conclusions References
Tables Figures
◭ ◮
◭ ◮
Back Close
Full Screen / Esc
Printer-friendly Version Interactive Discussion
Discussion
P
a
per
|
Discus
sion
P
a
per
|
Discussion
P
a
per
|
Discussion
P
a
per
|
analyzers for sub-2 nm particle classification, Aerosol Sci. Tech., 45, 480–492, 2011b. 12801, 12803
Kangasluoma, J., Kuang, C., Wimmer, D., Rissanen, M. P., Lehtipalo, K., Ehn, M., Worsnop, D. R., Wang, J., Kulmala, M., and Petäjä, T.: Sub-3 nm particle size and com-position dependent response of a nano-CPC battery, Atmos. Meas. Tech., 7, 689–700, 5
doi:10.5194/amt-7-689-2014, 2014. 12799
Kirkby, J., Curtius, J., Almeida, J., Dunne, E., Duplissy, J., Ehrhart, S., Franchin, A., Gagne, S., Ickes, L., Kürten, A., Kupc, A., Metzger, A., Riccobono, F., Rondo, L., Schobesberger, S., Tsagkogeorgas, G., Wimmer, D., Amorim, A., Bianchi, F., Breitenlechner, M., David, A., Dom-men, J., Downard, A., Ehn, M., Flagan, R. C., Haider, S., Hansel, A., Hauser, D., Jud, W., 10
Junninen, H., Kreissl, F., Kvashin, A., Laaksonen, A., Lehtipalo, K., Lima, J., Lovejoy, E. R., Makhmutov, V., Mathot, S., Mikkilä, J., Minginette, P., Mogo, S., Nieminen, T., Onnela, A., Pereira, P., Petäjä, T., Schnitzhofer, R. H., Seinfeld, J., Sipilä, M., Stozhkov, Y., Stratmann, F., Tome, A., Vanhanen, J., Viisanen, Y., Vrtala, A., Wagner, P. E., Walther, H., Weingartner, E., Wex, H., Winkler, P. M., Carslaw, K. S., Worsnop, D. R., Baltensperger, U., and Kulmala, M.: 15
Role of sulphuric acid, ammonia and galactic cosmic rays in atmospheric aerosol nucleation, Nature, 476, 429–433, 2011. 12800, 12803, 12807
Kuang, C., Chen, M., McMurry, P. H., and Wang, J.: Modification of laminar flow ultrafine con-densation particle counters for the enhanced detection of 1 nm concon-densation nuclei, Aerosol Sci. Tech., 46, 309–315, 2011. 12799
20
Kürten, A., Rondo, L., Ehrhart, S., and Curtius, J.: Performance of a corona ion source for measurement of sulfuric acid by chemical ionization mass spectrometry, Atmos. Meas. Tech., 4, 437–443, doi:10.5194/amt-4-437-2011, 2011. 12801
Kulmala, M., Mordas, G., Petäjä, T., Grönholm, T., Aalto, P. P., Vehkamäki, H., Hienola, A. I., Herrmann, E., Sipilä, M., Riipinen, I., Manninen, H. E., Hämeri, K., Stratmann, F., Bilde, M., 25
Winkler, P. M., Birmili, W., and Wagner, P. E.: The condensation particle counter battery (CPCB): a new tool to investigate the activation properties of nanoparticles, J. Aerosol Sci., 38, 289–304, 2007. 12799
Kulmala, M., Kontkanen, J., Junninen, H. Lehtipalo, K., Manninen, H. E., Nieminen, T., Petäjä, T., Sipilä, M., Schobesberger, S., Rantala, P., Franchin, A., Jokinen, T., Järvi-30
ACPD
14, 12797–12817, 2014CPCs at lwo temperatures
D. Wimmer et al.
Title Page
Abstract Introduction
Conclusions References
Tables Figures
◭ ◮
◭ ◮
Back Close
Full Screen / Esc
Printer-friendly Version Interactive Discussion
Discussion
P
a
per
|
Discus
sion
P
a
per
|
Discussion
P
a
per
|
Discussion
P
a
per
|
Smith, J. N., Ehn, M., Mentel, T. F., Lehtinen, K. E. J., Laaksonen, A., Kerminen, V.-M., and Worsnop, D. R.: Direct observations of atmospheric aerosol nucleation, Science, 339, 943– 946, 2013. 12799, 12803
Kupc, A., Amorim, A., Curtius, J., Danielczok, A., Duplissy, J., Ehrhart, S., Walther, H., Ickes, L., Kirkby, J., Kürten, A., Lima, J. M., Mathot, S., Minginette, P., Onnela, A., Rondo, L., and 5
Wagner, P. E.: A fibre-optic UV system for H2SO4production in aerosol chambers causing minimal thermal effects, J. Aerosol Sci., 42, 532–543, 2011. 12800
Laakso, L., Kulmala, M., and Lehtinen, K. E. J.: Effect of condensation rate enhancement factor on 3-nm (diameter) particle formation in binary ion-induced and homogeneous nucleation, J. Geophys. Res., 108, D184574, doi:10.1029/2003JD003432, 2003. 12807
10
Lehtipalo, K., Leppä, J., Kontkanen, J., Kangasluoma, J., Franchin, A., Wimmer, D., Schobes-berger, S., Junninen, H., Petäjä, T., Sipilä, M., Mikkilä, J., Vanhanen, J., Worsnop, D. R., and Kulmala, M.: Methods for determining particle size distribution and growth rates between 1–3 nm using the Particle Size Magnifier, Boreal Environ. Res., accepted, 2014. 12803 Lovejoy, E. R., Curtius, J., and Froyd, K. D.: Atmospheric ion-induced nucleation of sulfuric 15
acid and water, J. Geophys. Res.-Atmos., 109, D08204, doi:10.1029/2003JD004460, 2004. 12806, 12808
Mckenzie, R. L., Agarwal, J. K., Pohl, F. G., Preining, O., Reischl, G., Szymanski, W., Wag-ner, P. E., Liu, B. Y. H., and Pui, D. Y. H.: Measurements of Kelvin-equivalent size distribu-tions of well-defined aerosols with particle diameters greater-than 13 nm, Aerosol Sci. Tech., 20
3, 107–115, 1984. 12806
McMurry, P. H.: The history of condensation nucleus counters, Aerosol Sci. Tech., 33, 297–322, 2000. 12798
Mirme, S. and Mirme, A.: The mathematical principles and design of the NAIS – a spectrometer for the measurement of cluster ion and nanometer aerosol size distributions, Atmos. Meas. 25
Tech., 6, 1061–1071, doi:10.5194/amt-6-1061-2013, 2013. 12803
Nieminen, T., Lehtinen, K. E. J., and Kulmala, M.: Sub-10 nm particle growth by vapor conden-sation – effects of vapor molecule size and particle thermal speed, Atmos. Chem. Phys., 10, 9773–9779, doi:10.5194/acp-10-9773-2010, 2010. 12799, 12817
O’Dowd, C. D., Geever, M., Hill, M. K., Jennings, S. G., and Smith, M. H.: New particle formation: 30
ACPD
14, 12797–12817, 2014CPCs at lwo temperatures
D. Wimmer et al.
Title Page
Abstract Introduction
Conclusions References
Tables Figures
◭ ◮
◭ ◮
Back Close
Full Screen / Esc
Printer-friendly Version Interactive Discussion
Discussion
P
a
per
|
Discus
sion
P
a
per
|
Discussion
P
a
per
|
Discussion
P
a
per
|
Schobesberger, S., Junninen, H., Bianchi, F., Lönn, G., Ehn, M., Lehtipalo, K., Dommen, J., Ehrhart, S., Ortega, I. K., Franchin, A., Nieminen, T., Riccobono, F., Hutterli, M., Duplissy, J., Almeida, J., Amorim, A., Breitenlechner, M., Downard, A. J., Dunne, E. M., Flagan, R. C., Ka-jos, M., Keskinen, H., Kirkby, J., Kupc, A., Kürten, A., Kurten, T., Laaksonen, A., Mathot, S., Onnela, A., Praplan, A. P., Rondo, L., Santos, F. D., Schallhart, S., Schnitzhofer, R., Sipilä, M., 5
Tome, A., Tsagkogeorgas, G., Vehkamäki, H., Wimmer, D., Baltensperger, U., Carslaw, K. S., Curtius, J., Hansel, A., Petäjä, T., Kulmala, M., Donahue, N. M., and Worsnop, D. R.: Molec-ular understanding of atmospheric particle formation from sulfuric acid and large oxidized organic molecules, P. Natl. Acad. Sci. USA, 110, 17223–17228, 2013a. 12800
Schobesberger, S., Väänänen, R., Leino, K., Virkkula, A., Backman, J., Pohja, T., Siivola, E., 10
Franchin, A., Mikkilä, J., Paramonov, M., Aalto, P. P., Krejci, R., Petäjä, T., and Kulmala, M.: Airborne measurements over the boreal forest of southern Finland during new particle for-mation events in 2009 and 2010, Boreal Environ. Res., 18, 145–163, 2013b. 12799
Sipilä, M., Lehtipalo, K., Attoui, M., Neitola, K., Petäjä, T., Aalto, P. P., O’Dowd, C. D., and Kulmala, M.: Laboratory verification of PH-CPC’s ability to monitor atmospheric sub-3 nm 15
clusters, Aerosol Sci. Tech., 43, 126–135, 2009. 12799
Vanhanen, J., Mikkilä, J., Lehtipalo, K., Sipilä, M., Manninen, H. E., Siivola, E., Petäjä, T., and Kulmala, M.: Particle size magnifier for Nano-CN detection, Aerosol Sci. Tech., 45, 533–542, 2011. 12799
Voigtländer, J., Duplissy, J., Rondo, L., Kürten, A., and Stratmann, F.: Numerical simulations 20
of mixing conditions and aerosol dynamics in the CERN CLOUD chamber, Atmos. Chem. Phys., 12, 2205–2214, doi:10.5194/acp-12-2205-2012, 2012. 12800
Wimmer, D., Lehtipalo, K., Franchin, A., Kangasluoma, J., Kreissl, F., Kürten, A., Kupc, A., Metzger, A., Mikkilä, J., Petäjä, T., Riccobono, F., Vanhanen, J., Kulmala, M., and Curtius, J.: Performance of diethylene glycol-based particle counters in the sub-3 nm size range, Atmos. 25
ACPD
14, 12797–12817, 2014CPCs at lwo temperatures
D. Wimmer et al.
Title Page
Abstract Introduction
Conclusions References
Tables Figures
◭ ◮
◭ ◮
Back Close
Full Screen / Esc
Printer-friendly Version Interactive Discussion
Discussion
P
a
per
|
Discus
sion
P
a
per
|
Discussion
P
a
per
|
Discussion
P
a
per
|
Figure 1.Sketch of the calibration setup. The calibration unit was in a temperature controlled rack, while the CPCs were at room temperature. The temperature inside the rack was−30◦C for the measurments at lower temperatures, whereas the rack temperature was+2◦C for the measurements at−26.9◦C in the chamber. To minimize di
ACPD
14, 12797–12817, 2014CPCs at lwo temperatures
D. Wimmer et al.
Title Page
Abstract Introduction
Conclusions References
Tables Figures
◭ ◮
◭ ◮
Back Close
Full Screen / Esc
Printer-friendly Version Interactive Discussion
Discussion
P
a
per
|
Discus
sion
P
a
per
|
Discussion
P
a
per
|
Discussion
P
a
per
|
Figure 2.Example of a nucleation experiment during CLOUD5. The temperature inside the
ACPD
14, 12797–12817, 2014CPCs at lwo temperatures
D. Wimmer et al.
Title Page
Abstract Introduction
Conclusions References
Tables Figures
◭ ◮
◭ ◮
Back Close
Full Screen / Esc
Printer-friendly Version Interactive Discussion
Discussion
P
a
per
|
Discus
sion
P
a
per
|
Discussion
P
a
per
|
Discussion
P
a
per
|
Figure 3.Results from calibration measurements. The blue, green and red curves show fits
to the results from calibration measurements done at CLOUD in fall 2011 and the symbols show the measured data points, at three different temperatures (−26.9◦C,
−50.5◦C,−65◦C).
Black curve shows laboratory calibrations (Wimmer et al., 2013), using negatively charged ammonium sulfate clusters. Thed50is shifted from about 1.4 nm at room temperature to 2.5 nm in the case of−65.9◦C about 2.6 nm for
−26.9◦C and for the−50.5◦C, the cut-offis shifted to
ACPD
14, 12797–12817, 2014CPCs at lwo temperatures
D. Wimmer et al.
Title Page
Abstract Introduction
Conclusions References
Tables Figures
◭ ◮
◭ ◮
Back Close
Full Screen / Esc
Printer-friendly Version Interactive Discussion
Discussion
P
a
per
|
Discus
sion
P
a
per
|
Discussion
P
a
per
|
Discussion
P
a
per
|