ACPD
12, 29657–29704, 2012Characterization of urban aerosol in Cork
City
M. Dall’Osto et al.
Title Page
Abstract Introduction
Conclusions References
Tables Figures
◭ ◮
◭ ◮
Back Close
Full Screen / Esc
Printer-friendly Version Interactive Discussion
Discussion
P
a
per
|
Dis
cussion
P
a
per
|
Discussion
P
a
per
|
Discussio
n
P
a
per
|
Atmos. Chem. Phys. Discuss., 12, 29657–29704, 2012 www.atmos-chem-phys-discuss.net/12/29657/2012/ doi:10.5194/acpd-12-29657-2012
© Author(s) 2012. CC Attribution 3.0 License.
Atmospheric Chemistry and Physics Discussions
This discussion paper is/has been under review for the journal Atmospheric Chemistry and Physics (ACP). Please refer to the corresponding final paper in ACP if available.
Characterization of urban aerosol in Cork
City (Ireland) using aerosol mass
spectrometry
M. Dall’Osto1,*, J. Ovadnevaite1, D. Ceburnis1, D. Martin1, R. M. Healy2, I. P. O’Connor2, J. R. Sodeau2, J. C. Wenger2, and C. O’Dowd1
1
School of Physics and Centre for Climate and Air Pollution Studies, Ryan Institute, National University of Ireland Galway, Galway, Ireland
2
Department of Chemistry and Environmental Research Institute, University College Cork, Ireland
*
now at: Institute for Environmental Assessment and Water Research (IDAEA-CSIC), Barcelona, Spain
Received: 31 July 2012 – Accepted: 29 September 2012 – Published: 19 November 2012
Correspondence to: M. Dall’Osto (manuel.dallosto@gmail.com)
ACPD
12, 29657–29704, 2012Characterization of urban aerosol in Cork
City
M. Dall’Osto et al.
Title Page
Abstract Introduction
Conclusions References
Tables Figures
◭ ◮
◭ ◮
Back Close
Full Screen / Esc
Printer-friendly Version Interactive Discussion
Discussion
P
a
per
|
Dis
cussion
P
a
per
|
Discussion
P
a
per
|
Discussio
n
P
a
per
|
Abstract
Ambient wintertime background urban aerosol in Cork City, Ireland, was character-ized using aerosol mass spectrometry. During the three-week measurement study in 2009, 93 % of the 1 200 000 single particles characterized by an Aerosol Time-Of-Flight Mass Spectrometer (TSI ATOFMS) were classified into five organic-rich particle types,
5
internally-mixed to different proportions with Elemental Carbon (EC), sulphate and ni-trate while the remaining 7 % was predominantly inorganic in nature. Non-refractory PM1aerosol was also characterized using a High Resolution Time-Of-Flight Aerodyne Aerosol Mass Spectrometer (HR-ToF-AMS) and was also found to comprise organic matter as the most abundant species (62 %), followed by nitrate (15 %), sulphate (9 %)
10
and ammonium (9 %), and then chloride (5 %).
Positive matrix factorization (PMF) was applied to the HR-ToF-AMS organic matrix and a five-factor solution was found to describe the variance in the data well. Specif-ically, “Hydrocarbon-like” Organic Aerosol (HOA) comprised 19 % of the mass, “Oxy-genated low volatility” Organic Aerosols (LV-OOA) comprised 19 %, “Biomass wood
15
Burning” Organic Aerosol (BBOA) comprised 23 %, non-wood solid-fuel combustion “Peat and Coal” Organic Aerosol (PCOA) comprised 21 %, and finally, a species type characterized by primarym/zpeaks at 41 and 55, similar to previously-reported “Cook-ing” Organic Aerosol (COA) but possessing different diurnal variations to what would be expected for cooking activities, contributed 18 %. Despite wood, cool and peat
be-20
ing minor fuel types used for domestic space heating in urban areas, their relatively low combustion efficiencies result in a significant contribution to PM1 aerosol mass (44 % and 28 % of the total organic aerosols mass and non refractory PM1, respectively).
1 Introduction
A substantial number of studies have shown a strong relationship between levels of
25
ACPD
12, 29657–29704, 2012Characterization of urban aerosol in Cork
City
M. Dall’Osto et al.
Title Page
Abstract Introduction
Conclusions References
Tables Figures
◭ ◮
◭ ◮
Back Close
Full Screen / Esc
Printer-friendly Version Interactive Discussion
Discussion
P
a
per
|
Dis
cussion
P
a
per
|
Discussion
P
a
per
|
Discussio
n
P
a
per
|
2006; Dockery et al., 1993; Fenger, 1999). Current air-quality standards (WHO, 2005) for particulate matter (PM) are based on total mass in a specific size range (PM10 or PM2.5), although exposures to particles from different sources may potentially elicit different health effects or exposure-response relationships (Harrison et al., 2000). PM is known to comprise a variety of different chemical components, each with their own
5
sources, behaviors and impacts (Pio et al., 2007). The formulation of cost-effective abatement strategies for atmospheric pollution strongly depends on knowledge of the contributions of individual source categories.
Within the European Union (EU), wide variations in PM10 levels and characteristics can be found. For example, the contribution of mineral dust to all PM size fractions
10
is largest in Southern Europe, and the contribution of sea salt to PM10 is largest in Northwestern Europe, while the ratio Total Carbon/PM10 is generally largest in Central Europe (Putaud et al., 2010).
Within Ireland, the 2009 annual PM10 mean concentrations measured at eighteen monitoring stations across the country were below the European Commission specified
15
daily limit of 50 µg m−3(EPA, 2009) and all locations were compliant with the standards introduced since 2005. In contrast, the PM2.5 limits of 25µg m−3
are often exceeded during winter times in Ireland (EPA, 2009).
This study characterizes the fine PM fraction (i.e. the PM2.5) in the harbor area of Cork, a city of about 120 000 inhabitants in the South of the Republic of Ireland.
Dur-20
ing the year 2009, the average Cork city PM10mass concentration was 18±10 µg m− 3
and the 50 µg m−3 EU limit was exceeded only six times (EPA, 2009). The average PM2.5 concentration at Old Station Road (a monitoring station in the Cork city centre) for the year 2009 was 8 µg m−3, but during winter months was found to often exceed the daily limit (25 µg m−3). Previous work revealed that in urban Irish areas, the major
25
ACPD
12, 29657–29704, 2012Characterization of urban aerosol in Cork
City
M. Dall’Osto et al.
Title Page
Abstract Introduction
Conclusions References
Tables Figures
◭ ◮
◭ ◮
Back Close
Full Screen / Esc
Printer-friendly Version Interactive Discussion
Discussion
P
a
per
|
Dis
cussion
P
a
per
|
Discussion
P
a
per
|
Discussio
n
P
a
per
|
aerosols, but only about half of the particulate matter was analyzed, leaving the or-ganic fraction uncharacterized (Hellebust et al., 2010). Healy et al. (2010) reported six predominant PM sources: traffic (23 %), marine (13 %), long range transport (13), general combustion (11 %), domestic combustion (4.5 %) and shipping (1.5 %) but this was a study conducted in August where domestic solid fuel (DSF) burning was at a
5
minimum. By contrast, Kourtchev et al. (2011) reported contribution of DSF burning to the measured OC mass concentration up to 74.9 % during the winter season.
The objective of this study is to characterize the fine PM component detected in an Irish urban background location by using an array of both on-line and off-line aerosol techniques in order to improve the source identification of aerosol at very high time
10
resolution in the atmosphere. We deployed two different state-of-the-art on-line aerosol mass spectrometers: ATOFMS and HR-ToF-AMS. The ATOFMS provides single parti-cle information on the abundance of different types of aerosol particles as a function of particle size with high time resolution, whereas the AMS quantitatively measures mass concentrations of the non-refractory aerosol components as well as species-resolved
15
size distributions. Whilst the ATOFMS does not have clear source apportionment ca-pabilities due to the difficulties in quantification of its outputs, the AMS has proven itself to be a powerful tool in that regards (Canagaratna et al., 2007). Additionally, we also used data from off-line filter based techniques to support the particle types obtained from the statistical analysis of the aerosol mass spectrometry datasets.
20
2 Experimental
2.1 Location
The campaign took place from 1 to 22 February 2009 at the Tivoli Industrial Estate and Docks, Cork, Ireland (51◦54′5′′N, 8◦24′38′′W, see Fig. 1). A detailed description of the site is given elsewhere (Healy et al., 2009; Hellebust et al., 2010). Briefly, the
25
ACPD
12, 29657–29704, 2012Characterization of urban aerosol in Cork
City
M. Dall’Osto et al.
Title Page
Abstract Introduction
Conclusions References
Tables Figures
◭ ◮
◭ ◮
Back Close
Full Screen / Esc
Printer-friendly Version Interactive Discussion
Discussion
P
a
per
|
Dis
cussion
P
a
per
|
Discussion
P
a
per
|
Discussio
n
P
a
per
|
400–600 m to the southwest, while the main road carrying traffic east out of the city and towards Dublin lies 200 m to the north of the site. Residential areas immediately surround the site on all sides except the north and northeast. Air quality data from the monitoring station in the city centre (Old Station Road, 3 km from the monitoring site) were also used in order to compare them with the data obtained in this study.
5
2.2 Offline aerosol techniques
PM2.5aerosol samples were collected on Pallflex quartz fiber filters (150 mm diameter, pre-fired for 24 h at 580◦C) using a High Volume (Digitel) sampler with a flow rate of 500 L min−1
. The sampling was conducted during 2–22 February 2009 at 6 h resolution. The filters were extracted and analyzed by Gas Chromatography/Mass Spectrometry
10
(GC/MS) as described in Kourtchev et al. (2011). Briefly, The GC/MS system consisted of an Agilent 6890 N gas chromatograph system (Agilent Technologies, Palo Alto, CA, USA) coupled to an Agilent 5975 quadrupole mass selective detector. Out of the fif-teen organic marker compounds in PM2.5 aerosol detected by the GC-MS (Kourtchev et al., 2011), only levoglucosan, galactosan and mannosan were detected above the
15
detection limit during the current study. Furthermore, PM2.5aerosol samples were also chemically characterized for water-soluble species. Chemical analysis of inorganic con-tent in the PM2.5 fraction employed ion chromatography (Dionex ICS-2000) providing concentrations for F, Cl, Br, Nitrate and Sulphate.
2.3 On line aerosol techniques
20
A TEOM (tapered element oscillating microbalance, Thermo Electron model 1400a) was deployed on-site for the measurement of PM2.5mass concentrations. The TEOM data were scaled with collocated gravimetric measurements during the field study. PM2.5and PM10data were also available from the monitoring station of the Old Station Road in Cork city centre (EPA, 2009). Elemental carbon and organic carbon (EC/OC)
25
ACPD
12, 29657–29704, 2012Characterization of urban aerosol in Cork
City
M. Dall’Osto et al.
Title Page
Abstract Introduction
Conclusions References
Tables Figures
◭ ◮
◭ ◮
Back Close
Full Screen / Esc
Printer-friendly Version Interactive Discussion
Discussion
P
a
per
|
Dis
cussion
P
a
per
|
Discussion
P
a
per
|
Discussio
n
P
a
per
|
instrument (Sunset Laboratory Inc., field model 3rd generation) fitted with a PM2.5 cy-clone. The ATOFMS (Model 3800-100, TSI, Inc.) was used to measure bipolar mass spectra of individual aerosol particles (Gard et al., 1997). Ambient aerosol is focused into a narrow particle beam for sizes between 100 nm and 3 µm. Using a 2-laser ve-locimeter particle sizes are determined from particle velocity after acceleration into the
5
vacuum. In addition, the light scattered by the particles is used to trigger a pulsed high power desorption and ionization laser (λ=266 nm, about 1 mJ/pulse) which evaporates and ionizes the particle in the centre of the ion source of a bipolar reflectron ToF-MS. Thus, a positive and negative ion mass spectrum are obtained for each single particle. The HR-ToF-AMS focuses aerosol particles in the size range 50–600 nm quantitatively
10
onto a hot surface (about 600◦C) using an aerodynamic lens assembly (DeCarlo et
al., 2006). Non-refractory particle components flash-evaporate on the hot surface; the evolving vapour is electron impact (70 eV) ionized and the ions are transported into an orthogonal extraction ToF-MS for high-resolution mass analysis. The HR-ToF-AMS was deployed in the standard configuration, taking both mass spectrum (MS) and
par-15
ticle time of flight (pToF) data. The instrument was alternatively run in “V-mode” (with a mass resolution of up to 3000 m/1 m) and “W-mode” by using a second reflectron, which increases resolution to 6000 m/1 m but decreases sensitivity by approximately one order of magnitude. The HR-ToF-AMS was calibrated using 300 nm monodisperse ammonium nitrate particles. Calibrations were performed during the campaign,
includ-20
ing particle-Time-of-Flight calibration to convert the particle flight times into particle diameters and to determine the instrument background parameters by measurements through a high efficiency particulate air filter (HEPA filter) during the campaign.
2.3.1 Mass Spectrometer Data Processing
ATOFMS
25
ACPD
12, 29657–29704, 2012Characterization of urban aerosol in Cork
City
M. Dall’Osto et al.
Title Page
Abstract Introduction
Conclusions References
Tables Figures
◭ ◮
◭ ◮
Back Close
Full Screen / Esc
Printer-friendly Version Interactive Discussion
Discussion
P
a
per
|
Dis
cussion
P
a
per
|
Discussion
P
a
per
|
Discussio
n
P
a
per
|
Data Analyzer) and single particle mass spectra were clustered with Adaptive Reso-nance Theory neural network, ART-2a (Song et al., 1999). The parameters used for ART-2a were: learning rate 0.05, vigilance factor 0.85, and iterations 20. Similar clus-ters obtained by ART-2a were manually merged (Dall’Osto and Harrison, 2006) so that the total number of clusters describing the whole dataset was reduced to ten.
5
HR-ToF-AMS
Mass concentrations and size distributions of the aerosol species measured with the HR-ToF-AMS were calculated using the methods outlined by DeCarlo et al. (2006). Standard ToF-AMS data analysis software packages (SQUIRREL v1.49 and PIKA v1.08) were used. For mass concentration calculations, an empirical particle
collec-10
tion efficiency (CE) factor of 0.5 was used, already widely found to be representative for ambient particles in many AMS studies (Jayne et al., 2000; Canagaratna et al., 2007) and the value of 0.5 was further validated by inter-comparison with off-line ion mass concentration measurements (see Sect. 3.4.1). The HR-ToF-AMS organic matrix was analyzed by PMF, a bilinear unmixing model that identifies factors which serve to
15
approximately reconstruct the measured organic mass spectra for each point in time. Each factor is comprised of a (constant) mass spectrum and a time series of mass concentration and all values in the factors are constrained to be positive. The model is solved by minimizing the sum of the weighed squared residuals of the fit (known asQ). The PMF model was solved with the PMF2.exe algorithm v.4.2 using as inputs
20
the high-resolution OA mass spectral matrix and associated error matrix (Paatero and Tapper, 1994).
2.4 Other techniques
A suite of real-time gas analyzers was located at the site for the duration of the cam-paign: SO2, NO/NOxand O3were monitored using Thermo Electron models 43i, 5020
ACPD
12, 29657–29704, 2012Characterization of urban aerosol in Cork
City
M. Dall’Osto et al.
Title Page
Abstract Introduction
Conclusions References
Tables Figures
◭ ◮
◭ ◮
Back Close
Full Screen / Esc
Printer-friendly Version Interactive Discussion
Discussion
P
a
per
|
Dis
cussion
P
a
per
|
Discussion
P
a
per
|
Discussio
n
P
a
per
|
SPA, 42i and 49i respectively. Wind speed, wind direction, temperature, humidity and rainfall were monitored using a Casella NOMAD weather station deployed on the mon-itoring site. All instruments sampled air through stainless steel tubing from a height of 4 m above ground level. Meteorological data were also obtained from monitoring sta-tions in the city centre, Port of Cork and Cork Airport. The meteorological data overall
5
compared well, but the most complete and reliable set of measurements were found to be from Cork Airport and were used in this study.
2.5 Peat and coal burning experiment
In order to facilitate the quantification of the relative contribution of different domestic fuel sources to ambient PM1levels a series of controlled experiments were undertaken
10
to obtain mass spectra of peat and coal combustion. A controlled combustion exper-iment for each of the fuel types was performed, with each been burned for approxi-mately 40 min in an outdoor grate with the fresh combustion particles being introduced into the HR-ToF-AMS. The coal used was smokeless coal which is a legal prerequisite for burning coal in Cork City as it is a designated smokeless fuel zone. Peat, which is
15
used extensively in Ireland for domestic space heating, was obtained locally.
3 Results
3.1 Meteorology
The air mass back trajectories (Draxler et al., 2003) analysis is presented in Sect. S1, where the sampling days were classified as continental-marine Polar (cmP, 6 days),
20
continental Polar (cP, 2 days), marine Arctic (mA, 4 days) and marine Polar (mP, 10 days). Taking the approach of Rimetz-Planchon (2008) – investigating PM10 pollu-tion episodes associated with meteorological situapollu-tions in an urban and industrialized coastal site of the southern part of the North Sea – and by considering both air mass back trajectories and local meteorology, two different scenarios of seven days each
ACPD
12, 29657–29704, 2012Characterization of urban aerosol in Cork
City
M. Dall’Osto et al.
Title Page
Abstract Introduction
Conclusions References
Tables Figures
◭ ◮
◭ ◮
Back Close
Full Screen / Esc
Printer-friendly Version Interactive Discussion
Discussion
P
a
per
|
Dis
cussion
P
a
per
|
Discussion
P
a
per
|
Discussio
n
P
a
per
|
were postulated: stagnant air mass conditions (days 1 to 3, 16 to 19 February, named “stagnant” period, Period S.) and cold marine air mass (consecutive days : 5 to 11 February, named “marine” period, Period M.). It is important to note that the temporal trend of sea spray ATOFMS particle type (see Sect. 3.3) was also used to validate the two different scenarios. It should also be noted that air arriving from the Atlantic Ocean
5
will in many cases have traversed part of Ireland and therefore collected pollution to some degree before reaching the site. However, the main significance of mP air masses is that they are faster moving and therefore cause enhanced dilution of local pollutants. The Period M. is characterised by colder Atlantic air masses (2.7±2◦C) and stronger winds (4.9±3 m s−1) relative to Period S. (4.9±2◦C and 3.7±2 m s−1, respectively,
10
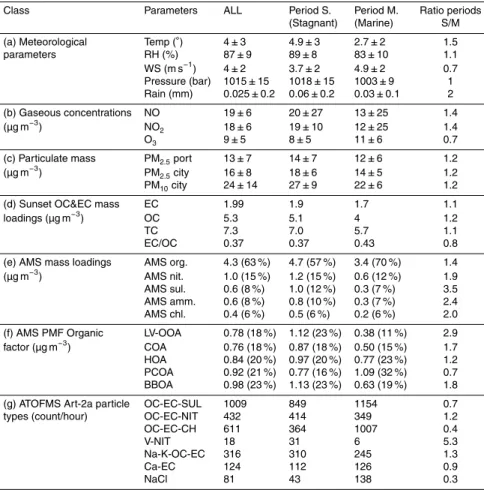
Fig. S1 and Table 1a). Figure 2a shows the diurnal profiles for the Relative Humidity (RH) and temperature (T) for three different scenarios: all field measurement sampling campaign, Period S. and Period M. The Period M. scenario presents a stronger day-night variation period (4.3◦) relative to the S. period (1.9◦).
3.2 Air quality parameters: PM and gaseous concentrations
15
PM10values were not exceeded at the city of Cork for any of the days of the field study, with a daily average mean of PM10 of 24±10 µg m−
3
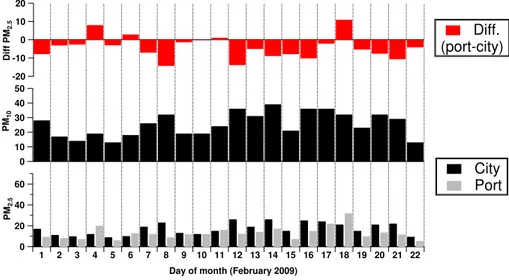
(Table 1c). By contrast, PM2.5 exceeded the limit value of 25 µg m−3 for two times and one time for the city and the port area, respectively (Fig. 3). During S. conditions, level of PMxand nitrogen gaseous pollutants were higher than during Period M., likely to be due to the low average wind
20
speed (Table 1b, c). The monitoring site at the port was found to present lower PM values relative to the city centre monitoring site, with an average of 4.1 µg m−3 higher PM2.5 at the city centre relative to the port site. However, Fig. 2 shows higher PM2.5 values at the port for days 4th, 6th, 11th, 18th and all of those were explained by spe-cific local emissions (see Sect. 3.3). Gaseous concentrations for NO and NO2 were
25
ACPD
12, 29657–29704, 2012Characterization of urban aerosol in Cork
City
M. Dall’Osto et al.
Title Page
Abstract Introduction
Conclusions References
Tables Figures
◭ ◮
◭ ◮
Back Close
Full Screen / Esc
Printer-friendly Version Interactive Discussion
Discussion
P
a
per
|
Dis
cussion
P
a
per
|
Discussion
P
a
per
|
Discussio
n
P
a
per
|
9±5 µg m−3) were found to moderately increase between 11:00 a.m. and 04:00 p.m., due to the limited photochemical activity encountered during colder months in the Eu-ropean Northern latitudes. Finally, seven spikes of elevated SO2concentrations were detected during the field study, associated with a specific particle type detected with the aerosol mass spectrometers, attributed to local ship emissions and discussed in
5
Sect. 4.2.
3.3 Single particle mass spectrometry analysis
The ATOFMS dataset was reduced to ten different particle types, further reduced to four more generic categories as summarized in Table 2: organic, inorganic, spikes and Nitrate-Chloride. Organic particles represented 93 % of the total particles classified,
10
whereas inorganic particles represented less than 7 % of the sample. Ship emissions were defined by the strong Vanadium signature (Pastor et al., 2003), whereas “spikes” were defined as ATOFMS particle types peaking for short periods of times and at-tributed to local PM sources. All those percentages are by all means only qualitative as the ATOFMS efficiency depends on the particle type (Gross et al., 2000).
Nitrate-15
Chloride (2.7 % of the total classified) presented only negative ion mass spectra, and will be object of future publications. The ten specific particle types and their relative percentage concentrations are listed below:
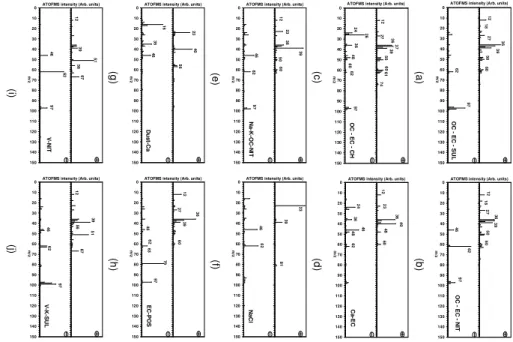
– OC-EC-SUL (Organic Carbon-Elemental Carbon-Sulphate; 37.8 %). Figure 4a shows the positive mass spectra with peaks due to OC (m/z 27, 37, 43, 50)
20
and EC (m/z 12, 36, 48, 60) and negative spectra dominated by sulphate (m/z−97) (Dall’Osto and Harrison, 2006). This cluster was found to comprise the strongest sulphate signature, with a size distribution concentration maximum at 250 nm diameter and a diurnal trend (Fig. 2c) peaking during the evening (07:00– 11:00 p.m.), pointing towards a domestic combustion source.
25
ACPD
12, 29657–29704, 2012Characterization of urban aerosol in Cork
City
M. Dall’Osto et al.
Title Page
Abstract Introduction
Conclusions References
Tables Figures
◭ ◮
◭ ◮
Back Close
Full Screen / Esc
Printer-friendly Version Interactive Discussion
Discussion
P
a
per
|
Dis
cussion
P
a
per
|
Discussion
P
a
per
|
Discussio
n
P
a
per
|
nitrate (m/z −46 and −62) is observed in the negative spectrum. This particle type presented a larger size distribution diameter peak occurring at 400 nm and in contrast with the OC-EC-SUL temporal trend, exhibits a later nighttime peak (Fig. 2c). This particle type can be associated to the condensation of nitrate on existing aerosols occurring at lower nighttime temperatures.
5
– OC-EC-CH (Organic Carbon-Elemental Carbon-Hydrocarbon rich; 22.6 %). This particle type, internally mixed with both nitrate and sulphate, contained a unique feature in terms of high CxHy peaks with m/z 37 (C3H+) representing the strongest base peak (Fig. 4c). Moreover, the negative spectra are characteris-tics of primary hydrocarbon species (m/z peaks including −24, −25 and −26;
10
[CxH−y]), rather than secondary species as seen associated with the previous two particle types (Fig. 4a, b). Cluster OC-EC-CH was found to possess a number size mode around 250 nm, and a diurnal profile (Fig. 2c) similar to that associated with OC-EC-SUL, albeit more pronounced during the period from 07:00–09:00 p.m., also pointing to a local combustion source.
15
– Ca-EC (Calcium-Elemental Carbon; 4.8 %) The positive ion mass ATOFMS spec-tra of Fig. 4d show strong peaks atm/z40 (Ca) and EC peaks (m/z12, 24, 36, 48, 60) are also observed in both positive and negative mass spectra. This parti-cle type was only detected in the lower size range of the ATOFMS (ca. 150 nm), was found to spike during morning rush hour times (Fig. 2c) and it is attributed to
20
lubricating oil from traffic emissions (Spencer et al., 2006; Drewnick et al., 2008).
– Na-K-OC-NIT (Sodium-Potassium-Organic Carbon-Nitrate; 17.9 %). This particle type (Fig. 4e) was found internally-mixed with both inorganic species such as sodium (m/z23) and potassium (m/z39) and OC (m/z 12, 27, 36, 37, 43, 50). It contains less intense EC peaks relative to the other ATOFMS particle types
25
ACPD
12, 29657–29704, 2012Characterization of urban aerosol in Cork
City
M. Dall’Osto et al.
Title Page
Abstract Introduction
Conclusions References
Tables Figures
◭ ◮
◭ ◮
Back Close
Full Screen / Esc
Printer-friendly Version Interactive Discussion
Discussion
P
a
per
|
Dis
cussion
P
a
per
|
Discussion
P
a
per
|
Discussio
n
P
a
per
|
It is likely these two particle types are nitrate containing particles with different inorganic-organic mixing state.
– NaCl (Sodium Chloride; 3.0 %). Figure 4f shows peaks at m/z23 (Na),m/z 81 (Na2Cl) and nitrate (m/z −46 andm/z −62). This feature is typical of ATOFMS mass spectra representative of sea salt particles internally mixed with nitrate
5
(Dall’Osto et al., 2004), and these particles exhibit the largest size mode of all the ATOFMS particle types (>1 µm).
– Ca-Dust (Calcium-Dust; 0.1 %). Figure 4g shows peaks due to Na (m/z23), Ca (m/z 40), Fe (m/z 56), Cl (m/z −35) and nitrate (m/z −62). This particle type also exhibits a coarse mode (>1 µm), and was observed during short events on
10
4, 9, 11 and 18 February, mainly during morning times and likely to be due to resuspension of dust (Guazzotti et al., 2003).
– EC-POS (Elemental Carbon – Phosphate; 0.1 %). Figure 4h shows EC signals (m/z 12, 36, 60) in the positive mass spectrum and a strong peak at m/z 79 due to phosphate (PO−3) in the negative spectrum. This particle type presented
15
a size distribution mode in the finest ATOFMS fraction at about 200 nm, and has previously been attributed to lubricating oil from vehicles (Spencer et al., 2006). It was found to spike on 10, 14 and 20 February, mainly during morning times and attributed to highly localized vehicle emissions.
– V-NIT (Vanadium-nitrate; 0.7 %). Figure 4i shows the positive mass spectra with
20
a strong vanadium signature (m/z 51 [V] and 67 [VO]) and minor peaks due to carbon (m/z 12), K (m/z 39) and Fe (m/z 56). The negative mass spectra shows mainly nitrate (m/z −46 and −62) and to a less extent sulphate (m/z −97). This particle was found mainly during Period S. and with a size distribution peak at about 400 nm. We attribute this particle type to aged ship emissions/oil
25
ACPD
12, 29657–29704, 2012Characterization of urban aerosol in Cork
City
M. Dall’Osto et al.
Title Page
Abstract Introduction
Conclusions References
Tables Figures
◭ ◮
◭ ◮
Back Close
Full Screen / Esc
Printer-friendly Version Interactive Discussion
Discussion
P
a
per
|
Dis
cussion
P
a
per
|
Discussion
P
a
per
|
Discussio
n
P
a
per
|
– V-K-SUL (Vanadium-Potassium-Sulphate, 0.2 %). Figure 4j shows a vanadium-rich particle type internally mixed with potassium (m/z 39) and sulphate (m/z −97). Relative to the other V-rich particle type (V-NIT), it presents a much smaller characteristic size range (250 nm), and its correlation with SO2 spikes points to fresh ship emissions. A more in-depth discussion of V-rich particles can be found
5
in Sect. 4.2.1.
Whilst the AMS has a well proven capability to quantify generic source-related cat-egories of non refractory aerosol, the ATOFMS gives mass spectral information for in-dividual particles. Even after clustering particles with similar size distribution and mass spectral characteristics, the ATOFMS presents information which can be very difficult to
10
interpret in relation to the sources or atmospheric processing (Dall’Osto and Harrison, 2012). The ATOFMS cannot provide quantitative aerosol mass loading concentrations, but its unique strength relies in the fact that it can monitor in real time variations the single particle composition. In this study ATOFMS particle types NaCl, V-rich particles and Ca-EC can be attributed to sea spray, ship and vehicular traffic emissions
(respec-15
tively). By contrast, it is more difficult to attribure the ATOFMS particle types to specific space heating aerosol sources. This is a surprising finding, as a number of ATOFMS studies report biomass burning particles in ambient air (Pastor et al., 2003; Moffet et al., 2008). Healy et al. (2010) also reported ATOFMS average mass spectral signatures for coal, peat and wood combustion by measuring fresh combustion particles emitted
20
from an outdoor stove. Broadly, peat particles were unique as rich in sodium and hydro-carbon like species; coal particles were found to have the strongest sulphate signature and the lowest metallic content; and wood positive ATOFMS ion mass spectra were found dominated by potassium atomic ions (K+,m/z39 andm/z113 [K2Cl]+). Among common peaks attributed to EC and OC (usually C+n), peaks atm/z37 andm/z55 are
25
ACPD
12, 29657–29704, 2012Characterization of urban aerosol in Cork
City
M. Dall’Osto et al.
Title Page
Abstract Introduction
Conclusions References
Tables Figures
◭ ◮
◭ ◮
Back Close
Full Screen / Esc
Printer-friendly Version Interactive Discussion
Discussion
P
a
per
|
Dis
cussion
P
a
per
|
Discussion
P
a
per
|
Discussio
n
P
a
per
|
were found containing such peak (<0.1 %). However, a number of particles were found containing peaks atm/z113 (1 %),m/z37 (11 %) andm/z55 (7 %). Table S2 shows the correlations of these three key peaks (m/z37,m/z 55 andm/z113) associated with the five main organic ATOFMS particle types. Interestingly, these three peaks do not appear to correlate with traffic emissions (Ca-EC) nor with nitrate-rich secondary
5
organic particle types (OC-EC-NIT and Na-K-OC-NIT). By contrast, cluster OC-EC-CH seems correlated the most with potassium chloride ion markers, whilst OC-EC-SUL is more associated with strong hydrocarbon like species atm/z37 andm/z55.
The temporal nature of the OC-EC-CH particle type suggests having a combus-tion source origin. Addicombus-tionally, the strongest correlacombus-tion with biomass indicators (m/z
10
113, K2Cl) as well as the high similarity with the laboratory spectra obtained by Healy et al. (2010) also suggest a domestic peat combustion source. Cluster OC-EC-SUL shows a similarity to coal particle ATOFMS mass spectra, but the mass spectra do not contain useful marker ions and thus could also be assigned to other sources, possibly including fresh and aged different types of domestic combustion processes. Based on
15
their temporal nature and comparison with the standard spectra reported in the litera-ture, we assign the particles types OC-EC-CH and OC-EC-SUL to domestic fuel com-bustion sources, with the former being more associated with peat comcom-bustion. These particle types contributed to up to 47.2 % of the total particles classified, pointing to domestic fuel combustion as the major aerosol source in this study.
20
3.4 HR-ToF-AMS
3.4.1 Aerosol mass loadings and basic analysis
The AMS Collection Efficiency (CE) used was 0.5. (Middlebrook et al., 2012) An inter-comparison of chemical species measured by the AMS and those derived from other techniques gave very good correlations withR2between 0.78 and 0.96 (Fig. S2). These
25
ACPD
12, 29657–29704, 2012Characterization of urban aerosol in Cork
City
M. Dall’Osto et al.
Title Page
Abstract Introduction
Conclusions References
Tables Figures
◭ ◮
◭ ◮
Back Close
Full Screen / Esc
Printer-friendly Version Interactive Discussion
Discussion
P
a
per
|
Dis
cussion
P
a
per
|
Discussion
P
a
per
|
Discussio
n
P
a
per
|
chloride suggests all of it is non refractory (i.e. in the form of NH4Cl). Figure 5 shows that 63 % of the aerosol mass loading detected by the AMS is organic aerosol, with nitrate contributing 15 %, sulphate and ammonium 9 %, and Chloride 5 %.
Within the organic fraction, 68 % of the ion signal was due to the CxH+y category, followed by CxHyO+1 (27 %) and CxHyO+2 (2.5 %). The average concentration found
5
for organic aerosol was 4.3±2.6 µg m−3, nitrate was 1.0±0.7 µg m−3, sulphate was 0.6±0.4 µg m−3, ammonium was 0.6±0.4 µg m−3 and chloride was 0.4±0.3 µg m−3. The relatively high amount of chloride relative to other inorganic species is likely to be due to domestic combustion sources during winter times (Lanz et al., 2010). The diurnal profile of the total aerosol mass measured by the AMS (Fig. 2d) shows a
morn-10
ing peak between 07:00 a.m. and 11:00 a.m., and an evening peak between 06:00 p.m. and 11:00 p.m.. The organic fraction shows a similar pattern, but only the morning peak correlates with that of EC and NO (Fig. 2b), which is primarily due to local traffic emis-sions.
The evening peak in total aerosol mass is mostly due to domestic heating, as
dis-15
cussed in the next section. Nitrate showed lower concentrations in the afternoon be-tween 01:00 p.m. and 05:00 p.m. (three fold decrease relative to the daily hourly av-erage), suggesting that gas-aerosol partitioning was mainly contributing to this signal. By contrast, sulphate showed the least diurnal variation of all the aerosol species. Am-monium also showed lower concentrations in the afternoon, with a diurnal profile in
20
between nitrate and sulphate (Fig. 2d), likely due to the combined result of the varia-tions of (NH4)2SO4, NH4NO3and NH4Cl. Chloride showed much lower concentrations in the afternoon, slowly increasing its concentrations towards night time hours and peaking between 09:00 p.m. and 01:00 a.m. (Fig. 2d). This is due to both the semi-volatile nature of NH4Cl, the dynamics of the planetary boundary layer (PBL), and the
25
ACPD
12, 29657–29704, 2012Characterization of urban aerosol in Cork
City
M. Dall’Osto et al.
Title Page
Abstract Introduction
Conclusions References
Tables Figures
◭ ◮
◭ ◮
Back Close
Full Screen / Esc
Printer-friendly Version Interactive Discussion
Discussion
P
a
per
|
Dis
cussion
P
a
per
|
Discussion
P
a
per
|
Discussio
n
P
a
per
|
3.4.2 PMF analysis on AMS organic aerosol (OA) matrix
The PMF analysis was performed for 1 to 7 factors, and the diagnostic plots of the results from different solutions are shown in Supplement part SI 4. It was found that the PMF solutions with factor numbers greater than 5 provided no new meaningful information and instead resulted in a behavior of the existing factors. Thus the five
5
factor solution was chosen as the optimal solution.
Hydrocarbon-like OA (HOA)
The mass spectrum of HOA (Fig. 6) is dominated by organic fragments for saturated hydrocarbons CnH+2n+1 (m/z 29, 43, 57, 71) and unsaturated hydrocarbons CnH+2n−1 (m/z27, 41, 55, 69, 83). Table S3 shows this factor possesses the strongest
correla-10
tions among all factors with hydrocarbon peaks atm/z43 (C3H7),m/z55 (C4H7) and m/z57 (C4H9). This factor is very similar to previously reported reference spectra of primary organic aerosol emitted from gasoline and diesel combustion sources (Cana-garatna et al., 2004) and the spectra of HOA components determined at other sites (Aiken et al., 2009; Mohr et al., 2012,R2=0.8). In addition, HOA was the only factor to
15
correlate with traffic tracers such as NOx (R2=0.39) and unique ATOFMS traffic parti-cle type Ca-EC (R2=0.35) (Table S5). Factor HOA presented a pronounced morning peak associated with traffic emissions (Fig. 2e). Table 3 illustrates that HOA has a dom-inant fraction of the organic mass spectra due to the CxH+y category (87 %). HOA on average accounts for 20 % of the total OA mass for the whole campaign (Fig. S4), and
20
it contributes 26 % of the CxH+y total signal, making it the largest contributor.
Low-volatility OOA (LV-OOA)
ACPD
12, 29657–29704, 2012Characterization of urban aerosol in Cork
City
M. Dall’Osto et al.
Title Page
Abstract Introduction
Conclusions References
Tables Figures
◭ ◮
◭ ◮
Back Close
Full Screen / Esc
Printer-friendly Version Interactive Discussion
Discussion
P
a
per
|
Dis
cussion
P
a
per
|
Discussion
P
a
per
|
Discussio
n
P
a
per
|
et al., 2007; Ulbrich et al., 2009;R2=0.9). It presents only 2 % of the spectra associ-ated with CxH+y ion category and 56 % associated to CxHyO+1 (Table 3). Table S3 con-firms the strongest correlation between this factor andm/z 44 (CO2, R
2
=0.64) and the weakest correlations with hydrocarbon CxH+y species. This is the most oxygenated of all OA components and its mass spectra appear to represent an end-product of OA
5
oxidation (Jimenez et al., 2009). Our results, consistent with previous studies at vari-ous sites (Zhang et al., 2005; Lanz et al., 2007; Ulbrich et al., 2009; Sun et al., 2010), show very good correlations between LV-OOA and secondary inorganic species (Ta-ble S5): nitrate (R2=0.79), ammonium (R2=0.77) and sulphate (R2=0.75). Further support for this unique factor can be seen in the strongest correlation among all factors
10
between LV-OOA and two ATOFMS organic-rich particle types internally mixed with nitrate (OC-EC-NIT and Na-K-OC-NIT) and attributed to secondary or aged aerosols (Dall’Osto and Harrison, 2012). The LV-OOA factor presents the least marked diur-nal variation (Fig. 2e) of all factors, peaking mainly during night time and likely driven mainly by boundary layer dynamics and possibly chemical processing. LV-OOA, on
av-15
erage, accounts for 19 % of the total OA mass for the whole campaign, and it is the main contributor to the total signal of CxHyO+1 (38 %) and CxHyO+2 (45 %).
Biomass burning OA (BBOA)
The identification of a BBOA component is often driven by a prominent contribution of m/z60 (Fig. 6), which is regarded as a tracer ion of biomass burning aerosols (Alfarra
20
et al., 2007; Aiken et al., 2009) and not present in HOA. High resolution analysis of the mass spectra obtained confirms that almost all the signal at this ion for ambient and source datasets is due to C2H4O+2 (Aiken et al., 2009; Mohr et al., 2009). Table 3 shows high correlations between BBOA andm/z60 (R2=0.99) in addition to correlations at m/z55 (C3H3O+,R
2
=0.95) andm/z57 (C3H5O+,R 2
=0.99). It is important to note
ACPD
12, 29657–29704, 2012Characterization of urban aerosol in Cork
City
M. Dall’Osto et al.
Title Page
Abstract Introduction
Conclusions References
Tables Figures
◭ ◮
◭ ◮
Back Close
Full Screen / Esc
Printer-friendly Version Interactive Discussion
Discussion
P
a
per
|
Dis
cussion
P
a
per
|
Discussion
P
a
per
|
Discussio
n
P
a
per
|
that the other ion peak usually associated with BBOA (m/z73, Alfarra et al., 2007) was removed from this analysis due to excessively large residuals at thism/z.
Regarding the CxH+y ion peaks, BBOA was found to correlated best with m/z 29 (C2H5), m/z 39 (C3H3) and m/z 41 (C3H5) (Table S3), while the peak at m/z 43 is mainly composed of the oxidized component C3H2O. In contrast to HOA, the peaks at
5
m/z 55 and m/z 57 contain both CxH+y (C4H7 and C4H9) and CxHyO+1 (C3H3O and C3H5O) families (Fig. 6).
When the time series of the BBOA factor are compared to other on-line and off -line measurements (Table S5), BBOA presents an excellent correlation with chloride (R2=0.87), and markers of biomass burning (levoglucosan,R2=0.80; K,R2=0.65)
10
supporting the assignment of the BBOA. The diurnal variation of this factor prevailing during night also confirms a domestic biomass burning source (Fig. 2e). BBOA was found to be the most abundant of all five AMS organic factors (23 %), with a mass spectrum dominated by CxH+y ions (68 %), followed by CxHyO+1 (24 %) and CxHyO+2 (6 %). Overall, it was found to contribute to 20 %, 24 % and 14 % to the total ion signal
15
of CxH+y, CxHyO+1 and CxHyO+2, respectively. In summary, AMS BBOA marker (m/z 60) is consistent with previous results that indicate that, although it is not a completely conserved tracer, at least a fraction of it persists during aging and it remains a good marker for BBOA (DeCarlo et al., 2010). Further discussions on this AMS PMF factor can be found in Sect. 4.
20
Peat and coal OA (PCOA)
The PCOA factor shows a similar sequence of peaks to HOA atm/z 41, 43, 55 and 57, which suggests a combustion source (Fig. 6). However, while them/z43 is mainly attributed to the CxH+y family (75 %), peaks due to CxHyO+z are seen atm/z28 and 44. Additionally, this factor presents an aromatic signature with strong peaks atm/z 69,
25
ACPD
12, 29657–29704, 2012Characterization of urban aerosol in Cork
City
M. Dall’Osto et al.
Title Page
Abstract Introduction
Conclusions References
Tables Figures
◭ ◮
◭ ◮
Back Close
Full Screen / Esc
Printer-friendly Version Interactive Discussion
Discussion
P
a
per
|
Dis
cussion
P
a
per
|
Discussion
P
a
per
|
Discussio
n
P
a
per
|
good correlations with biomass markers (levoglucosan,R2=0.84; K,R2=0.76). How-ever, while the BBOA factor correlates more with chloride, the PCOA factor corre-lates more with bromide (R2=0.76, Table S5). Furthermore, factor PCOA shows weak although unique correlations with two specific ATOFMS particle types (OC-EC-SUL R2=0.35 and OC-EC-CHR2=0.29, Table S5). The diurnal trends are slightly diff
er-5
ent to that observed for BBOA, peaking more during evening times (06:00–09:00 p.m.) and then decreasing while BBOA concentrations continue to increase (Fig. 2e). This would imply that this factor is more dominant during earlier evening hours. In sum-mary, we attribute this factor to solid fuel combustion not associated with wood biomass burning. In order to further validate our domestic solid fuel source attribution, we
com-10
pare the PCOA factor with the reference BBOA spectra (Ulbrich et al., 2012), and with AMS mass spectra obtained from the controlled experiments of peat and coal burning obtained in this study. First, the standard AMS reference spectra AMS factor BBOA (Ulbrich et al., 2012) was found to correlate only with BBOA (R2=0.7) and not with PCOA (R2=0.1). Second, the peat and coal controlled experiment signatures (Fig. 7)
15
were found to correlate only with ambient PCOA (R2=0.8 andR2=0.65, respectively) and not with any of other four AMS PMF factors. We therefore conclude that the am-bient PCOA factor is associated mainly with peat burning and to a less degree to coal burning. It is important to note that Fig. 7 mainly shows that peat burning presents a spectrum more similar this factor PCOA, with a peculiar strong aromatic signature at
20
m/z69, 91 and 115.
Peat is an accumulation of partially decayed vegetation matter with high water con-tent. It is a mixture of plant parts at different decomposition stages (IEA, 2007; Tuohy et al., 2009). The transformation of peat organic matter by chemical, biochemical and biological decay leads to the formation of a number of chemical substances among
25
ACPD
12, 29657–29704, 2012Characterization of urban aerosol in Cork
City
M. Dall’Osto et al.
Title Page
Abstract Introduction
Conclusions References
Tables Figures
◭ ◮
◭ ◮
Back Close
Full Screen / Esc
Printer-friendly Version Interactive Discussion
Discussion
P
a
per
|
Dis
cussion
P
a
per
|
Discussion
P
a
per
|
Discussio
n
P
a
per
|
correlation between Br and soil organic peat matter content has been reported (Kep-pler and Biester, 2003; Biester et al., 2004), consistent with our study (Table S5). Zac-cone et al. (2008) showed that more than 40 % of the total Br present in peat is stably retained into humic acids molecules especially in the upper central part of the peat profile.
5
The appreciable signal seen atm/z44 (Fig. 6), which implies a degree of oxygena-tion that would be consistent with humic-like substances (HULIS) that can be produced by biomass burning (Dinar et al., 2006; Weimer et al., 2008), along with the strong cor-relation between PCOA and Bromide make this cluster a unique one. In summary, this factor attributed to peat and coal combustion represents 21 % of the total OA mass,
10
and its mass spectra is dominated by CxH+y peaks (71 %), followed by CxHyO+1 (18 %) and CxHyO+2 (1 %). Notably, this factor presented the highest amount (55 %) of total signal due to organo nitrogen CxHyNzOpfamilies, also making this factor distinct from the others.
Cooking OA (COA)
15
A factor thought to be COA (Fig. 6) presents the unique feature among all five factors of havingm/zof 41 (C3H5) as a clear hydrocarbon peak. The second strongest CxH+y peak can be seen at m/z 55 (C4H7), as well as m/z 67 (C5H7). However, oxidized organic carbon peaks can also be seen. Them/z43 is mainly composed of its oxidized fraction (C3H2O) as well as the presence of strong signal atm/z 44 (CO2). Relative
20
to all other factors, whilst there is an enhancement of signal for CxH+y peaks at m/z 55 and 67, other common CxH+y peaks such as m/z 57 and m/z 69 are reduced (Fig. 6). Table S3 shows that factor COA presents the strongest correlations withm/z 41 (C3H5) andm/z55 (C3H3O), being two unique peaks attributed mainly to this factor. COA was found to contribute 18 % to the total OA mass and its mass spectra was
25
ACPD
12, 29657–29704, 2012Characterization of urban aerosol in Cork
City
M. Dall’Osto et al.
Title Page
Abstract Introduction
Conclusions References
Tables Figures
◭ ◮
◭ ◮
Back Close
Full Screen / Esc
Printer-friendly Version Interactive Discussion
Discussion
P
a
per
|
Dis
cussion
P
a
per
|
Discussion
P
a
per
|
Discussio
n
P
a
per
|
(3 %). There is an increasing amount of information in the literature associating this factor with cooking emissions. The first to report unit mass resolution (UMR) AMS factors featuring peaks atm/z 41 andm/z 55 was Lanz et al. (2007) who attributed it to charbroiling and food cooking. However, Mohr et al. (2009) pointed out that motor vehicles, plastic burning and meat cooking are very likely to be retrieved as a single
5
component in PMF analysis of AMS data due to the similarity of their UMR spectra. A possibility for the amalgamation of HOA and COA was also discussed by He et al. (2011), if traffic-related HOA and COA were temporally correlated at the sampling site of this campaign. Recent HR-ToF-AMS analysis of cooking and biomass emissions show high similarity, withm/z60 more significantly emitted from biomass burning but
10
also with contributing with detectable signals in cooking emissions. The MS of the COA is characterized by most prominent ions ofm/z 41 andm/z55, which indicates large presence of unsaturated organic compounds (e.g., unsaturated fatty acids) and is well consistent with the MS characteristics measured for primary cooking emissions (Allan et al. 2010; He et al., 2010). Table S5 does not show any clear correlation with any
15
collocated measurements for this COA factor. The diurnal variation does reflect cooking activity, with a diurnal variation at about 10:00 a.m.–12:00 p.m. and then during evening times (Fig. 2e). However, this factor increases soon after traffic rush hours and appears earlier than lunch time cooking activities. Furthermore, the evening peak does not seem to decrease after evening time meals (07:00–09:00 p.m.). Typical winter cooking time
20
ACPD
12, 29657–29704, 2012Characterization of urban aerosol in Cork
City
M. Dall’Osto et al.
Title Page
Abstract Introduction
Conclusions References
Tables Figures
◭ ◮
◭ ◮
Back Close
Full Screen / Esc
Printer-friendly Version Interactive Discussion
Discussion
P
a
per
|
Dis
cussion
P
a
per
|
Discussion
P
a
per
|
Discussio
n
P
a
per
|
4 Discussions
4.1 Aerosol mixing state and single particle analysis
The results obtained by the ATOFMS show that the majority of the particles are inter-nally mixed with both EC and OC. Additiointer-nally, two ATOFMS particle types distributed in the accumulation mode were found internally mixed with nitrate and organic species
5
(OC-EC-NIT and Na-K-OC-EC) and are associated with secondary aerosol. In con-trast, two main particle types were found rich in Sulphate (OC-EC-SUL) and hydro-carbon like species (OC-EC-CH) and were attributed to space heating combustion sources. Finally, a specific tracer for traffic combustion particles (internal mixture of Ca and EC) was found (Spencer et al., 2006; Drewnick et al., 2008; Dall’Osto et al.,
10
2009).
During this campaign we were able to successfully detect four spikes of PM which were responsible for the PM2.5 mass increase (Figs. 2, 8). The four PM2.5 spikes at the port exceeds concentrations it the city are attributable increases in Ca-dust and EC-POS particle type signals seen by the ATOFMS and represent periods influenced
15
by notable local emissions. NaCl was found to be a good tracer for separating different air mass types, when air mass back trajectories were not entirely clear. The other ATOFMS particle types found were rich in Vanadium, a type often associated with shipping emission and presented in the next section.
4.2 Primary aerosol source apportionment with tandem AMS-ATOFMS
20
4.2.1 Shipping and traffic emissions
Ship emissions represent one of the least regulated forms of anthropogenic pollution due in large part to the challenges involved in establishing international policies. Field observations have confirmed that ships produce significant amounts of soot, vanadium, nickel, and sulfate (Eatough et al., 1984; Xie et al., 2006; Pattanaik et al., 2007). Ships
ACPD
12, 29657–29704, 2012Characterization of urban aerosol in Cork
City
M. Dall’Osto et al.
Title Page
Abstract Introduction
Conclusions References
Tables Figures
◭ ◮
◭ ◮
Back Close
Full Screen / Esc
Printer-friendly Version Interactive Discussion
Discussion
P
a
per
|
Dis
cussion
P
a
per
|
Discussion
P
a
per
|
Discussio
n
P
a
per
|
typically burn residual fuel oil, which produces higher concentrations of heavy metals and soot than distillate fuels such as gasoline and diesel. ATOFMS studies often report a very specific cluster due the high ATOFMS response to vanadium (m/z51 [V]+ and m/z67 [VO]+) (Pastor et al., 2003; Harrison and Dall’Osto et al., 2006). Recent ad-hoc experiment reports single particles containing mixtures of organic carbon, vanadium,
5
and sulfate (OC-V-sulfate) resulted from residual fuel combustion (i.e., bunker fuel), whereas high quantities of fresh soot particles represented distinct markers for plumes from distillate fuel combustion (i.e., diesel fuel) from ships as well as trucks in the port area (Ault et al., 2009, 2010).
During this field campaign the port authority of Cork recorded 49 ship berthings,
10
three of them were close enough to our monitoring site as their emissions were de-tected by the ATOFMS as being rich V-K-SUL particle types. Furthermore, it is impor-tant to note that a second type of V-rich particle was detected (V-NIT), showing that aged V-rich particles are enriched in nitrate. The AMS did not see a specific OA factor for ship emissions, but an enhancement of HOA was seen during fresh ship emissions
15
spikes, as discussed in previous studies (Murphy et al., 2009; Lu et al., 2006).
4.2.2 Domestic solid fuel combustion
This AMS-ATOFMS study suggests that during winter time domestic solid fuel com-bustion is the major source of OA in Cork. Such high OA concentrations are usually recorded in Alpine valleys in winter, attributed mostly to primary wood burning
emis-20
sions (26–49 % of OA, Lanz et al., 2010). In small domestic combustion installations a wide variety of fuels are used and several combustion technologies are applied. The majority of domestic heating in Ireland relies on electricity, oil and natural gas, but coal is still commonly used as a solid fuel, along with peat, peat briquettes and to a lesser extent, wood (International Energy Agency, 2007; Kofman and Kent, 2006). There is
25
ACPD
12, 29657–29704, 2012Characterization of urban aerosol in Cork
City
M. Dall’Osto et al.
Title Page
Abstract Introduction
Conclusions References
Tables Figures
◭ ◮
◭ ◮
Back Close
Full Screen / Esc
Printer-friendly Version Interactive Discussion
Discussion
P
a
per
|
Dis
cussion
P
a
per
|
Discussion
P
a
per
|
Discussio
n
P
a
per
|
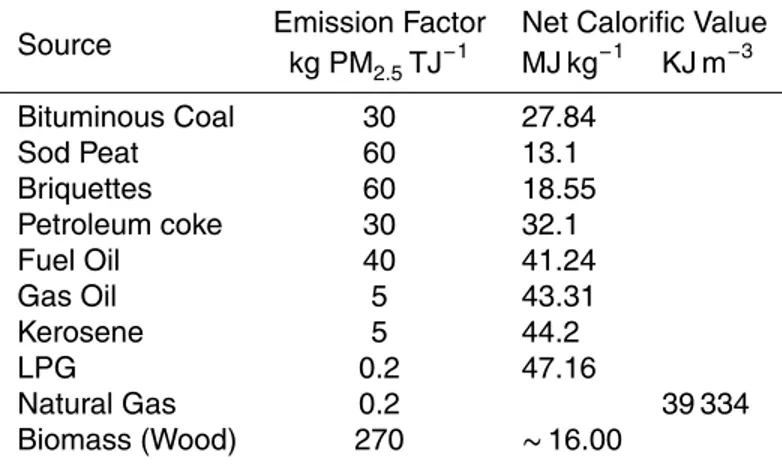
depend on the fuel, combustion technologies as well as on operational practices and maintenance. Table 4 shows the emission factors from the CEPMEIP Database (TNO, 2001), showing very high emission estimates for particulate matter for wood, peat and briquettes. Our results suggest that despite the fact wood and peat are minor sources of DF (Kofman and Kent, 2006), its poor combustion efficiency is responsible for very
5
high PM emissions.
Laboratory experiments of peat burning also reported to yield higher emission factors of total fine particles in comparison to other biofuels. Very high emissions factors of n-alkanes and n-alkenes are observed from peat (Iinuma et al., 2007), furan related compounds (Olsson et al., 2006) and aromatic volatile organic compounds (Blake at
10
al., 2009). It is finally important to remember that, given the fact raw peat contains elevated quantities of humic acid and bromide as a raw material, its combustions can can potentially lead to dioxin formation (Sinkkonen et al., 1995).
4.2.3 Cooking organic aerosol
The UMR ions ofm/z43,m/z44,m/z57, andm/z60 have been used as tracers in
15
MS of total OA, LV-OOA, HOA, and BBOA, respectively, because they typically corre-late well with these OA components in statistical analysis of ambient datasets (Zhang et al., 2005; Alfarra et al., 2007). Recent studies suggestm/z 41 (C3H5) andm/z55 (C4H7and C3H3O) as a peaks due to COA although the UMR ion ofm/z60, typically used as the tracer for biomass burning, is also observed in cooking emissions (He et
20
al., 2010). In other words, there is increasing evidence showing that peaks atm/z41, 55 and 60 may be distributed over a number of OA components, whereas the HOA and LV-OOA seems to be more defined factors. Table S3 shows the correlation between the five factors and a number of selected peaks. Specific peaks of C2H4O2(m/z 60, R2=0.99) and C3H5O (m/z57,R
2
=0.99) are highly correlated with BBOA. By
con-25
ACPD
12, 29657–29704, 2012Characterization of urban aerosol in Cork
City
M. Dall’Osto et al.
Title Page
Abstract Introduction
Conclusions References
Tables Figures
◭ ◮
◭ ◮
Back Close
Full Screen / Esc
Printer-friendly Version Interactive Discussion
Discussion
P
a
per
|
Dis
cussion
P
a
per
|
Discussion
P
a
per
|
Discussio
n
P
a
per
|
Recent measurements attribute a major part of primary OA to cooking activities: 16 % in New York (Sun et al., 2010), 25 % in London (Allan et al., 2010), 16 % in Manchester (Allan et al., 2010), 24 % in Beijing (Huang et al., 2010) and 17 % in Barcelona (Mohr et al., 2012). Whilst the mass spectra in this study was found to be similar to other COA spectra (R2=0.82 in Mohr et al., 2012 andR2=0.71 in Allan et al., 2010), the temporal
5
trend of COA in our study does not reflect the expected cooking aerosol activities in Cork, suggesting that other sources may be contributing to this factor.
4.3 Case study: marine versus stagnant time period
Table 1 shows average values for all study, M. period and S. period, as well as the ratio between S. versus M. average values (ratio S/M) of the measurements collected.
10
As expected, high PM values are seen for the period S. as a consequence of low dispersion conditions. In particular, higher concentrations of secondary species such as sulphate (ratio S/M 3.5), LV-OOA (ratio S/M 2.9) and ATOFMS secondary V-rich particle types (ratio S/M 5.3) can be explained as accumulation of secondary aerosol component accumulate over time in the S. period. By contrast, more NaCl is seen as
15
expected during period M. (ratio S/M 0.3). Primary particles such as AMS HOA and ATOFMS Ca-EC present a S/M ratio close to one, because they are expected to be independent of air mass origin and due to local traffic/ship emissions. An unexpected result is the different temporality of the two primary domestic heating sources BBOA and PCOA. Whilst BBOA is higher during stagnant conditions, the AMS factor PCOA
20
was found to present higher concentrations during marine conditions. Given the fact these two domestic heating sources are likely to be highly correlated, it is possible that there is a chemical (aging) and/or physical process (evaporation) affecting the life time of BBOA versus PCOA organic aerosols. ATOFMS cluster OC-EC-CH (the ATOFMS particle type with the highest correlation with AMS PCOA, Table S5) was also found to
25
ACPD
12, 29657–29704, 2012Characterization of urban aerosol in Cork
City
M. Dall’Osto et al.
Title Page
Abstract Introduction
Conclusions References
Tables Figures
◭ ◮
◭ ◮
Back Close
Full Screen / Esc
Printer-friendly Version Interactive Discussion
Discussion
P
a
per
|
Dis
cussion
P
a
per
|
Discussion
P
a
per
|
Discussio
n
P
a
per
|
time periods (Fig. 2a). The enhancement of BBOA during stagnant conditions may be simply due to a higher regional contribution of this source, but the high CH content of PCOA may also indicate a higher volatility, hence reducing its lifetime. Overall, this study is in line with previous ones reporting different physical and chemical features of peat burning relative to other biofuels (IInuma et al., 2007; Olsson 2006; Blake et al.,
5
2009).
4.4 Overall inter-comparison between ATOFMS ART-2a clusters and
HR-ToF-AMS PMF factors
Earlier work has demonstrated that the AMS-ATOFMS combination give greater in-sights into the behaviours of aerosol chemical physical processes than either technique
10
can alone (Dall’Osto et al., 2009a, b). The ATOFMS cannot provide direct quantitative aerosol mass loading concentrations, but its unique strength lies in the fact that it can monitor in real time variations in the single particle composition, usually giving a large variety of particle types (about 10–20). By contrast, the PMF analysis on the AMS organic matrix reveals precise quantitative features in the organic components of the
15
aerosols although a lower variety of aerosol types is usually obtained (about 3–5). The overall correlations between few quantitative OA AMS types and several qualitative organic/inorganic ATOFMS particle types is complex and unfortunately at times have proven to be rather weak (Dall’Osto and Harrison, 2012). Nonetheless, the deployment of both instrument types yields insights into aerosol sources and behaviour not
avail-20
able from one type alone. This study confirms previous ones (Dall’Osto et al., 2009a) showing a unique correlation between primary AMS HOA and primary ATOFMS Ca-EC (see Table S5). Additionally, aged secondary organic aerosols detected by the AMS (LV-OOA) was also found to be fairly well correlated with secondary organic species de-tected with the ATOFMS (Na-K-OC-EC,R2=0.65, Table S5). Weaker although unique
25
ACPD
12, 29657–29704, 2012Characterization of urban aerosol in Cork
City
M. Dall’Osto et al.
Title Page
Abstract Introduction
Conclusions References
Tables Figures
◭ ◮
◭ ◮
Back Close
Full Screen / Esc
Printer-friendly Version Interactive Discussion
Discussion
P
a
per
|
Dis
cussion
P
a
per
|
Discussion
P
a
per
|
Discussio
n
P
a
per
|
type, confirming previous studies in London (Dall’Osto and Harrison, 2012) showing the incapability of the ATOFMS to provide support for this aerosol source.
5 Conclusions
Two state-of-the-art on-line aerosol mass spectrometers (ATOFMS and HR-ToF-AMS) as well as a number of other off-line techniques were deployed for a three week field
5
measurement campaign in Cork, Ireland, during winter 2009. The ATOFMS revealed its unique capability to monitor in real time the variations in the single particle organic and inorganic composition. Unique particle types were attributed to sea spray, sec-ondary nitrate, shipping and vehicular traffic emissions. Several organic particle types could be attributed to general solid fuel domestic combustion sources, although the
10
source specificity of them could not be unambiguously assigned. PMF was applied to the HR-ToF-AMS organic matrix and a five-factor solution was found, supported both mathematically and with essential external correlations with parallel gaseous, aerosol off-line and ATOFMS measurements. AMS PMF factors HOA, LV-OOA, BBOA, PCOA and COA comprised 19 %, 19 %, 23 %, 21 % and 18 % of the total non refractory
or-15
ganic mass, respectively. The mass spectra of factor COA was found to correlate well with previous cooking aerosol laboratory mass spectra, but its high percentage as well its diurnal trend was found to be surprising. Further studies will be required to unam-biguously assign this factor correcly. The unique factor PCOA herein presented for the fist time was found to correlate with Br and a specific ATOFMS particle type, suggesting
20
peat and/or combustion aerosol is enriched in Br and both hydrocarbon and oxidized organic aerosol matter. Whilst wood burning BBOA seems to accumulate during stag-nant atmospheric conditions, the PCOA factor exhibits different evolutions, perhaps suggesting it is not a conservative tracer. Despite the fact that peat, wood and coal are minor fuels used for domestic space heating in urban areas, their low combustion
25