Lynnette M. Leone
Center for Visual and Cognitive Neuroscience, Department of Psychology, NDSU Department 2765, P.O. Box 6050, College of Science and Mathematics, North Dakota State University, Fargo, ND 58105-6050, USA; e-mail: [email protected]
Mark E. McCourt*
Center for Visual and Cognitive Neuroscience, Department of Psychology, NDSU Department 2765, P.O. Box 6050, College of Science and Mathematics, North Dakota State University, Fargo, ND 58105-6050, USA; e-mail: [email protected]
Received 15 April 2012, in revised form 12 December 2012; published online 3 June 2013.
Abstract. A series of experiments measured the audiovisual stimulus onset asynchrony
(SOAAV), yielding facilitative multisensory integration. We evaluated (1) the range of SOAAV
over which facilitation occurred when unisensory stimuli were weak; (2) whether the range of SOAAV producing facilitation supported the hypothesis that physiological simultaneity
of unisensory activity governs multisensory facilitation; and (3) whether AV multisensory facilitation depended on relative stimulus intensity. We compared response-time distributions to unisensory auditory (A) and visual (V) stimuli with those to AV stimuli over a wide range (300 and 20 ms increments) of SOAAV, across four conditions of varying stimulus intensity. In
condition 1, the intensity of unisensory stimuli was adjusted such that d ≈ 2. In condition 2, V stimulus intensity was increased (d 4), while A stimulus intensity was as in condition 1. In condition 3, A stimulus intensity was increased (d 4) while V stimulus intensity was as in condition 1. In condition 4, both A and V stimulus intensities were increased to clearly suprathreshold levels (d 4). Across all conditions of stimulus intensity, signiicant multisensory facilitation occurred exclusively for simultaneously presented A and V stimuli. In addition, facilitation increased as stimulus intensity increased, in disagreement with inverse effectiveness. These results indicate that the requirements for facilitative multisensory integration include both physical and physiological simultaneity.
Keywords: multisensory integration, neural coactivation, inverse effectiveness, race model, simultaneity, reaction
time, d.
1 Introduction
1.1 Multisensory integration
Meredith (2002) identiied two classes of multisensory convergence: areal and neuronal. Areal conver
-gence occurs when unisensory neurons from different modalities merely coexist within a brain region but do not interact. Neuronal convergence occurs when unisensory neurons from two or more modali
-ties make synaptic contact onto recipient “multisensory” neurons. Multisensory integration occurs when the response of multisensory neurons to convergent unisensory input differs qualitatively and quantitatively from that elicited by the individual unisensory inputs alone (Calvert, 2001).
1.2 The redundant signals effect
A well-known behavioral manifestation of facilitative multisensory integration is the decrease in response time (RT) to pairings of unisensory stimuli presented over multiple sensory channels, where RT to the multisensory combination is faster than to either unisensory signal alone. This enhancement in the speed of processing has been termed the “redundant signals effect,” or RSE (Miller, 1982). The RSE is not an exclusively multisensory phenomenon because it also occurs when the redundant signals occur within a single sensory modality (Iacoboni & Zaidel, 2003; Miller, 1986; Miniussi, Girelli, & Marzi, 1998; Molholm et al., 2002; Mordkoff & Yantis, 1991; Murray, Foxe, Higgins, Javitt, & Schroeder, 2001; Supek et al., 1999), but this paradigm has been widely employed in multisensory research.
The roles of physical and physiological simultaneity in
audiovisual multisensory facilitation
Miller (1982) compared two models that could potentially account for the RSE: separate acti
-vation or “race” models and neural coacti-vation models. Race models assume that each unisensory (redundant) signal is processed independently, such that on each trial the channel that processes the stimulus most quickly, and thus initiates the overt response, “wins” the race. According to race models, redundancy gains can result solely from statistical probability summation and no neural interaction between the activated sensory channels is required (although such interactions are not ruled out). In
contrast, neural coactivation models posit that signals from each unisensory channel interact in order to initiate the response. Coactivation across the two channels accumulates until a response criterion is reached, which can occur before the same criterion is reached by activation within either individual channel.
Miller (1982) derived a mathematical inequality describing the race model that speciies an upper limit on the cumulative probability (CP) of obtaining speeded RT to redundant stimuli. Miller’s ine
-quality asserts that the CP of obtaining the fastest responses to redundant signals must be less than or equal to the CP of obtaining the fastest responses to individual stimuli. Speciically, the race model states that for pairs of stimuli, i.e., auditory (A) and visual (V), at a given AV stimulus onset asyn
-chrony (SOAAV), at a given response latency (t), that
CP(RT t | AV) CP(RT t2SOAAV | A) 1 CP(RT t | V), (1)
where A is delayed relative to V, and
CP(RT t | AV) CP(RT t | A) 1 CP(RT t2SOAAV | V), (2)
where V is delayed relative to A. CP(RT t | AV) is the CP of obtaining an RT faster than time (t)
in response to the presentation of the A and V stimuli. This CP must be less than or equal to the
sum of the CPs of obtaining RTs faster than time in response to the individual unisensory stimuli, CP(RT t2SOAAV |A) 1 CP(RT T|V) or CP(RT t|A) 1 CP(RT t2SOAAV |V). Violations of
Miller’s inequality signify that probability summation cannot account for decreased RTs in response to redundant signals and implies that neural coactivation has occurred. The evidence that neural coactiva
-tion is a causal mechanism for the AV RSE comes from numerous behavioral and electrophysiological studies (Giard & Peronnet, 1999; Miller, 1982, 1986; Molholm et al., 2002, 2006; see, however, Otto & Mamassian, 2012, for a challenge to this standard interpretation).
1.3 The “rules” of multisensory integration: Spatial, temporal, and intensive
Unisensory stimuli that are closely aligned in space (the “spatial rule”) and time (the “temporal rule”) are more likely to produce multisensory response facilitation than are stimuli that are temporally and/ or spatially disparate, where the latter may even result in response suppression (Holmes & Spence, 2005; Meredith & Allman, 2009; Meredith & Stein, 1986; Meredith, Nemitz, & Stein, 1987). Response facilitation may be especially robust for weak (i.e. near threshold) unisensory stimuli (the “inverse effectiveness rule”). Inverse effectiveness is most conspicuous in the responses of multisensory neu
-rons in the superior colliculus (Meredith & Stein, 1986).
1.3.1 The inverse effectiveness rule
Results from both behavioral and electrophysiological studies have been interpreted to support the inverse effectiveness rule (Callan, Callan, Kroos, & Vatikiotis-Bateson, 2001; Diederich & Colonius, 2004; Frassinetti, Bolognini, & Làdavas, 2002; Lakatos, Chen, O’Connell, Mills, & Schroeder, 2007;
Serino, Farnè, Rinaldesi, Haggard, & Làdavas, 2007; Senkowski, Saint-Amour, Höle, & Foxe, 2011). The generality of the inverse effectiveness rule has recently been questioned on the grounds that pre
1.3.2 The temporal rule: Physiological simultaneity
Stimuli are intrinsically processed at different rates by different sensory modalities. For example, human auditory evoked cortical potentials onset as early as 10 ms (Celesia & Puletti, 1971) whereas the C1 component of the visual evoked potential, which relects activity in early retinotopically mapped visual areas (V1/V2), onsets much later at 45–60 ms (Clark & Hillyard, 1996; Foxe & Simpson, 2002;
Foxe et al., 2008; Jeffreys & Axford, 1972; Murray et al., 2001). In addition to processing speed dif
-ferences between sensory channels due to intrinsic factors such as unequal pathway length, dissimilar axonal conduction velocity and/or variations in synaptic complexity, there is the variable inluence of stimulus intensity. Simple RT is inversely related to stimulus intensity, a phenomenon known as Piéron’s law (Jas´kowski, 1985; Mansield, 1973; Piéron, 1952; Prestrude, 1971; Roufs, 1963), and intensity-dependent variations in the latency of neural activity occur in the primate visual system (Barlow, Snodderly, & Swadlow, 1978; Maunsell et al., 1999) and in the auditory system of both cat (Eggermont, 1998; Phillips, 1998) and human (Stuflebeam, Poeppel, Rowley, & Roberts, 1998).
There is general agreement that multisensory facilitation requires that the neural activity evoked by unisensory stimuli converge synchronously onto multisensory coincidence detectors—that is, that the unisensory inputs must exhibit physiological simultaneity (Hershenson, 1962; Miller, 1986; Raab, 1962). A direct example is that multisensory neurons in the cat’s superior colliculus exhibit optimal multisensory integration when the activity elicited by unisensory stimulation occurs at roughly the same post-stimulus latency (Stein & Meredith, 1993). Likewise, human behavioral data indirectly sug
-gest that multisensory facilitation of simple RT occurs at stimulus onset asynchronies (SOAs) corre
-sponding to the difference in simple RT to the unisensory stimuli, where this RT difference is presumed to relect the difference in intrinsic processing speed (Diederich & Colonius, 2004; Hershenson, 1962;
Miller, 1986). If optimal multisensory facilitation requires the synchronous convergence of unisensory signals onto a multisensory coincidence detector, and if the post-stimulus latency of evoked activity depends on stimulus intensity, then changes in the relative intensities of the component unisensory visual and auditory stimuli should cause systematic changes in the SOAAV at which optimal multisen
-sory facilitation (neural coactivation) occurs.
1.4 The present experiment
We measure how the optimal SOAAV for multisensory integration (as indexed by violations of the race
model) depends on both absolute and relative unisensory stimulus intensities. An evaluation of the dependence of optimal SOAAV on absolute stimulus intensity addresses the validity and generality of
the inverse effectiveness rule, while its dependence on relative stimulus intensity tests the predictions
of the strong version of the physiological simultaneity hypothesis.
2 Condition 1
Condition 1 measured the range of SOAAV over which neural coactivation occurs for two relatively
weak unisensory stimuli.
2.1 Method
2.1.1 Participants
Participants (n5 4; two male; mean age 5 31 years) possessed normal (or corrected to normal) vision
and normal hearing. All experiments were conducted in accordance with the Code of Ethics of the World Medical Association (Declaration of Helsinki) for experiments involving humans. Prior to their participation in the study, all participants provided written informed consent. All procedures were approved by the institutional review board of North Dakota State University.
2.1.2 Stimuli and apparatus
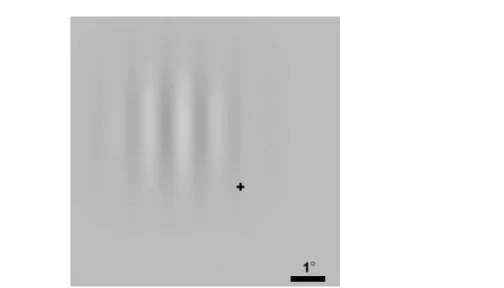
Visual stimuli were circular Gabor patches which, when viewed from 114 cm, possessed a spatial frequency of 1 cycles/degree and a Gaussian envelope with a standard deviation of 1°. Gabor patches were centered at 2.25° eccentricity from ixation in the upper left visual quadrant (Figure 1). Stimuli were presented on a CRT (mean luminance 5 60 cd/m2; monitor refresh rate 5 100 Hz). Gabor
The auditory stimulus was a 1-KHz pure tone of variable loudness (range 5 31.1–49.0 dBA) pre
-sented via a speaker approximately co-located with the visual stimuli. Auditory stimulus duration was 100 ms.
2.1.3 Procedure
2.1.3.1 Pretest. Prior to the experiment, all participants completed a pretest designed to equate the detectability of the unisensory stimuli. The pretest paradigm was a single-interval go/no-go signal detection task. Participants responded via button press as quickly and accurately as possible to the detection of any A or V stimulus. Participants performed 15 blocks of trials for a total of 30 trials per stimulus condition. Each block consisted of a total of 50 trials: 24 unisensory A stimuli (2 12 levels of dB attenuation), 24 unisensory V stimuli (2 12 contrasts), and 2 catch (no-signal) trials.
Sensitivity (d) was calculated according to the equation d5 ZH 2ZFA, where ZH denotes the Z-transformed hit rate (hits/signal trials) and ZFA denotes the Z-transformed false-alarm rate (false
alarms/no-signal trials). Nonlinear least-squares regression to a logistic function interpolated stimulus intensities yielding criterion performance (d≈ 2).
2.1.3.2 Experiment. A single-interval go/no-go signal detection task was employed. Trials commenced with the appearance of a ixation cross. After a variable interval (1,000–2,000 ms), the irst stimulus (S1) was presented. The second stimulus (S2) was presented following a variable SOA. Participants responded via button press as quickly and accurately as possible to the detection of any stimulus. RT was recorded to the nearest millisecond. Trials terminated after subject response or after 1,500 ms. Figure 2 illustrates the sequence of events in multisensory trials.
Participants completed a total of 34 blocks of 75 trials each, for a grand total of 2,550 trials. Each block included 9 V trials, 9 A trials, 9 no-stimulus catch trials, and 3 AV trials at each of 16 SOAs ranging (in 20-ms increments) from 2100 ms (A→V) to 200 ms (V→A). Each subject’s RT distribu
-tion was trimmed to exclude outliers (e.g., 100 ms RT 1,000 ms). The trimmed RT distribu-tions possessed nearly equal numbers of trials contributed by each subject and subsequent analyses in all experimental conditions were conducted on RT distributions pooled across participants.
The intensities of the unisensory stimuli were adjusted (as necessary) after every 18 trials to ensure a mean sensitivity of d≈ 2, which corresponds to an 87% correct response rate in a two-alternative forced-choice task, where 75% correct is typically taken as threshold performance. Thus, stimuli in con
-dition 1 were suficiently strong that participants could reliably detect them, while suficiently weak that performance in this condition could be meaningfully contrasted to that observed in subsequent experi
-mental conditions where stimuli were highly suprathreshold (d 4; 99.9% correct response rate). Figure 1. Visual stimuli were circular Gabor patches (1%–4% contrast) which possessed a spatial frequency of
1 cycle/degree and a Gaussian envelope with a standard deviation of 1°. Gabor patches were centered at 2.25°
2.1.4 Data analysis
2.1.4.1 Multisensory response facilitation/inhibition. To test whether RTs to multisensory stimuli were signiicantly faster (or slower) than RTs to unisensory stimuli, mean RT in all 16 SOAAV conditions
was compared with the fastest (and slowest) mean unisensory RTs (A or V) using independent samples
t-tests.
2.1.4.2 Multisensory sensitivity enhancement. Mean sensitivity (d) at each SOAAV was
calculated using a bootstrapping procedure (Foster & Bischof, 1991). Response distributions for each SOAAV condition (hits) were combined with an equal size sample taken at random from the no-signal
condition (false alarms). The distribution of hits and false alarms was exhaustively sampled (with replacement, 1,000 iterations) to generate sampling distributions of d from which means and standard
errors were obtained.
2.1.4.3 Neural coactivation (Miller’s inequality analysis). RT data were trimmed (100 ms RT 1,000 ms) and cumulative distribution functions (CDFs) were created for each stimulus condition (A, V, AV). Sampling distributions were bootstrapped by exhaustively resampling each CDF (with replacement, 1,000 iterations). A sampling distribution of Miller’s inequality values was generated by subtracting the multisensory CDF predicted by probability summation, AVP5 (A 1 V), from the
CDF observed for each multisensory condition at each iteration such that MIf5 AV 2 AVP,where MIf
indicates facilitative MI. This process yielded a mean value (and standard error) of Miller’s inequality for each SOAAV. Figures 8(c) and (d), condition 4, provide a graphic illustration of CDF comparisons
between unisensory and simultaneous multisensory conditions.
2.2 Results and discussion
2.2.1 Multisensory response facilitation/ inhibition
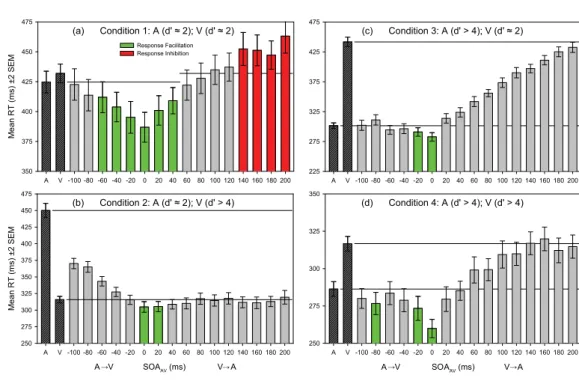
Mean RTs for condition 1 are plotted as a function of SOAAV in Figure 3(a). While possessing equally
detectable stimulus intensities (d≈ 2), mean RT to the unisensory A stimulus was nevertheless faster
(424.6 ms) than to the unisensory V stimulus (431.9 ms). This difference in RT did not reach sig
-niicance (t1831521.206, p5 0.228) and likely relects the shorter latency of auditory versus visual
cortical responses (Celesia & Puletti, 1971; Jeffreys & Axford, 1972). To assess whether multisensory stimulation produced response facilitation, mean RT in each AV condition was compared with that in the fastest unisensory condition (A). Green bars identify those AV SOAs where results of independ
-ent samples t-tests indicated that signiicant multisensory response enhancement occurred. Signiicant
response facilitation occurred at SOAAV values of 260, 240, 220, 0, 20, and 40 ms (t1303522.891,
p5 0.004; t1303522.944, p5 0.003; t1295523.560, p 0.001; t1288524.620, p 0.001; t13035
22.933, p5 0.003; and t1290 521.957, p5 0.051; respectively). To assess whether multisensory
stimulation might produce response inhibition, mean RT in AV conditions was compared with that in the slowest unisensory condition (V). Red bars indicate that signiicant response inhibition occurred at
Figure 2. Multisensory trials commenced with the appearance of a ixation cross. After a variable interval
(1,000–2,000 ms) the irst stimulus (S1) was presented. The second stimulus (S2) was presented following a variable SOA. Participants responded via button press as quickly and accurately as possible to the detection of any stimulus. Response time (RT) was recorded to the nearest millisecond. Trials terminated after subject response or after 1,500 ms.
Start trial (N) S1 (A or V) S2 (A or V) Response
Timeout (1,500 ms) RT (ms)
SOAAV
Start trial (N + 1) 1000–2000 ms
SOAAV of 140, 160, 180, and 200 ms (t12935 2.712, p5 0.007; t12985 2.626, p5 0.009; t12955 2.141,
p5 0.032; and t12985 4.100, p 0.001; respectively).
2.2.2 Multisensory sensitivity enhancement
If sensitivities to the unisensory A and V stimuli combine probabilistically then the sensitivity in multisensory (AV) conditions (dAVp) should equal the quadratic sum of the unisensory sensitivities
(Campbell & Green, 1965; Legge, 1984):
d'AVp5
√
(d'Ao)21 (d'Vo)2. (3)Figure 4 plots the mean bootstrapped values of observed sensitivity (dAVo, 2 and 3 SEM) in all 16
multisensory conditions as a function of SOAAV. The average observed unisensory sensitivities were dAo5 1.911, and dVo5 1.910, and the multisensory sensitivity predicted by probability summation (dAVp5 2.699) is plotted as a horizontal line. Although there is a signiicant multisensory facilitation
of mean RT, sensitivity to multisensory stimuli does not differ signiicantly (p 0.01) from that pre
-dicted by probability summation at any SOAAV.
2.2.3 Neural coactivation (Miller’s inequality analysis)
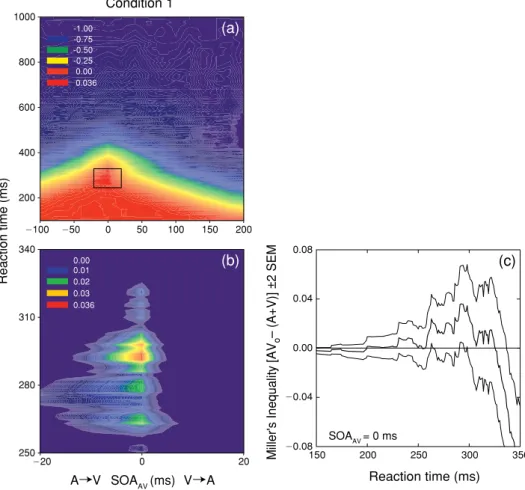
Figure 5(a) spectrum codes the value of Miller’s inequality as a function of RT and SOAAV. Figure 5(b)
is a magniied view of the region exhibiting signiicant (p 0.05) violations of the race model (posi
-tive values). Noteworthy is that posi-tive values of the inequality occur exclusively at an SOAAV value
of 0 ms (physical simultaneity), across a range of RT (200–325 ms) with a peak value (0.0360) occur
-ring at 292 ms (Figure 5c).
3 Condition 2
Condition 2 was designed to reveal how changing the intensity of the V stimulus might inluence its integration with the relatively weak A stimulus. Speciically, we tested whether increasing the con
-trast of the V stimulus caused a change in the optimal SOAAV for multisensory integration relative to
condition 1. If physiological simultaneity determines multisensory facilitation, then increasing the
(d) Condition 4: A (d' > 4); V (d' > 4)
A V -100 -80 -60 -40 -20 0 20 40 60 80 100 120 140 160 180 200 250
275 300 325 350
→ → A→V SOAAV (ms) V A→
(a) Condition 1: A (d' ≈ 2); V (d' ≈ 2)
A V -100 -80 -60 -40 -20 0 20 40 60 80 100 120 140 160 180 200
Me
an RT (ms) ±2 SEM
350 375 400 425 450 475
Response Facilitation Response Inhibition
A V SOAAV (ms) V A
A V -100 -80 -60 -40 -20 0 20 40 60 80 100 120 140 160 180 200
Me
an RT (ms) ±2 SEM
250 275 300 325 350 375 400 425 450 475
(b) Condition 2: A (d' ≈ 2); V (d' > 4)
(c) Condition 3: A (d' > 4); V (d' ≈ 2)
A V -100 -80 -60 -40 -20 0 20 40 60 80 100 120 140 160 180 200 225
275 325 375 425 475
Figure 3. Mean RTs in the four experimental conditions plotted as a function of SOAAV. Mean RT in each AV
condition was compared with that in the fastest unisensory condition (A or V). Green bars identify those AV
SOAs where results of independent samples t-tests indicated that signiicant multisensory response enhancement
occurred. Mean RT in each AV condition was also compared with that in the slowest unisensory condition (A or
Figure 4. Mean bootstrapped values of observed sensitivity (dAVo, 2 and 3 SEM) in all 16 multisensory
conditions as a function of SOAAV. The average observed unisensory sensitivities were dAo 5 1.911 and
dVo5 1.910, and the multisensory sensitivity predicted by probability summation (dAVp5 2.699) is plotted as a
horizontal line. Although there is a signiicant multisensory facilitation of mean RT, sensitivity to multisensory
stimuli does not differ signiicantly (p 0.01) from that predicted by probability summation at any SOAAV.
10080604020 0 20 40 60 80 100 120 140 160 180 200 d'AV
o
(±2 and 3 SEM
)
A→V SOAAV (ms) V A→ 2.9
2.8
2.7
2.6
2.5
2.4
2.3
Condition 1
100 50 0 50 100 150 200
Reaction time (ms
)
200 400 600 800 1000
-1.00 -0.75 -0.50 -0.25 0.00 0.12
20 0 20
250 280 310 340
0.000 0.004 0.008 0.010 0.011 0.012
Reaction time (ms)
150 200 250 300 350
M
iller's Inequalit
y
[A
Vo
– (A+V)] ±2 SEM
0.08 0.04 0.04 0.08
A V SOAAV (ms) V A
-1.00 -0.75 -0.50 -0.25 0.00 0.036
0.00 0.01 0.02 0.03 0.036
0.00
(a)
(b) (c)
SOAAV = 0 ms
Figure 5. Test of the race model for condition 1. Panel (a) shows spectrum-coded mean values of Miller’s inequality
as a function of RT and SOAAV. Panel (b) shows a magniied view of the region exhibiting a signiicant (p 0.05)
violation of the race model that occurred exclusively at an SOAAV of 0 ms. Panel (c) plots the mean value (thick
intensity of the V stimulus (which increases the speed of visual processing and reduces mean RT to V stimuli) should shift the optimal SOAAV to more negative values such that, relative to condition 1, the
A stimulus will now need to be presented earlier in time with respect to the V stimulus. Conversely, the optimal SOAAV will remain unchanged if physical simultaneity is critical for multisensory integration.
3.1 Method
The participants in condition 2 were the same as in condition 1. The experimental methods and pro
-cedures were as in condition 1 except that V stimulus contrast was increased to levels producing a criterion sensitivity of d 4 for each participant (contrast range 5 3.4%–4.0%). To ensure this cri
-terion sensitivity, d was calculated for unisensory A and V stimuli after every 18 trials throughout the
experiment and V stimulus contrast and A stimulus intensity were adjusted as necessary.
3.2 Results and discussion
3.2.1 Multisensory response facilitation/ inhibition
Mean RTs in condition 2 are plotted as a function of SOAAV in Figure 3(b). As expected, mean RT
to the unisensory V stimulus was now signiicantly faster (315.8 ms) than to the unisensory A stimu
-lus (450.0 ms) (t19845 225.158, p 0.001). This highly signiicant reversal in the relative speed
of responses to A and V stimuli relects the approximately threefold increase in V stimulus contrast relative to condition 1, and is an illustration of Piéron’s law. To assess whether multisensory stimula
-tion produced response facilita-tion, mean RT in AV condi-tions was compared with that in the fastest unisensory condition (V). The green bars indicate that signiicant response facilitation occurred at SOAAV values of 0 and 20 ms (t1597522.272, p5 0.023 and t1597522.160, p5 0.031, respectively).
There was no multisensory response inhibition at any SOAAV.
3.2.2 Neural coactivation (Miller’s inequality analysis)
Figure 6(a) spectrum codes the values of Miller’s inequality as a function of RT and SOAAV for condi
-tion 2. A magniied view of the region exhibiting signiicant (p 0.05) violations of the race model is
shown in Figure 6(b). As in condition 1, signiicant violations of Miller’s inequality occurred for phys
-ically simultaneous A and V stimuli, as well as at an SOAAV of 20 ms. At an SOAAV of 0 ms (Figure 6c),
violations occurred for physically simultaneous stimuli across a range of RT (217–290 ms), with a peak at 244 ms. The fact that the greatest violations of Miller’s inequality occur when unisensory stimuli are physically simultaneous is clearly incompatible with the strong version of the physiologi
-cal simultaneity hypothesis, which posits that neural coactivation should occur at an SOA that closely corresponds to the difference in mean RT to the unisensory stimuli. The results of condition 2 also clearly show that neural coactivation can occur when a more rapidly processed stimulus (V) precedes a more slowly processed stimulus (A). The results of condition 2 are also inconsistent with the inverse effectiveness rule, because increasing the intensity of the V stimulus actually increased the magnitude of the violation of Miller’s inequality (0.0360 vs. 0.0530 in conditions 1 and 2, respectively).
4 Condition 3
Condition 3 is complimentary to condition 2 and was designed to reveal how changing the intensity of the A stimulus might inluence its integration with a relatively weak V stimulus. Speciically, we tested whether increasing the intensity (loudness) of the A stimulus caused a change in the optimal SOAAV for
multisensory integration relative to condition 1. Again, if physiological simultaneity is necessary for multisensory facilitation, then increasing the intensity of the A stimulus (which will increase the speed of auditory processing and reduce mean RT to A stimuli) should shift the optimal SOAAV for neural
coactivation to more positive values such that, relative to condition 1, the V stimulus would need to be presented earlier with respect to the A stimulus. Conversely, the optimal SOAAV will not change if
physical simultaneity determines multisensory integration.
4.1 Method
The participants in condition 3 were the same as in conditions 1 and 2. The experimental methods and procedures were as in condition 1, except that A stimulus intensity was increased to levels producing a criterion sensitivity d 4 (intensity range 5 44.5–49.0 dBA). In order to ensure criterion sensitivity, d was calculated for unisensory A and V stimuli after every 18 trials throughout the experiment and V
4.2 Results and discussion
4.2.1 Multisensory response facilitation/ inhibition
Mean RTs in condition 3 are plotted as a function of SOAAV in Figure 3(c). As expected, mean RT to
the unisensory A stimulus (301.5 ms) was signiicantly faster than that to the unisensory V stimulus (441.7 ms) (t1978 5 232.247, p 0.001). The signiicantly faster mean response to the intense A
stimulus in condition 3, relative to conditions 1 and 2, is another illustration of Piéron’s law. To assess whether multisensory stimulation produced response facilitation, mean RT in AV conditions was com
-pared with that in the fastest unisensory condition (A). Green bars indicate that signiicant response facilitation occurred at SOAAV values of 220 and 0 ms (t1619522.340, p5 0.019; t1616524.145,
p 0.001, respectively). There was no multisensory response inhibition at any SOAAV.
4.2.2 Neural coactivation (Miller’s inequality analysis)
Figure 7(a) spectrum codes the values of Miller’s inequality as a function of RT and SOAAV for condi
-tion 3. A magniied view of the region exhibiting signiicant viola-tions of the race model is shown in
Figure 7(b). At an SOAAV of 0 ms (Figure 7c), positive values of Miller’s inequality occur across a
range of RT (192–330 ms), with a peak at 288 ms. As in conditions 1 and 2, signiicant violations of Miller’s inequality occurred for physically simultaneous A and V stimuli, as well as at an SOAAV of
220 and 240 ms. Once again, the fact that violations of Miller’s inequality have the greatest mag
-nitude when unisensory stimuli are physically simultaneous is clearly incompatible with the strong version of the physiological simultaneity hypothesis, and the results of condition 3 conirm that neu
-ral coactivation can occur when a more rapidly processed stimulus (A) precedes the more slowly Figure 6. Test of the race model for condition 2. Panel (a) shows spectrum-coded mean values of Miller’s inequality
as a function of RT and SOAAV. Panel (b) shows a magniied view of the region exhibiting signiicant (p 0.05)
violations of the race model that occurred at SOAAV values of 0 and 20 ms. Panel (c) plots the mean value (thick
line) and 95% conidence intervals (thin lines) for Miller’s inequality as a function of RT for simultaneous SOAAV.
Condition 2
100 50 0 50 100 150 200
200 400 600 800 1000
-1.00 -0.75 -0.50 -0.25 -0.15 0.008
20 0 40
220 240 270 300
0.000 0.002 0.004 0.006 0.007
150 200 250 300 350
0.10 0.05 0.05 0.10
0.008
Reaction time (ms
)
Reaction time (ms)
Mi
ller's Inequalit
y
[A
Vo
– (A+V)] ±2 SEM
A V SOAAV (ms) V A
-1.00 -0.75 -0.50 -0.25 0.00 0.053
0.00 0.02 0.03 0.04 0.05 0.053
20
0.00
(a)
(b) (c)
processed stimulus (V). The results of condition 3 are also inconsistent with the inverse effectiveness rule, because increasing the intensity of the A stimulus signiicantly increased the magnitude of the
violation of Miller’s inequality (0.0360 vs. 0.1113 in conditions 1 and 3, respectively).
5 Condition 4
Finally, condition 4 tested whether increasing the intensities of both A and V stimuli to clearly suprath
-reshold levels (d 4) would result in a pattern of optimal SOAAV for multisensory integration that
resembled that of condition 1.
5.1 Method
The participants in condition 4 were the same as in condition 1. The experimental paradigm replicated condition 1 with the following exception. Both V and A stimuli were increased in intensity to levels producing criterion sensitivities of d 4.
5.2 Results and discussion
5.2.1 Multisensory response facilitation/ inhibition
Mean RTs in condition 4 are plotted as a function of SOAAV in Figure 3(d). As in condition 1, mean
RT to the unisensory A stimulus was signiicantly faster (286.3 ms) than that to the unisensory V stimulus (316.7 ms) (t2402528.74, p 0.01). The signiicantly faster mean responses to the highly
suprathreshold A and V stimuli in condition 4, relative to condition 1 (t21215228.338, p 0.01 and
t21125226.030, p 0.01, respectively), again illustrate Piéron’s law. To assess whether multisensory
stimulation produced response facilitation, mean RT in AV conditions was compared with that in the Figure 7. Test of the race model for condition 3. Panel (a) shows spectrum-coded mean values of Miller’s
inequality as a function of RT and SOAAV. Panel (b) shows a magniied view of the region exhibiting signiicant
(p 0.05) violations of the race model, which occurred at SOAAV values of 240, 220, and 0 ms. Panel (c) plots
the mean value (thick line) and 95% conidence intervals (thin lines) for Miller’s inequality as a function of RT
for simultaneous SOAAV.
150 200 250 300 350
0.20 0.10 0.00 0.20
80 60 40 20 0 20
175 225 275 325
0.00 0.01 0.02 0.03 0.04
Condition 3
100 50 0 50 100 150 200 200
400 600 800 1000
-1.00 -0.75 -0.50 -0.25 0.00 0.04
Reaction time (ms)
Reaction time (ms)
M
iller's Inequalit
y
[A
Vo
– (A+V)] ±2 SEM
A V SOAAV (ms) V A
0.10
0.000 0.025 0.050 0.075 0.100 0.110 -1.00 -0.75 -0.50 -0.25 0.05 0.11
(a)
(b) SOA (c)
fastest unisensory condition (A). The green bars indicate that signiicant response facilitation occurred at SOAAV values of 280, 220, and 0 ms (t1613522.03, p5 0.043; t1613522.67, p5 0.008; and
t1610525.72, p 0.001, respectively). There was no multisensory response inhibition at any SOAAV.
5.2.2 Neural coactivation (Miller’s inequality analysis)
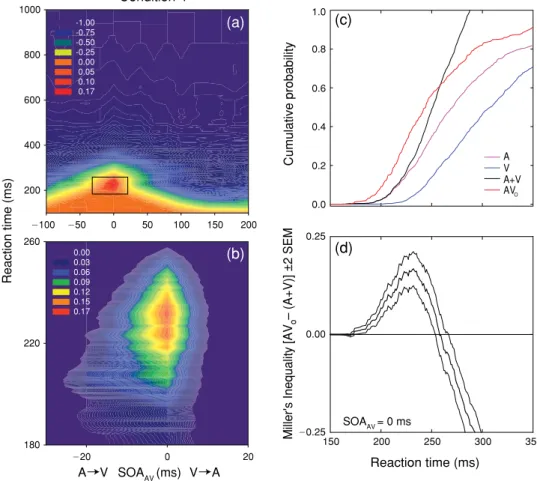
Figure 8(a) spectrum codes the values of Miller’s inequality as a function of RT and SOAAV for condi
-tion 4. A magniied view of the region exhibiting signiicant viola-tions of the race model is shown in
Figure 8(b). As in condition 3, positive values of Miller’s inequality occurred for SOAAV220 and 0
ms, a result that is incompatible with the strong version of the physiological simultaneity hypothesis. At an SOAAV of 0 ms, positive values of Miller’s inequality occur across a range of RT (171–257 ms),
with a peak at 232 ms. The results of condition 4 are directly contradictory to the inverse effectiveness rule, because increasing the intensity of both unisensory stimuli signiicantly increased the magnitude
of the violation of Miller’s inequality (0.0360 vs. 0.1678 in conditions 1 and 4, respectively).
Figures 8(c) and (d) illustrate how the RT data were analyzed in order to compute values of Miller’s inequality and establish conidence intervals. CP distributions as a function of RT were con
-structed for the A (purple) and V (blue) unisensory stimulus conditions, and for their multisensory combination, AVo, at all values of SOAAV (SOAAV5 0 ms is shown in red). The sum of the CP distribu
-tions for the unisensory condi-tions (A 1 V) is the CP predicted by the race model (black). The value of Miller’s inequality is computed at each value of RT by subtraction: CP(AVo) 2 CP(A 1 V). When
the CP of observed RT exceeds that predicted by the race model, the value of Miller’s inequality is
Figure 8. Test of the race model for condition 4. Panel (a) shows spectrum-coded mean values of Miller’s
inequality as a function of RT and SOAAV. Panel (b) shows a magniied view of the region exhibiting signiicant
(p 0.05) violations of the race model, which occurred at SOAAV values of −20 and 0 ms. Panel (c) plots the
mean value (thick line) and 95% conidence intervals (thin lines) for Miller’s inequality as a function of RT
for simultaneous SOAAV. Panel (c) shows the CP distributions for the two unisensory conditions (A: purple; V:
blue) and their sum (A + V: black), which is the CP distribution predicted by the race model. The CP distribution
observed for AV stimulation at an SOAAV of 0 ms (AVo) is shown in red. Panel (d) plots the mean value (thick
line) and 95% conidence intervals (thin lines) for Miller’s inequality as a function of RT for simultaneous SOAAV.
20 0 20
180 220 260
0.00 0.03 0.06 0.09 0.12 0.15 0.17
Condition 4
100 50 0 50 100 150 200 200
400 600 800 1000
-1.00 -0.75 -0.50 -0.25 0.00 0.05 0.10 0.17
(c)
150 200 250 300 350
0.25 0.00 0.25
Reaction time (ms)
Reaction time (ms)
Mi
ller's Inequalit
y
[A
Vo
– (A+V)] ±2 SEM
(a)
(b) (d)
A V SOAAV (ms) V A
A V A+V AVO (c)
Cumulative probability
0.0 0.2 0.4 0.6 0.8 1.0
positive. These violations are represented by the segment of the AVo CP distribution that lies above
the (A 1 V) CP distribution in Figure 8(c). Miller’s inequality is plotted (thick line) as a function of RT (from 150 to 350 ms) in Figure 8(d). Conidence intervals were derived by a bootstrapping proce
-dure (Foster & Bischof, 1991) where the AVo and A 1 V CP distributions were sampled exhaustively
with replacement to generate a sampling distribution of Miller’s inequality (N5 1,000). Thin lines in Figures 5–7(c) and 8(d) plot 95% conidence intervals for the value of Miller’s inequality.
6 General discussion
Taken together, the results of the four experimental conditions reveal that audiovisual multisensory facilitation, as indexed by signiicant violations of the race model, occurs only over a narrow range of stimulus onset asynchronies which invariably includes physical simultaneity. Manipulations of stimu
-lus intensity that changed the speed of unisensory processing, as revealed by signiicant alterations of mean RT, had no inluence on the range of SOAAV over which multisensory interaction occurred.
Moreover, when the range of SOAAV over which signiicant violations of the race model occurred did
extend beyond physical simultaneity (condition 2: 20 ms; condition 3: 220 and 240 ms; condition 4: 220 ms), the extension was such that the more rapidly processed stimulus needed to precede the more
slowly processed stimulus, a result that is, in fact, opposite to the strong version of the physiological simultaneity hypothesis (Hershenson, 1962), which predicts that the more slowly processed stimulus
should need a “head start” in order to arrive at some central site simultaneously with a more rapidly processed stimulus. It should be noted that violations of Miller’s inequality at all non-zero SOAs were smaller than those at simultaneity. Finally, there was a surprising lack of evidence for multisensory facilitation with respect to sensitivity (d).
6.1 Inverse effectiveness
Although the rule of inverse effectiveness has sometimes been upheld as a universally observed char
-acteristic of multisensory integration (Lakatos et al., 2007; Meredith & Stein, 1986), a number of studies have reported indings that are inconsistent with this rule (Lakatos et al., 2007; Ross et al., 2007). Our results likewise do not support the inverse effectiveness rule because the magnitude of the violations of Miller’s inequality we observed generally increased with increasing stimulus intensity (at SOAAV5 0 ms: 0.0360, 0.0530, 0.1113, and 0.1678 in conditions 1–4, respectively). Our results
are, however, consistent with a reinterpretation (Holmes, 2007) of the results of Alvarado, Vaughan, Stanford, and Stein (2007), who showed that whereas multisensory enhancement in neurons in the cat’s superior colliculus obeyed the rule of inverse effectiveness when analyzed in terms of relative
spike rate increase, they demonstrated the behavior we observe, viz., increasing effectiveness with increasing stimulus intensity, when analyzed in terms of absolute spike rates. On the contrary, the
range of SOAAV over which statistically signiicant decreases in simple mean RT occur is wider for the
weakest stimuli (condition 1) than for the other conditions (Figure 3), but increases in the time window of integration is not what is typically meant by inverse effectiveness.
6.2 Intensity-adjusted latency coding
Although physiological activity resulting from two unisensory signals must simultaneously converge on a multisensory “coincidence detector” for facilitative MI to occur, we ind that such facilitation occurs nearly exclusively for physically simultaneous multisensory occurrences, independent of fac
-tors that differentially affect unisensory processing time, such as stimulus intensity. This makes sense from an ecological perspective, for if multisensory facilitation has aided survival, the advantage it confers must be the enhanced processing of genuine physical events (e.g., the sights and sounds of predators or prey which, because they have a common cause, are physically simultaneous), not merely to physiological simultaneities some (potentially large) fraction of which are accidental. Although the evolutionary advantage of this result is undeniable, the mechanism whereby it is accomplished is unclear.
facilitation. This suggests that the time of arrival at multisensory sites must be corrected for latency differences caused by adventitious variations in stimulus intensity. In other words, the system must “take account” of differences in physiological response latency that are unrelated to true unisensory SOA in order to reject false correspondences. It is well known that neural networks can undergo Heb
-bian learning, wherein the strength of synaptic connections is modiied based on experience. The bio
-physical bases of temporal coincidence detection could involve mechanisms of spike-time dependent synaptic plasticity (Song, Miller, & Abbott, 2000) and/or synaptic scaling (Turrigiano, Leslie, Desai, Rutherford, & Nelson, 1998). Our novel idea that synapses might additionally be “tuned” to particular stimulus intensities is purely speculative. In short, however, physiological response simultaneity is a necessary but not suficient condition for facilitative MI.
One possible mechanism for achieving this outcome is shown in Figure 9. Assume a neural net
-work of AV coincidence detectors (labeled 1–5 in Figure 9) which integrate unisensory inputs (i.e., ire) exclusively when A and V inputs arrive synchronously, thus relecting the necessary condition of physiological simultaneity. The coincidence detectors receive input from both A and V sensory recep
-tors via delay lines and are thus place coded (Jeffress, 1948). A given afferent A or V signal ultimately supplies input to the entire network of coincidence detectors at a continuum of latencies. In Jeffress’
(1948) theory of binaural sound localization, differences in the time of arrival of sound at the two
ears (the interaural time difference) result in physiological convergence that varies in location within the network of coincidence detectors such that the spatial location of the sound source is read out by the relative spatial location of the activated coincidence detector. This explanation can be adapted to explain our results.
We begin by assuming that organisms have ubiquitous access to the physiological activity gener
-ated by genuinely simultaneous multisensory events in their environment, that is, that they have access
to ground truth. Thus, over the course of their development organisms will accrue robust Bayesian priors with respect to multisensory convergence. The class of multisensory stimulation for which exact latency/intensity information is known results from self-generated events. For example, tapping an object with the hand (or a tool), or throwing a projectile whose impact with a nearby surface produces both visual and auditory consequences, etc., produces afferent visual, auditory, and haptic/kinesthetic signals of known common origin. Because these signals routinely vary in intensity, the latencies at
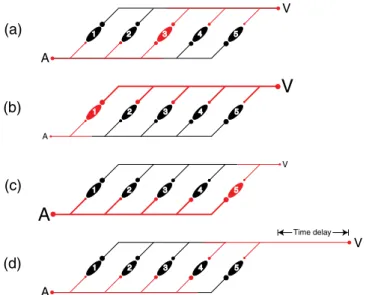
Figure 9. An illustration of how learned associations (Bayesian priors) between physical simultaneity and relative
stimulus intensity might be represented in a place-coded delay line network of coincidence detectors. Panels (a–c) refer to situations where physically simultaneous A and V events vary in relative intensity. In panel (a), the A and V inputs are of nominally equivalent relative intensity (denoted by the similar size of the delay lines, lettering, and the circular input and synaptic symbols), and the afferent signals (coded red) converge synchronously on and activate coincidence detector 3 (red). In panels (b) and (c), simultaneous A and V events vary in intensity. The more intense stimulus (thick line) propagates through the network more rapidly than the less intense stimulus (thin line), and their signals thus converge on coincidence detectors 1 or 5. Panel (d) illustrates two inputs of nominal equivalent intensity where the visual stimulus is delayed in time of onset relative to the auditory stimulus (represented here as added pathway length).
A
V
A
V A
V
A
V
(a)
(b)
(c)
(d)
Time delay
1 2 3 4 5
1 2 3 4 5
1 2 3 4 5
which these signals converge at multisensory coincidence detectors can, over repeated stimulation, result in the accumulation of intensity-adjusted probability distributions that form the basis for com
-puting the posterior probability that any set of incoming multisensory signals have a common origin. One way in which the Bayesian priors could be instantiated in a delay-line network is illustrated
in Figure 9.
Figures 9(a–c) refer to situations where physically simultaneous A and V events vary in relative intensity. In Figure 9(a), the A and V inputs are of nominally equivalent relative intensity (denoted by the similar size of the delay lines, lettering, and the circular input and synaptic symbols), and the afferent signals (coded red) converge synchronously on and activate coincidence detector 3 (red). No other coincidence detector receives simultaneous input. Figures 9(b) and (c) describe situations where simultaneous A and V events vary in intensity. The more intense stimuli (thick lines) propagate through the network more rapidly than the less intense stimuli (thin lines), and their signals thus converge on coincidence detector 1 or 5. Because we are assuming that in each case the physical origin of the afferent signals is known to have been common, physical stimulus synchrony can be disambiguated and correctly read out by the network only if the coincidence detectors are trained (learn) to ire when the constituent inputs possess the appropriate relative intensities. Thus, in Figure 9(d), two inputs of nominal equivalent intensity are illustrated where the visual stimulus is delayed in time of onset rela
-tive to the auditory stimulus (represented here as added pathway length). Being of nominal equivalent intensity, the two signals propagate through the network at similar speeds and converge on coincidence detector 4. However, because this coincidence detector has “learned” that physically simultaneous A and V events only converge at its location when they possess unequal intensities (intensity tuning is indicated by the sizes of the circular synaptic contacts), it rejects this physiological simultaneity as spurious and does not integrate. Animations demonstrating the four conditions of Figure 9 are avail
-able as a supplementary lash ile.
Acknowledgments. This work was supported by grants NIH P20 GM103505 (MEM) and R03 AG022638
(MEM). The National Institute of General Medical Sciences (NIGMS) and the National Institute on Aging (NIA) are components of the National Institutes of Health (NIH). The contents of this report are solely the responsibility of the authors and do not necessarily relect the oficial views of the NIH, NIGMS or NIA. The authors thank Huanzhong (Dan) Gu for assistance with computer programming and data analysis, and Dr. Jeff Miller for his thoughtful critique of an early draft of this manuscript.
References
Alvarado, J. C., Vaughan, J. W., Stanford, T. R., & Stein, B. E. (2007). Multisensory versus unisensory
integration: Contrasting modes in the superior colliculus. Journal of Neurophysiology, 97, 3193–3205.
doi:10.1152/jn.00018.2007
Barlow, R. B., Snodderly, D. M., & Swadlow, H. A. (1978). Intensity coding in primate visual system. Experimental Brain Research, 31, 163–177. doi:10.1007/BF00237597
Callan, D. E., Callan, A. M., Kroos, C., & Vatikiotis-Bateson, E. (2001). Multimodal contribution to speech
perception revealed by independent component analysis: A single sweep EEG case study. Cognitive
Brain Research, 10, 349–353. doi:10.1016/S0926-6410(00)00054-9
Calvert, G. A. (2001). Crossmodal processing in the human brain: Insights from functional neuroimaging
studies. Cerebral Cortex, 11, 1110–1123. doi:10.1093/cercor/11.12.1110
Campbell, F. W., & Green, D. G. (1965). Monocular vs. binocular visual acuity. Nature, 208, 191–192.
doi:10.1038/208191a0
Celesia, G. G., & Puletti, F. (1971). Auditory input to the human cortex during states of drowsiness and surgical
anesthesia. Electroencephalography and Clinical Neurophysiology, 31, 603–609.
doi:10.1016/0013-4694(71)90076-9
Clark, V. P., & Hillyard, S. A. (1996). Spatial selective attention affects early extrastriate but not striate
components of the visual evoked potential. Journal of Cognitive Neuroscience, 8, 387–402.
doi:10.1162/jocn.1996.8.5.387
Diederich, A., & Colonius, H. (2004). Bimodal and trimodal multisensory enhancement: Effects of stimulus
onset and intensity on reaction time. Perception and Psychophysics, 66, 1388–1404.
doi:10.3758/BF03195006
Eggermont, J. J. (1998). Azimuth coding in primary auditory cortex of the cat: Relative latency and interspike
interval representation. Journal of Neurophysiology, 80, 2151–2161.
Foster, D. H., & Bischof, W. F. (1991). Bootstrap estimates of the statistical accuracy of thresholds obtained
Foxe, J. J., & Simpson, G. V. (2002). Flow of activation from V1 to frontal cortex in humans: A
framework for deining “early” visual processing. Experimental Brain Research, 142, 139–150.
doi:10.1007/s00221-001-0906-7
Foxe, J. J., Strugstad, E. C., Sehatpour, P., Molholm, S., Pasieka, W., Schroeder, C. E., & McCourt, M. E. (2008). Parvocellular and magnocellular contributions to the initial generators of the visual evoked
potential: High-density electrical mapping of the “C1” component. Brain Topography, 21, 11–21.
doi:10.1007/s10548-008-0063-4
Frassinetti, F., Bolognini, N., & Ladàvas, E. (2002). Enhancement of visual perception by crossmodal visuo–
auditory interaction. Experimental Brain Research, 147, 332–343. doi:10.1007/s00221-002-1262-y
Giard, M. H., & Peronnet, F. (1999). Auditory–visual integration during multi-modal object recognition in
humans: A behavioral and electrophysiological study. Journal of Cognitive Neuroscience, 11, 473–490.
doi:10.1162/089892999563544
Hershenson, M. (1962). Reaction time as a measure of intersensory facilitation. Journal of Experimental
Psychology, 63, 289–293. doi:10.1037/h0039516
Holmes, N. P. (2007). The law of inverse effectiveness in neurons and behavior: Multisensory integration versus
normal variability. Neuropsychologia, 45, 3340–3345. doi:10.1016/j.neuropsychologia.2007.05.025
Holmes, N. P. (2009). The principle of inverse effectiveness in multisensory integration: Some statistical
considerations. Brain Topography, 21, 168–176. doi:10.1007/s10548-009-0097-2
Holmes, N. P., & Spence, C. (2005). Multisensory integration: Space, time and superadditivity. Current Biology,
15, R762–R764. doi:10.1016/j.cub.2005.08.058
Iacoboni, M., & Zaidel, E. (2003). Interhemispheric visuo-motor integration in humans: The effect of redundant
targets. European Journal of Neuroscience, 17, 1981–1986. doi:10.1046/j.1460-9568.2003.02602.x
Jas´kowski, P. (1985). The effect of visual adaptation on simple motor reaction time: Pt. 1. Studia Psychologica,
27, 191–201.
Jeffress, L. A. (1948). A place theory of sound localization. Journal of Comparative and Physiological
Psychology, 41, 35–39. doi:10.1037/h0061495
Jeffreys, D. A., & Axford, J. G. (1972). Source locations of pattern-speciic components of human visual
evoked potentials. II. Component of extrastriate cortical origin. Experimental Brain Research, 16, 22–40.
doi:10.1007/BF00233372
Lakatos, P., Chen, C. M., O’Connell, M. N., Mills, A., & Schroeder, C. E. (2007). Neuronal
oscillations and multisensory interaction in primary auditory cortex. Neuron, 53, 279–292.
doi:10.1016/j.neuron.2006.12.011
Legge, G. E. (1984). Binocular contrast summation II. Quadratic summation. Vision Research, 24, 385–394.
doi:10.1016/0042-6989(84)90064-6
Mansield, R. J. W. (1973). Latency functions in human vision. Vision Research, 13, 2219–2234.
doi:10.1016/0042-6989(73)90224-1
Maunsell, J. H. R., Ghose, G. M., Assad, J. A., McAdams, C. J., Boudreau, C. E., & Noerager, B. D. (1999).
Visual response latencies of magnocellular and parvocellular LGN neurons in macaque monkeys. Visual
Neuroscience, 16, 1–14.
Meredith, M. A. (2002). On the neuronal basis for multisensory convergence: A brief overview. Cognitive Brain
Research, 14, 1–40. doi:10.1016/S0926-6410(02)00059-9
Meredith, M. A., & Allman, B. (2009). Subthreshold processing in cat auditory cortex. NeuroReport, 20,
126–131. doi:10.1097/WNR.0b013e32831d7bb6
Meredith, M. A., Nemitz, J. W., & Stein, B. E. (1987). Determinants of multisensory integration in superior
colliculus neurons. I. Temporal factors. Journal of Neuroscience, 7, 3215–3229.
Meredith, M. A., & Stein, B. E. (1986). Visual auditory and somatosensory convergence on cells in superior
colliculus results in multisensory integration. Journal of Neuroscience, 56, 640–662.
Miller, J. (1982). Divided attention: Evidence for coactivation with redundant signals. Cognitive Psychology, 14,
247–279. doi:10.1016/0010-0285(82)90010-X
Miller, J. (1986). Timecourse of coactivation in bimodal divided attention. Perception and Psychophysics, 40,
331–343. doi:10.3758/BF03203025
Miniussi, C., Girelli, M., & Marzi, C. A. (1998). Neural site of the redundant target effect: Electrophysiological
evidence. Journal of Cognitive Neuroscience, 10, 216–225. doi:10.1162/089892998562663
Molholm, S., Ritter, W., Murray, M. M., Javitt, D. C., Schroeder, C. E., & Foxe, J. J. (2002). Multisensory auditory–visual interactions during early sensory processing in humans: A high-density electrical
mapping study. Cognitive Brain Research, 14, 115–128. doi:10.1016/S0926-6410(02)00066-6
Molholm, S., Sehatpour, P., Mehta, A. D., Shpaner, M., Gomez-Ramirez, M., Ortigue, S.,… Foxe, J. J. (2006). Audio–visual multisensory integration in superior parietal lobule revealed by human intracranial
recordings. Journal of Neurophysiology, 96, 721–729. doi:10.1152/jn.00285.2006
Mordkoff, J. T., & Yantis, S. (1991). An interactive race model of divided attention. Journal of Experimental
Copyright 2013 L M Leone, M E McCourt
Published under a Creative Commons Licence a Pion publication Murray, M. M., Foxe, J. J., Higgins, B. A., Javitt, D. C., & Schroeder, C. E. (2001). Visuo-spatial neural
response interactions in early cortical processing during a simple reaction time task: A high-density
electrical mapping study. Neuropsychologia, 39, 828–844. doi:10.1016/S0028-3932(01)00004-5
Otto, T. U., & Mamassian, P. (2012). Noise and correlations in parallel perceptual decision making. Current
Biology, 22, 1–6. doi:10.1016/j.cub.2012.05.031
Phillips, D. P. (1998). Factors shaping the response latencies of neurons in the cat’s auditory cortex. Behavioural
Brain Research, 93, 33–41. doi:10.1016/S0166-4328(97)00139-3
Piéron, H. (1952). The Sensations: Their Functions, Processes and Mechanisms. London: Frederick
Muller Ltd.
Prestrude, A. M. (1971). Visual latencies at photopic levels of retinal illuminance. Vision Research, 11, 351–361.
doi:10.1016/0042-6989(71)90246-X
Raab, D. H. (1962). Statistical facilitation of simple reaction times. Transactions of the New York Academy of
Sciences, 24, 574–590. doi:10.1111/j.2164-0947.1962.tb01433.x
Ross, L. A., Saint-Amour, D., Leavitt, V. M., Javitt, D. C., & Foxe, J. J. (2007). Do you see what I’m saying?
Exploring visual enhancement of speech comprehension in noisy environments. Cerebral Cortex, 17,
1147–1153. doi:10.1093/cercor/bhl024
Roufs, J. A. J. (1963). Perception lag as a function of stimulus luminance. Vision Research, 3, 81–91.
doi:10.1016/0042-6989(63)90070-1
Senkowski, D., Saint-Amour, D., Höle, M., & Foxe, J. J. (2011). Multisensory interactions in early evoked
brain activity follow the principle of inverse effectiveness. NeuroImage, 56, 2200–2208.
doi:10.1016/j.neuroimage.2011.03.075
Serino, A., Farnè, A., Rinaldesi, M. L., Haggard, P., & Làdavas, E. (2007). Can vision of the body ameliorate
impaired somatosensory function? Neuropsychologia, 45, 1101–1107.
doi:10.1016/j.neuropsychologia.2006.09.013
Song, S., Miller, K. D., & Abbott, L. F. (2000). Competitive Hebbian learning through spike-timing-dependent
synaptic plasticity. Nature Neuroscience, 3, 919–926. doi:10.1038/78829
Stein, B. E., & Meredith, M. A. (1993). The Merging of the Senses. Cambridge: MIT Press.
Stuflebeam, S. M., Poeppel, D., Rowley, H. A., & Roberts, T. P. L. (1998). Peri-threshold encoding of stimulus
frequency and intensity in the M100 latency. NeuroReport, 9, 91–94.
Supek, S., Aines, C. J., Ranken, D., Best, E., Flynn, E. R., & Wood, C. C. (1999). Single vs. paired visual stimuli: Superposition of early neuromagnetic responses and retinotopy in extrastriate cortex in humans. Brain Research, 830, 43–55. doi:10.1016/S0006-8993(99)01316-5
Turrigiano, G. G., Leslie, K. R., Desai, N. S., Rutherford, L. C., & Nelson, S. B. (1998). Activity-dependent