Genetic diversity and geographical differentiation of cultivated six-rowed
naked barley landraces from the Qinghai-Tibet plateau of China detected
by SSR analysis
Zong-Yun Feng
1,2,3, Li-Li Zhang
3, Yi-Zheng Zhang
1and Hong-Qing Ling
21
Sichuan University, College of Life Sciences, Key Laboratory of Molecular Biology & Biotechnology,
Chengdu, China.
2
Chinese Academy of Sciences, Institute of Genetics & Developmental Biology, The State Key Laboratory
of Plant Cell & Chromosome Engineering, Beijing, China.
3
Sichuan Agricultural University, College of Agronomy, Yaan, China.
Abstract
Cultivated six-rowed naked barley (Hordeum vulgaressp.hexastichonvar.nudumHsü) is the oldest cultivated bar-ley in China. We used 35 simple sequence repeat (SSR) markers selected from seven barbar-ley linkage groups to study the genetic diversity, geographical differentiation and evolutionary relationships among 65 H. vulgare ssp.
hexastichonlandrace accessions collected from the Qinghai-Tibet plateau of China, 25 accessions from Tibet (TB), 20 from Qinghai (QH) and 20 from Ganzi (GZ) prefecture in Sichuan province. At the 35 SSR loci we identified 248 al-leles among the 65 accessions, 119 (47.98%) of the alal-leles being common alal-leles. We also found that the TB acces-sions possessed 47 private alleles, about 1.5 times more than the 31 private alleles found in the QH accesacces-sions and about 5 times more than 9 private alleles found in the GZ accessions. Generally, the TB accessions showed signifi-cantly higher genetic diversity than either the QH or GZ accessions whereas no significant difference in genetic diver-sity was found between the QH and GZ accessions. Partitioning analysis of genetic diverdiver-sity showed that about 81% of the total variation was due to within-subgroup diversity and about 19% was clearly accounted for by geographical differentiation among the three subgroups. The distributions of alleles for most loci (71.4%) were significantly differ-ent among the three subgroups and geographical differdiffer-entiation could be found according to the distribution of SSR alleles. Cluster analysis indicated that most of the accessions could be clustered into groups which basically coin-cided with their geographical distribution. These results suggest that Tibet might be a center of genetic diversity for cultivated barley, the cultivated six-rowed naked barley on the Qinghai-Tibet plateau of China may have evolved in Tibet and spread to Qinghai and then to Ganzi prefecture of Sichuan province.
Key words:Barley, genetic diversity, Qinghai-Tibet plateau, geographical differentiation, simple sequence repeat marker. Received: March 3, 2005; Accepted: September 21, 2005.
Introduction
Barley (Hordeum vulgareL.) is one of the oldest cul-tivated crops in the world and studying genetic diversity and evolutionary relationships in barley is important for the effective conservation and utilization of barley genetic re-sources. Early studies suggested that there were two origi-nal centers of cultivated barley, one in the Fertile Crescent (Ancient Egypt, the Levant and Mesopotamia) as indicated by the widespread dispersion of Hordeum spontaneum
Koch, the nearest wild ancestor of two- and six-rowed culti-vated barley, in this region (Harlan, 1976) and another in the Tibetan region of China on the Qinghai-Tibet plateau (‘the roof of the world’) supported by the discovery of Hordeum agriocrithonÅberg, a six-rowed wild barley con-sidered an ancestor of two- and six-rowed cultivated barley (Vavilov, 1926; Åberg, 1938; Brücher and Åberg, 1950).
Many studies have demonstrated that Tibetan wild barley populations were clearly different from the Fertile Crescent wild barley in respect to their distribution, ecol-ogy, morpholecol-ogy, archaeolecol-ogy, cytogenetics and isozyme complement (Xu, 1975, 1982; Zhou, 1981; Shao, 1982; Yao, 1982). This supports the hypothesis of separate evolu-tionary systems leading to Tibetan two-rowed wild barley becoming the ultimate progenitor of Chinese cultivated
Send correspondence to Hong-Qing Ling. Chinese Academy of Sciences, Institute of Genetics & Developmental Biology, The State Key Laboratory of Plant Cell & Chromosome Engineering, Datun Road, Chaoyang District, Beijing 100101, China. E-mail: hqling@ genetics.ac.cn.
barley, Tibetan six-rowed wild barley being an intermedi-ate form in the processes of transforming two-rowed wild barley to six-rowed cultivated barley (Xu, 1982). Naked barley (Hordeum vulgarevar.nudum), also called Qingke, is a major food used to produce ‘Zanba’ by ethnic Zangs in-habiting the Qinghai-Tibet plateau of China. Cultivated six-rowed naked barley (H. vulgaressp.hexastichonvar. nudumHsü) is the earliest cultivated barley in China (Fuet al., 2000; Xu and Feng, 2001). Evidently, study on genetic diversity and geographical differentiation of cultivated six-rowed naked barley landraces from the Qinghai-Tibet plateau will be useful in understanding the evolutionary re-lationship of barley.
At present, most studies on the genetic diversity and evolution of cultivated barley from the Qinghai-Tibet pla-teau of China have dealt with morphology (Xu, 1986), bo-tanical classification (Xu, 1982), cytogenetics (Yao, 1982; Shao, 1986) and isozymes (Shao, 1986; Dai and Zhang, 1989; Zhanget al., 1992a, 1994; Sunet al., 1995). How-ever, some researchers have used DNA molecular markers, including restriction fragment length polymorphisms (RFLP) (Zhang et al., 1992b, 1994), random amplified polymorphic DNA (RAPD) (Honget al., 2001) and ribo-somal DNA spacer-length techniques (Liet al., 2003), al-though, except for Tibetan landraces, cultivated six-rowed naked barley landraces from the Qinghai-Tibet plateau have rarely been included in such studies. Simple sequence repeat (SSR), or microsatellite, analysis possess a number of advantages over other forms of genetic analysis, includ-ing a high level of polymorphisms, locus specificity, co-dominance, reproducibility, random distribution through-out the genome and is also methodologically simple (Saghai-Maroofet al., 1994; Fenget al., 2002). Techniques based on SSR technology are useful in evaluating and char-acterizing genetic diversity, phylogenetic development and evolution as well elucidating the relationships within and between species and populations of members of the genus Hordeum(Saghai-Maroofet al., 1994; Russellet al., 1997; Davilaet al., 1998; De Bustoset al., 1999; Fernándezet al., 2002; Zhanget al., 2002; Fenget al., 2003).
In the research described in this paper we used SSR markers covering the seven barley SSR linkage groups (Liu et al., 1996) to investigate the genetic diversity and geo-graphical differentiation of 65 cultivated six-rowed naked barley landraces collected from the Qinghai-Tibet plateau of China.
Materials and Methods
Plant materials
In this study we used 65 landrace accessions (Table 1) of the cultivated six-rowed naked barleyH. vulgareL. ssp. hexastichon var. nudum Hsü (hereafter denominated as nudumbarley) from different geographical locations on the Qinghai-Tibet plateau of China, of which 25 accessions
were from Tibet (TB), 20 from Qinghai (QH) and 20 from Ganzi (GZ) prefecture in Sichuan province. Seeds of the different accessions were kindly provided by the following people: TB accessions by Mr. QIANG Xiao-Lin (Institute of Agricultural Sciences, Tibetan Academy of Agricultural & livestock Sciences); QH accessions by Prof. SUN Li-Jun (Institute of Crop Germplasm Resources, Chinese Acad-emy of Agricultural Sciences); and GZ accessions by Mr. YANG Kai-Jun (Ganzi Institute of Agricultural Sciences in Sichuan province).
Genomic DNA extraction
The cetyltrimethylammonium bromide (CTAB) method (Steinet al., 2001) was used to extract total DNA from about 300 mg of young leaf-tissue of each accession. The quality of the DNA was checked using agarose-gel electrophoresis and the DNA concentration estimated spec-trophotometrically and the solution diluted with distilled water to a final working DNA concentration of 20 ngµL-1.
PCR amplification, electrophoresis and silver staining
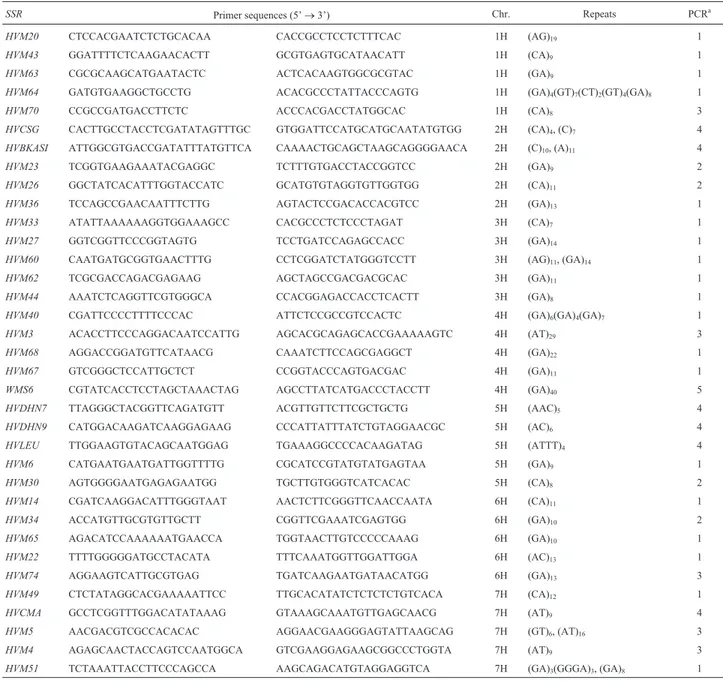
We selected 35 simple sequence repeats (SSRs) (Ta-ble 2), five from each chromosome, from the genetic maps described by Liuet al.(1996). The primers were synthe-sized by a commercial company (AuGCT Biotechnology, Beijing, China). The polymerase chain reaction (PCR) was carried out in a final volume of 15µL containing 2µL of the 20 ngµL-1genomic DNA solution described above
(tem-plate DNA), 1.5µL of 10xPCR buffer containing 15 mM Mg2+, 1.5µL of a 2.5 mM dNTP mixture, 0.5 units of rTaq
1 min and 72 °C for 2 min, followed by a final extension for 10 min at 72 °C.
After PCR amplification 5µL of 98% (v/v) forma-mide electrophoresis loading buffer containing 0.25% (w/v) bromophenol blue and 0.25% (w/v) xylene cyanole FF were added to each reaction mixture. The PCR products were denatured and separated on 6% denaturing poly-acrylamide gel with 8 M urea and 1xTBE buffer running at a constant power of 60 W for one hour. A 50 to 1031 bp DNA ladder (Gene RulerTM50bp DNA ladder, MBI
Fer-ments) was used as a size standard and the DNA fragments were silver stained as described in Bassamet al.(1991).
Data analysis
The amplified DNA fragments of each SSR locus were assessed based on electrophoretic mobility using the Qbasic procedure of Rickwoodet al.(1982) and the SSR profiles were scored for the presence (1) or absence (0) of clear bands. Genetic similarities were estimated using the
DICE coefficient, 2a/(2a+b+c), where ‘a’ refers to alleles shared between two accessions and ‘b’ and ‘c’ to alleles present in either one of the two accessions compared (Rohlf, 1993). Similarity matrix cluster analysis was used to reveal associations among accessions based on the un-weighted pair group method with arithmetic averages (UPGMA) implemented using the NTSYS-pc program (Rohlf, 1993).
Genetic diversity (H) was calculated withH= 1 -Σpi
2
in whichpiis the frequency of thei
th
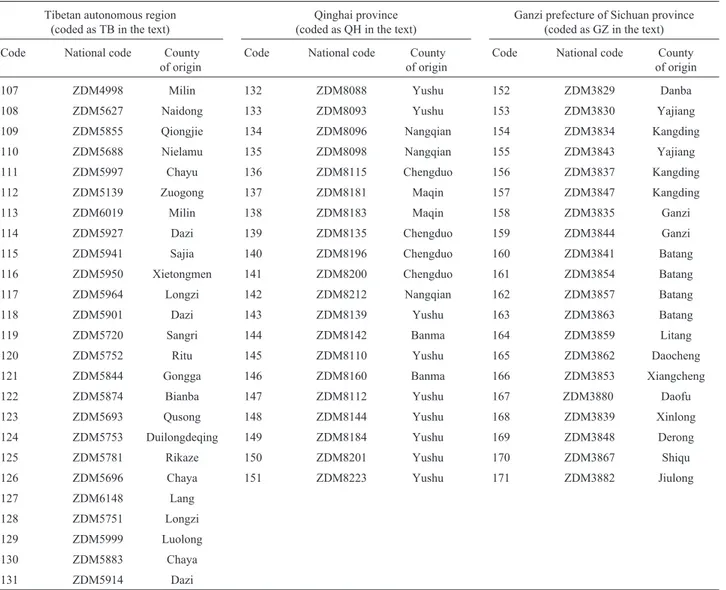
allele of the locus (Nei, 1973). For each locus, the frequencies of each allele in the entire sample were calculated as the expected allele fre-quencies, and the distribution of allelic frequencies among the three subgroups was tested using the Chi-square test (Ronget al., 1993). The genetic diversity of the entire sam-ple (HT) was partitioned into components reflecting genetic distance between subgroups (DST) and genetic polymor-phism within subgroups (HS), with genetic differentiation between subgroups (GST) being calculated as GST = 1 -Table 1- List and origin of cultivated six-rowed naked barley (nudumbarley) landraces collected from the Qinghai-Tibet plateau of China used in this study.
Tibetan autonomous region (coded as TB in the text)
Qinghai province (coded as QH in the text)
Ganzi prefecture of Sichuan province (coded as GZ in the text)
Code National code County of origin
Code National code County of origin
Code National code County of origin
107 ZDM4998 Milin 132 ZDM8088 Yushu 152 ZDM3829 Danba
108 ZDM5627 Naidong 133 ZDM8093 Yushu 153 ZDM3830 Yajiang
109 ZDM5855 Qiongjie 134 ZDM8096 Nangqian 154 ZDM3834 Kangding
110 ZDM5688 Nielamu 135 ZDM8098 Nangqian 155 ZDM3843 Yajiang
111 ZDM5997 Chayu 136 ZDM8115 Chengduo 156 ZDM3837 Kangding
112 ZDM5139 Zuogong 137 ZDM8181 Maqin 157 ZDM3847 Kangding
113 ZDM6019 Milin 138 ZDM8183 Maqin 158 ZDM3835 Ganzi
114 ZDM5927 Dazi 139 ZDM8135 Chengduo 159 ZDM3844 Ganzi
115 ZDM5941 Sajia 140 ZDM8196 Chengduo 160 ZDM3841 Batang
116 ZDM5950 Xietongmen 141 ZDM8200 Chengduo 161 ZDM3854 Batang
117 ZDM5964 Longzi 142 ZDM8212 Nangqian 162 ZDM3857 Batang
118 ZDM5901 Dazi 143 ZDM8139 Yushu 163 ZDM3863 Batang
119 ZDM5720 Sangri 144 ZDM8142 Banma 164 ZDM3859 Litang
120 ZDM5752 Ritu 145 ZDM8110 Yushu 165 ZDM3862 Daocheng
121 ZDM5844 Gongga 146 ZDM8160 Banma 166 ZDM3853 Xiangcheng
122 ZDM5874 Bianba 147 ZDM8112 Yushu 167 ZDM3880 Daofu
123 ZDM5693 Qusong 148 ZDM8144 Yushu 168 ZDM3839 Xinlong
124 ZDM5753 Duilongdeqing 149 ZDM8184 Yushu 169 ZDM3848 Derong
125 ZDM5781 Rikaze 150 ZDM8201 Yushu 170 ZDM3867 Shiqu
126 ZDM5696 Chaya 151 ZDM8223 Yushu 171 ZDM3882 Jiulong
127 ZDM6148 Lang
128 ZDM5751 Longzi
129 ZDM5999 Luolong
130 ZDM5883 Chaya
Hs/HT (Nei, 1973). The comparisons of genetic diversity were carried out using the Z-test (Zhang and Allard, 1986; Zhanget al., 1992).
Results
Allelic variation of SSRs
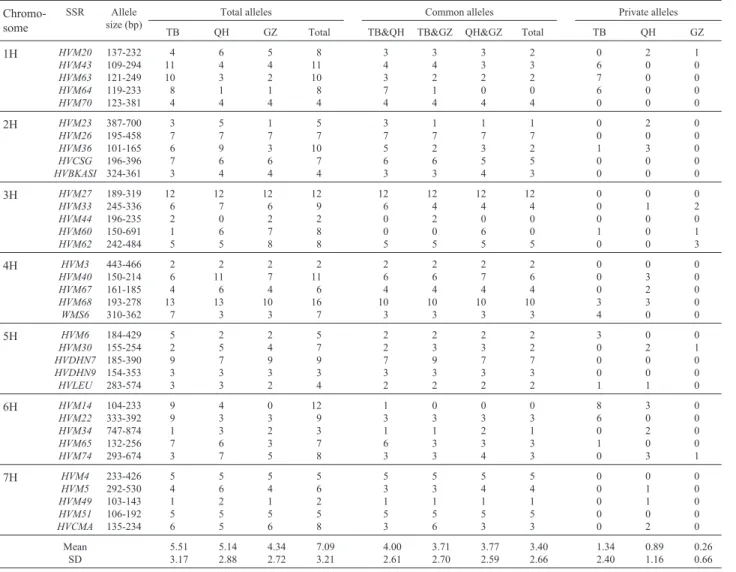
Total alleles, common alleles and the number of pri-vate alleles are shown in Table 3. A total of 248 alleles were detected at the 35 SSR loci, with an average of 7.09 alleles per locus in the entire sample. The number of alleles varied from 16 at the HVM68 locus to 2 each at the HVM3, HVM44andHVM49loci.Seven of the 35 loci showed more than 10 alleles per locus. The alleles for the 35 loci were
distributed among the three geographical location acces-sion subgroups (TB, QH and GZ) as follows: 193 alleles for TB, 180 for QH and 152 for GZ. No allele was detected at theHVM44locus in the QH accessions andHVM14locus in the GZ accessions and only one allele each was detected for theHVM34,HVM49andHVM60loci in the TB acces-sions, the HVM64 locus in the QH accessions and the HVM23,HVM49 andHVM64 loci in the GZ accessions. The average number of alleles per locus and standard devi-ation (SD) of the three subgroups were as follows: TB (5.51 ± 3.17) > QH (5.14 ± 2.88) > GZ (4.34 ± 2.72). Of the 248 alleles, 119 (47.98%) were common to the three sub-groups (common alleles) and the average number of com-mon alleles was 3.40 ± 2.66, with the highest number of Table 2- Primer sequences, PCR conditions, repeats and chromosomal locations of simple sequence repeat (SSR) markers of barley used in this study.
SSR Primer sequences (5’→3’) Chr. Repeats PCRa
HVM20 CTCCACGAATCTCTGCACAA CACCGCCTCCTCTTTCAC 1H (AG)19 1
HVM43 GGATTTTCTCAAGAACACTT GCGTGAGTGCATAACATT 1H (CA)9 1
HVM63 CGCGCAAGCATGAATACTC ACTCACAAGTGGCGCGTAC 1H (GA)9 1
HVM64 GATGTGAAGGCTGCCTG ACACGCCCTATTACCCAGTG 1H (GA)4(GT)7(CT)2(GT)4(GA)8 1
HVM70 CCGCCGATGACCTTCTC ACCCACGACCTATGGCAC 1H (CA)8 3
HVCSG CACTTGCCTACCTCGATATAGTTTGC GTGGATTCCATGCATGCAATATGTGG 2H (CA)4, (C)7 4
HVBKASI ATTGGCGTGACCGATATTTATGTTCA CAAAACTGCAGCTAAGCAGGGGAACA 2H (C)10, (A)11 4
HVM23 TCGGTGAAGAAATACGAGGC TCTTTGTGACCTACCGGTCC 2H (GA)9 2
HVM26 GGCTATCACATTTGGTACCATC GCATGTGTAGGTGTTGGTGG 2H (CA)11 2
HVM36 TCCAGCCGAACAATTTCTTG AGTACTCCGACACCACGTCC 2H (GA)13 1
HVM33 ATATTAAAAAAGGTGGAAAGCC CACGCCCTCTCCCTAGAT 3H (CA)7 1
HVM27 GGTCGGTTCCCGGTAGTG TCCTGATCCAGAGCCACC 3H (GA)14 1
HVM60 CAATGATGCGGTGAACTTTG CCTCGGATCTATGGGTCCTT 3H (AG)11, (GA)14 1
HVM62 TCGCGACCAGACGAGAAG AGCTAGCCGACGACGCAC 3H (GA)11 1
HVM44 AAATCTCAGGTTCGTGGGCA CCACGGAGACCACCTCACTT 3H (GA)8 1
HVM40 CGATTCCCCTTTTCCCAC ATTCTCCGCCGTCCACTC 4H (GA)6(GA)4(GA)7 1
HVM3 ACACCTTCCCAGGACAATCCATTG AGCACGCAGAGCACCGAAAAAGTC 4H (AT)29 3
HVM68 AGGACCGGATGTTCATAACG CAAATCTTCCAGCGAGGCT 4H (GA)22 1
HVM67 GTCGGGCTCCATTGCTCT CCGGTACCCAGTGACGAC 4H (GA)11 1
WMS6 CGTATCACCTCCTAGCTAAACTAG AGCCTTATCATGACCCTACCTT 4H (GA)40 5
HVDHN7 TTAGGGCTACGGTTCAGATGTT ACGTTGTTCTTCGCTGCTG 5H (AAC)5 4
HVDHN9 CATGGACAAGATCAAGGAGAAG CCCATTATTTATCTGTAGGAACGC 5H (AC)6 4
HVLEU TTGGAAGTGTACAGCAATGGAG TGAAAGGCCCCACAAGATAG 5H (ATTT)4 4
HVM6 CATGAATGAATGATTGGTTTTG CGCATCCGTATGTATGAGTAA 5H (GA)9 1
HVM30 AGTGGGGAATGAGAGAATGG TGCTTGTGGGTCATCACAC 5H (CA)8 2
HVM14 CGATCAAGGACATTTGGGTAAT AACTCTTCGGGTTCAACCAATA 6H (CA)11 1
HVM34 ACCATGTTGCGTGTTGCTT CGGTTCGAAATCGAGTGG 6H (GA)10 2
HVM65 AGACATCCAAAAAATGAACCA TGGTAACTTGTCCCCCAAAG 6H (GA)10 1
HVM22 TTTTGGGGGATGCCTACATA TTTCAAATGGTTGGATTGGA 6H (AC)13 1
HVM74 AGGAAGTCATTGCGTGAG TGATCAAGAATGATAACATGG 6H (GA)13 3
HVM49 CTCTATAGGCACGAAAAATTCC TTGCACATATCTCTCTCTGTCACA 7H (CA)12 1
HVCMA GCCTCGGTTTGGACATATAAAG GTAAAGCAAATGTTGAGCAACG 7H (AT)9 4
HVM5 AACGACGTCGCCACACAC AGGAACGAAGGGAGTATTAAGCAG 7H (GT)6, (AT)16 3
HVM4 AGAGCAACTACCAGTCCAATGGCA GTCGAAGGAGAAGCGGCCCTGGTA 7H (AT)9 3
common alleles (12) being detected at theHVM27 locus while no common alleles were detected at the HVM14, HVM44,HVM60andHVM64loci.The number of alleles to specific private alleles per locus varied significantly among the three geographical subgroups with an average of 1.34 in TB, 0.89 in QH and 0.26 in GZ.
Comparison of genetic diversity
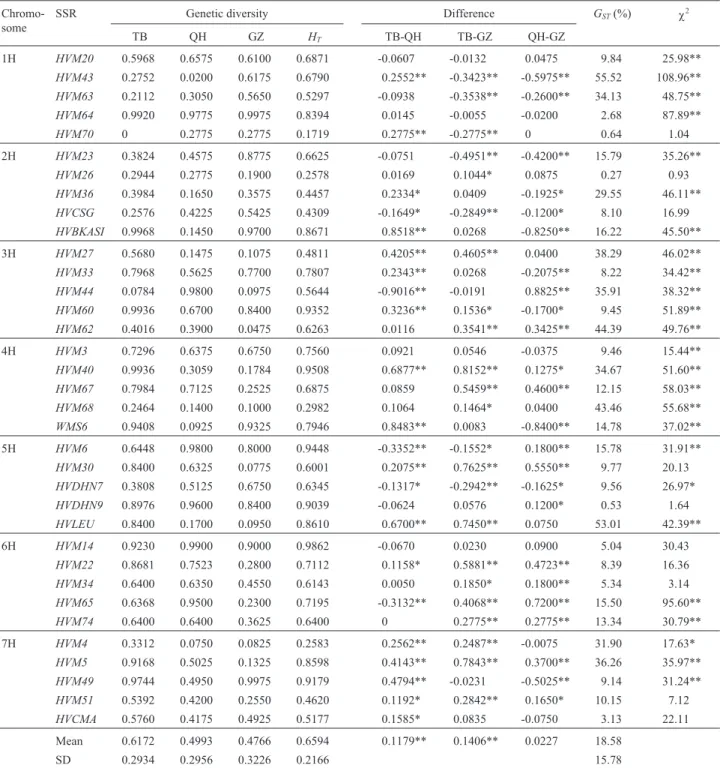
Table 4 presents the statistics relating to the genetic variation found at each locus. The average genetic diversity for the entire sample (HT) was 0.6594 whereas the mean value for the three geographical subgroups was as follows: TB = 0.6172; QH = 0.4993; and GZ = 0.4766. There was a large variation in genetic diversity among the loci, the low-est diversity (0.1719) occurring at theHVM70locus and the highest (0.9862) at theHVM14locus.Genetic diversity in excess of 0.90 was found in eight loci in the TB subgroup, six in the QH subgroup and five in the GZ subgroup. Table 4 also shows that significant genetic diversity be-tween the any two arbitrary-selected subgroups strongly
depended on the loci involved. Genetic diversity in 10 of the 35 loci was in the order TB < QH, with only theHVM74 showing no difference between TB and QH, while most loci (66.7%) showed a significant difference in the order TB > QH. We also found that 16 loci showed significantly larger genetic diversity in the TB and QH subgroups than in the GZ subgroup while only seven loci displayed obviously lower genetic diversity in the TB and QH subgroups than in the GZ subgroup. Similarly, 13 loci in the QH subgroup showed significantly larger genetic diversity than in the GZ subgroup whereas 11 loci in the QH subgroup presented significantly less genetic diversity than in the GZ subgroup. No difference was observed at theHVM70locus in respect of the QH and GZ subgroups. Generally, the genetic diver-sity among the three subgroups was in the order TB > QH > GZ and, on average, genetic diversity in the TB subgroup accessions was significantly larger than in either the QH or GZ subgroups whereas there was no significant difference between the amount of genetic diversity in the QH and GZ subgroup accessions.
Table 3- Allele sizes in base-pairs (bp), total number of alleles and number of common and private simple sequence repeat (SSR) for three subgroups of cultivated six-rowed naked barley (nudumbarley) collected from Tibet (TB), Qinghai (QH) and Ganzi (GZ) in the Qinghai-Tibet plateau of China.
Chromo-some
SSR Allele size (bp)
Total alleles Common alleles Private alleles
TB QH GZ Total TB&QH TB&GZ QH&GZ Total TB QH GZ
Geographical differentiation and distribution of allelic frequencies
The total genetic diversity can be divided into within-and between-populations components, within-and in our case the proportion of each component varied from locus to locus. The genetic variation between subpopulations (GST) re-flects the geographical differentiation of samples, the
amount of differentiation among the three subgroups vary-ing from 0.27% at the HVM26 locus to 55.52% at the HVM43locus with an average of 18.58% and only five loci showing aGSTvalue of less than 5%. The Chi-square test for the distribution of the allelic frequencies of the 35 loci among the three subgroups (Table 4) showed that two loci (HVM4 and HVDHN7) displayed significant differences (p < 0.05) among the three subgroups and 23 loci highly
Table 4- Genetic diversity, geographical differentiation (GST) and allele frequency distribution (χ2) for the 35 simple sequence repeat (SSR) loci among
cultivated six-rowed naked barley (nudumbarley) collected from Tibet (TB), Qinghai (QH) and Ganzi (GZ) in the Qinghai-Tibet plateau of China.
Chromo-some
SSR Genetic diversity Difference GST(%) χ2
TB QH GZ HT TB-QH TB-GZ QH-GZ
1H HVM20 0.5968 0.6575 0.6100 0.6871 -0.0607 -0.0132 0.0475 9.84 25.98**
HVM43 0.2752 0.0200 0.6175 0.6790 0.2552** -0.3423** -0.5975** 55.52 108.96**
HVM63 0.2112 0.3050 0.5650 0.5297 -0.0938 -0.3538** -0.2600** 34.13 48.75**
HVM64 0.9920 0.9775 0.9975 0.8394 0.0145 -0.0055 -0.0200 2.68 87.89**
HVM70 0 0.2775 0.2775 0.1719 0.2775** -0.2775** 0 0.64 1.04
2H HVM23 0.3824 0.4575 0.8775 0.6625 -0.0751 -0.4951** -0.4200** 15.79 35.26**
HVM26 0.2944 0.2775 0.1900 0.2578 0.0169 0.1044* 0.0875 0.27 0.93
HVM36 0.3984 0.1650 0.3575 0.4457 0.2334* 0.0409 -0.1925* 29.55 46.11**
HVCSG 0.2576 0.4225 0.5425 0.4309 -0.1649* -0.2849** -0.1200* 8.10 16.99
HVBKASI 0.9968 0.1450 0.9700 0.8671 0.8518** 0.0268 -0.8250** 16.22 45.50**
3H HVM27 0.5680 0.1475 0.1075 0.4811 0.4205** 0.4605** 0.0400 38.29 46.02**
HVM33 0.7968 0.5625 0.7700 0.7807 0.2343** 0.0268 -0.2075** 8.22 34.42**
HVM44 0.0784 0.9800 0.0975 0.5644 -0.9016** -0.0191 0.8825** 35.91 38.32**
HVM60 0.9936 0.6700 0.8400 0.9352 0.3236** 0.1536* -0.1700* 9.45 51.89**
HVM62 0.4016 0.3900 0.0475 0.6263 0.0116 0.3541** 0.3425** 44.39 49.76**
4H HVM3 0.7296 0.6375 0.6750 0.7560 0.0921 0.0546 -0.0375 9.46 15.44**
HVM40 0.9936 0.3059 0.1784 0.9508 0.6877** 0.8152** 0.1275* 34.67 51.60**
HVM67 0.7984 0.7125 0.2525 0.6875 0.0859 0.5459** 0.4600** 12.15 58.03**
HVM68 0.2464 0.1400 0.1000 0.2982 0.1064 0.1464* 0.0400 43.46 55.68**
WMS6 0.9408 0.0925 0.9325 0.7946 0.8483** 0.0083 -0.8400** 14.78 37.02**
5H HVM6 0.6448 0.9800 0.8000 0.9448 -0.3352** -0.1552* 0.1800** 15.78 31.91**
HVM30 0.8400 0.6325 0.0775 0.6001 0.2075** 0.7625** 0.5550** 9.77 20.13
HVDHN7 0.3808 0.5125 0.6750 0.6345 -0.1317* -0.2942** -0.1625* 9.56 26.97*
HVDHN9 0.8976 0.9600 0.8400 0.9039 -0.0624 0.0576 0.1200* 0.53 1.64
HVLEU 0.8400 0.1700 0.0950 0.8610 0.6700** 0.7450** 0.0750 53.01 42.39**
6H HVM14 0.9230 0.9900 0.9000 0.9862 -0.0670 0.0230 0.0900 5.04 30.43
HVM22 0.8681 0.7523 0.2800 0.7112 0.1158* 0.5881** 0.4723** 8.39 16.36
HVM34 0.6400 0.6350 0.4550 0.6143 0.0050 0.1850* 0.1800** 5.34 3.14
HVM65 0.6368 0.9500 0.2300 0.7195 -0.3132** 0.4068** 0.7200** 15.50 95.60**
HVM74 0.6400 0.6400 0.3625 0.6400 0 0.2775** 0.2775** 13.34 30.79**
7H HVM4 0.3312 0.0750 0.0825 0.2583 0.2562** 0.2487** -0.0075 31.90 17.63* HVM5 0.9168 0.5025 0.1325 0.8598 0.4143** 0.7843** 0.3700** 36.26 35.97**
HVM49 0.9744 0.4950 0.9975 0.9179 0.4794** -0.0231 -0.5025** 9.14 31.24**
HVM51 0.5392 0.4200 0.2550 0.4620 0.1192* 0.2842** 0.1650* 10.15 7.12
HVCMA 0.5760 0.4175 0.4925 0.5177 0.1585* 0.0835 -0.0750 3.13 22.11
Mean 0.6172 0.4993 0.4766 0.6594 0.1179** 0.1406** 0.0227 18.58
SD 0.2934 0.2956 0.3226 0.2166 15.78
significant differences (p < 0.01), whereas ten loci showed no clear differences in their distribution among the three subgroups. These results clearly show that there exists sig-nificantly geographical differentiation among the three subgroups.
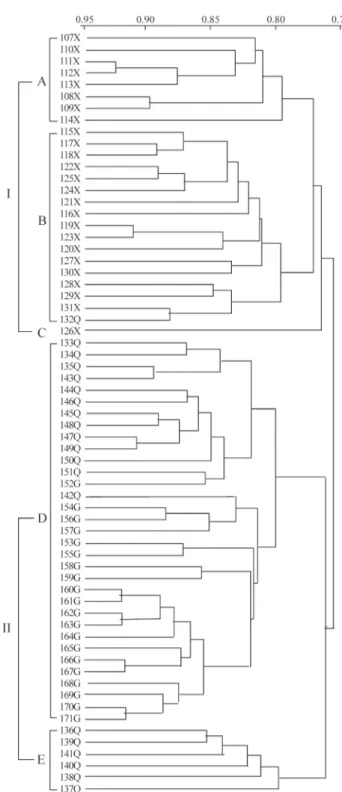
Cluster analysis
In order to reveal genetic relationships of 65 acces-sions of cultivated six-rowed naked barley (nudumbarley) landraces from the Qinghai-Tibet plateau of China, the ge-netic similarity coefficients between accessions were cal-culated and a dendrogram was constructed depicting the relationships between the accessions (Figure 1). At a ge-netic similarity level of about 0.76 the accessions were clearly clustered into two large groups (Cluster I and cluster II) with all the TB accessions being located in cluster I while, except for accession QH132, the QH and GZ acces-sions were located in cluster II. At a genetic similarity of about 0.79 the accessions were clustered in five large groups (A, B, C, D and E, Figure 1), all the TB accessions being clustered in groups A, B and C while 13 of the 20 QH accessions and all 20 GZ accessions were clustered to-gether in group D, with the four accessions from Chengduo county and the two accessions from Maqin county (both counties in Qinghai province,i.e. QH accessions) being separately clustered in group E (Figure 1). In group D the QH and GZ accessions were clustered into their own sepa-rate groups at a genetic similarity level of 0.8 (Figure 1). These results clearly reveal the geographical differentiation ofnudumbarley landraces in the Qinghai-Tibet plateau and their genetic relationship.
Discussion
In this study, we investigated the genetic variation among 65 nudum barley landraces at 35 SSR loci in the bar-ley genome. There exists large genetic variation within and among the three geographical subgroups TB, QH and GZ. The genetic diversity was significantly higher in nudum barley from the TB region than it from either the QH or GZ regions while there was no significant difference in terms of genetic diversity between the QH and GZ barleys. The total number of alleles and their standard deviations (Table 3) were in the order TB > QH > GZ, while the average ge-netic distance followed the order TB (0.2071) > QH (0.2063) > GZ (0.1640). In addition, 18.58% of the total variation accounted for by differentiation among the three subgroups. These results appear to be in basic agreement with the Chi-square test on the distribution of allele fre-quencies (Table 4). The number of common and private al-leles (Table 3) also reflected a certain geographical differentiation among the three subgroups, possibly due to the different geographical and ecological factors in the dif-ferent regions of the Qinghai-Tibet plateau. As mentioned above, all the Tibetan accessions were clustered into one group (Cluster I) at a genetic similarity level of about 0.76
whereas the QH and GZ accessions (except the QH 132 ) were grouped in cluster II.
pointed out that the Middle-Western mountains of China were an original center of cultivated six-rowed naked bley. Previous morphological, ecological, distributional, ar-chaeological and isozyme studies as well as genetics have shown thatH. spontaneumin Tibet was the ultimate ances-tor of Chinese cultivated barley whereasH. agriocrithon was an intermediate form in the transformation from H. spontaneumto cultivated barley (Xu, 1982).
Recently, our results on Tibetan wild barley using SSR markers also indicated that the Shannan region in Ti-bet might be the original center of TiTi-betan two-rowed wild barley (Fenget al., 2003) andHordeum lagunculiformein Tibet an intermediate form in the transformation fromH. spontaneumtoH. agriocrithon(unpublished data). Dai and Zhang (1989) studied the genetic diversity of six isozyme loci in cultivated barley from different agro-geographical regions in Tibet and found that the degree of genetic diver-sity was significantly higher in Tibetan cultivated barley than Ethiopia barley using the same 6 isozyme loci (Zhang et al., 1992a). Liet al. (2003) also supported the notion of Tibet being a center of genetic diversity for cultivated bar-ley.
In conclusion, our SSR analysis of the 65 accessions ofH. v.hexastichonvar.nudumHsü six-rowed naked bar-ley from the Qinghai-Tibet plateau showed that thenudum barley landraces in Tibet possessed generally higher ge-netic diversity than those in Qinghai and Ganzi, with about 19% of the genetic diversity being accounted for by geo-graphical differentiation among the three subgroups. This suggests that Tibet might be a center of genetic diversity of cultivated barley and that the cultivated six-rowed naked barley on the Qinghai-Tibet plateau of China might have evolved in Tibet and spread to Qinghai and then to Ganzi prefecture of Sichuan province.
Acknowledgments
The authors thank Prof. Ting-Wen Xu (Sichuan Agri-cultural University, China) for his critical reading of the manuscript, and Wen-Juan Zhou (Institute of Genetics & Developmental Biology, Chinese Academy of Sciences) for her useful assistance. The research was supported by a grant from the Chinese Academy of Sciences (KSCX2-SW-304), Program for Changjiang Scholars and Innovative Research in University (IRT0453), Sichuan Education De-partment and Sichuan Science and Technology DeDe-partment of China.
References
Åberg E (1938)Hordeum agriocrithon, a wild six-rowed barley. Ann Agric Sweden 6:159-216.
Bassam B, Caetano-Anolles G and Gresshoffet P (1991) Fast and sensitive silver staining of DNA in polyacrylamide gels. Anal Biochem 196:81-84.
Brücher H and Åberg E (1950) Die-primitiv-gersten des hochlands von Tibet, ihre bedeutung fuer die zuechtung und
das verstandis des ursprungs und der klassifizierung der gersten. Ann KGL Landwei Hochsch Schwedens 17:247-319.
Dai XK and Zhang QF (1989) Genetic diversity of six isozyme loci in cultivated barley of Tibet. Theor Appl Genet 78:281-286.
Davila J, Sanchez de la Hoz M, Loarce Y and Ferrer E (1998) The use of random amplified microsatellite polymorphic DNA and coefficients of parentage to determine genetic relation-ships in barley. Genome 41:477-486.
De Bustos A, Soler C and Jouve N (1999) Analysis by PCR-based markers using designed primers to study relationships be-tween species ofHordum(Poaceae). Genome 4:129-138. Feng ZY, Zhang YZ and Ling HQ (2002) Microsatellite markers
and applications in the barley. Hereditas 24:727-733. Feng ZY, Zhang YZ, Zhang LL and Ling HQ (2003) Genetic
di-versity and geographical differentiation ofHordeum vulgare
ssp.spontaneumin Tibet using microsatellite markers. High Technology Letters 13:46-53.
Fernández ME, Figueiras AM and Benitoc (2002) The use of ISSR and RAPD markers for detecting DNA polymorphism, genotype identification and genetic diversity among barley cultivars with known origin. Theor Appl Genet 104:845-851.
Fu DX, Xu TW and Feng ZY (2000) The ancient carbonized bar-ley (Hordeum vulagreL. var.nudum) kernel discovered in the middle of Yalu Tsanypo river basin in Tibet. Southwest Chin J of Agri Sci 13:38-41.
Harlan JR (1976) Barley. In: Simmonds N (ed) Evolution of Crop Plants. Academic Press, London and New York, pp 93-98. Hong QB, Hou L, Luo XY, Li DM, Xiao YH, Pei Y, Yang KJ and
Jia C (2001) Using RAPD for evaluating genetic back-ground among naked barley varieties in Sichuan northwest-ern region. Scientia Agricultura Sinica 34:133-138. Li X, Xu C and Zhang QF (2003) Ribosomal DNA spacer-length
polymorphisms in three samples of wild and cultivated bar-leys and their relevance to the origin of cultivated barley. Plant Breed 122:1-5.
Liu ZW, Biyashev RM and Saghai-Maroof MA (1996) Develop-ment of simple sequence repeat DNA markers and their inte-gration into a barley linkage map. Theor Appl Genet 93:869-876.
Molina-Cano JL, Moralejo M, Igartua E and Romagosa I (1999) Further evidence supporting Morocco as a centre of origin of barley. Theor Appl Genet 98:913-918.
Nei M (1973) Analysis of gene diversity in subdivided popula-tions. Proc Natl Acad Sci USA 70:3321-3323.
Pau G and Southern EM (1982) Electrophoresis of DNA. In: Rickwood D and Hames BD (eds) Gel Electrophoresis of Nucleic Acids: A Practical Approach. IRL Press Limited, Oxford and Washington DC, pp 39-75.
Rohlf FJ (1993) NTSYS-pc, Numerical Taxonomy and Multi-variate Analysis System. Applied Biostatics Incorporated, New York.
Rong TZ (1993) Chi-square test. In: Rong TZ (ed) Agricultural Experiments and Statistical Analysis. 1st edition. Sichuan Sci & Tech Press, Chengdu, China, pp 85-90.
Saghai-Maroof MA, Biyashev RM, Yang GP, Zhang QF and Allard AW (1994) Extraordinarily polymorphic microsate-llite DNA in barley: Species diversity, chromosomal loca-tions, and population dynamics. Proc Natl Acad Sci USA 91:5466-5470.
Shao QQ (1982) Wild Barley of Tibet. 1st edition. Scientific Press, Beijing, pp 1-86.
Shao QQ, Li AS and Zhou ZQ (1986) Genetic distance between cultivated barley and its wild relatives. In: Chinese Barley Special Committee (ed) Proceedings of Chinese Barley Sci-ence. Chin Agri Sci & Tech Press, Beijing, pp 22-23. Stein N, Herren G and Keller B (2001) A new DNA extraction
method for high-throughput marker analysis in a large-ge-nome species such as Triticum aestivum. Plant Breed 120:354-356.
Sun LJ, Gao JY and Guan JP (1995) Diversity of esterase isozyme and its geographical distribution in barley of China. Crop Genetic Resources 2:1-5.
Vavilov NI (1926) Studies on the origin of cultivated plants. Bull Appl Bot Genet Plant Breed USSR 16:1-248.
Xu TW (1975) On the origin and phylogeny of cultivated barley with reference to the discovery of Ganzi wild two-rowed barleyHordeum spontaneumC. Koch. Acta Genetica Sinica 2:129-137.
Xu TW (1982) Origin and evolution of cultivated barley in China. Acta Genetica Sinica 9:440-446.
Xu TW (1986) Origin and phylogeny of cultivated barley in China. In: Proceedings of Chinese Barley Science. Chin Agri Sci & Tech Press, Beijing, pp 34-44.
Xu TW and Feng ZY (2001) On the origin of cultivated barley in China with reference to the explanations of the Chinese clas-sical words Lai Mu. Southwest Chin J of Agric Sci 14:102-104.
Yao Z (1982) Study on N-bands of chromosomes in wild and cul-tivated barley. Acta Genetica Sinica 9:160-164.
Zhang QF and Allard RW (1986) Sampling variance of the ge-netic diversity index. J Heredity 77:54-55.
Zhang QF, Dai XK and Saghai-Maroof MA (1992a) Comparative assessment of genetic variation at 6 isozyme loci in barley from two centers of diversity. Ethiopia and Tibet. Chin J Genet 19:119-126.
Zhang QF, Saghai-Maroof MA and Yang GP (1992b) Ribosomal DNA polymorphisms and the Oriental-Occidental genetic differentiation in cultivated barley. Theor Appl Genet 84:682-687.
Zhang QF, Yang GP, Dai XK and Sun JZ (1994) A comparative analysis of genetic polymorphism in wild and cultivated bar-ley from Tibet using isozyme and ribosomal DNA markers. Genome 37:631-638.
Zhang XY, Li CW, Wang LF, Wang HM, You GX and Dong YS (2002) An estimation of the minimum number of SSR al-leles needed to reveal genetic relationships in wheat variet-ies. I. Information from large-scale planted varieties and cornerstone breeding parents in Chinese wheat improve-ment and production. Theor Appl Genet 106:112-117. Zhou ZQ (1981) Comparison between the two-rowed wild barley
of Qing-Zang plateau and of Israel. Acta Genetica Sinica 8:344-349.