Generation of High-Density Genetic Maps in Tomato
Sung-Chur Sim1, Gregor Durstewitz2, Jo¨rg Plieske2, Ralf Wieseke2, Martin W. Ganal2, Allen Van Deynze3, John P. Hamilton4, C. Robin Buell4, Mathilde Causse5, Saranga Wijeratne6, David M. Francis1*
1Department of Horticulture and Crop Science, Ohio Agricultural Research and Development Center, The Ohio State University, Wooster, Ohio, United States of America, 2TraitGenetics GmbH, Gatersleben, Germany,3Seed Biotechnology Center, University of California Davis, Davis, California, United States of America,4Department of Plant Biology, Michigan State University, East Lansing, Michigan, United States of America,5Institut National de la Recherche Agronomique, INRA, Unite´ de Ge´ne´tique et d’Ame´lioration des Fruits et Le´gumes, Montfavet, France,6Molecular Cellular and Imagining Center, Ohio Agricultural Research and Development Center, The Ohio State University, Wooster, Ohio, United States of America
Abstract
The concurrent development of high-throughput genotyping platforms and next generation sequencing (NGS) has increased the number and density of genetic markers, the efficiency of constructing detailed linkage maps, and our ability to overlay recombination and physical maps of the genome. We developed an array for tomato with 8,784 Single Nucleotide Polymorphisms (SNPs) mainly discovered based on NGS-derived transcriptome sequences. Of the SNPs, 7,720 (88%) passed manufacturing quality control and could be scored in tomato germplasm. The array was used to generate high-density linkage maps for three interspecific F2populations: EXPEN 2000 (Solanum lycopersicumLA0925 xS. pennellii LA0716, 79 individuals), EXPEN 2012 (S. lycopersicumMoneymaker xS. pennelliiLA0716, 160 individuals), and EXPIM 2012 (S. lycopersicum Moneymaker x S. pimpinellifolium LA0121, 183 individuals). The EXPEN 2000-SNP and EXPEN 2012 maps consisted of 3,503 and 3,687 markers representing 1,076 and 1,229 unique map positions (genetic bins), respectively. The EXPEN 2000-SNP map had an average marker bin interval of 1.6 cM, while the EXPEN 2012 map had an average bin interval of 0.9 cM. The EXPIM 2012 map was constructed with 4,491 markers (1,358 bins) and an average bin interval of 0.8 cM. All three linkage maps revealed an uneven distribution of markers across the genome. The dense EXPEN 2012 and EXPIM 2012 maps showed high levels of colinearity across all 12 chromosomes, and also revealed evidence of small inversions between LA0716 and LA0121. Physical positions of 7,666 SNPs were identified relative to the tomato genome sequence. The genetic and physical positions were mostly consistent. Exceptions were observed for chromosomes 3, 10 and 12. Comparing genetic positions relative to physical positions revealed that genomic regions with high recombination rates were consistent with the known distribution of euchromatin across the 12 chromosomes, while very low recombination rates were observed in the heterochromatic regions.
Citation:Sim S-C, Durstewitz G, Plieske J, Wieseke R, Ganal MW, et al. (2012) Development of a Large SNP Genotyping Array and Generation of High-Density Genetic Maps in Tomato. PLoS ONE 7(7): e40563. doi:10.1371/journal.pone.0040563
Editor:Tongming Yin, Nanjing Forestry University, China
ReceivedMarch 8, 2012;AcceptedJune 9, 2012;PublishedJuly 10, 2012
Copyright:ß2012 Sim et al. This is an open-access article distributed under the terms of the Creative Commons Attribution License, which permits unrestricted use, distribution, and reproduction in any medium, provided the original author and source are credited.
Funding:This work was supported by a grant from the United States Department of Agriculture/National Institute of Food and Agriculture (USDA/NIFA) (2008-55300-04757 and 2009-85606-05673). Work at TraitGenetics was supported by the German Federal Ministry of Education and Research (BMBF) through grant number 0315639A. INRA SNPs were obtained from the INRA AIP Bioresources and from the ARCAD sub-project ‘‘Comparative population genomics’’. ARCAD (Agropolis Resource Center for Crop Conservation, Adaptation and Diversity) is funded (2009–2013) by the Agropolis Fondation, the French foundation for Agricultural Sciences and Sustainable Development (www.arcad-project.org and www.agropolis-fondation.fr). The funders had no role in study design, data collection and analysis, decision to publish, or preparation of the manuscript.
Competing Interests:The authors have the following conflicts: Dr. Durstewitz, Dr. Plieske, Dr. Wieseke, and Dr. Ganal have competing interests as members of TraitGenetics, which is a commercial company that performs molecular marker analysis with the tomato SNP array. TraitGenetics has also a commercial interest in the data generated with the array since it increases the value of their services to their customers. This does not alter the authors’ adherence to all the PLoS ONE policies on sharing data and materials. There are no further products in development or marketed products or patents to declare.
* E-mail: [email protected]
Introduction
Tomato (Solanum lycopersicumL.) has been a model species for basic studies in plant biology. The strength of genetic resources anchored to high-density maps has permitted the map-based cloning of genes involved in disease resistance [1–4], plant and fruit development [5,6], and regulation of biochemical processes [7]. The first high-density genetic map for tomato consisted of over 1,000 restriction fragment length polymorphism (RFLP) markers segregating in an interspecific F2population derived from a wide cross between S. lycopersicum and S. pennellii [8]. More recently, mapping studies have focused on polymerase chain reaction
(PCR)-based markers with genetic maps of cultivated tomato developed using 344 Simple Sequence Repeat (SSR) and 793 Singe Nucleotide Polymorphism (SNP) markers [9] and integrated
S. lycopersicumxS. pimpinellifolium maps based on 434 PCR-based markers [10].
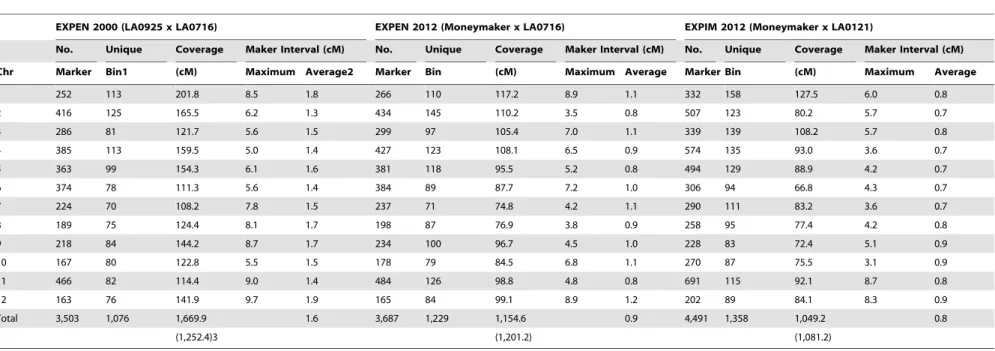
Table 1.Number of SNP markers and coverage in cM of each chromosome in three linkage maps.
EXPEN 2000 (LA0925 x LA0716) EXPEN 2012 (Moneymaker x LA0716) EXPIM 2012 (Moneymaker x LA0121)
No. Unique Coverage Maker Interval (cM) No. Unique Coverage Maker Interval (cM) No. Unique Coverage Maker Interval (cM)
Chr Marker Bin1 (cM) Maximum Average2 Marker Bin (cM) Maximum Average Marker Bin (cM) Maximum Average
1 252 113 201.8 8.5 1.8 266 110 117.2 8.9 1.1 332 158 127.5 6.0 0.8
2 416 125 165.5 6.2 1.3 434 145 110.2 3.5 0.8 507 123 80.2 5.7 0.7
3 286 81 121.7 5.6 1.5 299 97 105.4 7.0 1.1 339 139 108.2 5.7 0.8
4 385 113 159.5 5.0 1.4 427 123 108.1 6.5 0.9 574 135 93.0 3.6 0.7
5 363 99 154.3 6.1 1.6 381 118 95.5 5.2 0.8 494 129 88.9 4.2 0.7
6 374 78 111.3 5.6 1.4 384 89 87.7 7.2 1.0 306 94 66.8 4.3 0.7
7 224 70 108.2 7.8 1.5 237 71 74.8 4.2 1.1 290 111 83.2 3.6 0.7
8 189 75 124.4 8.1 1.7 198 87 76.9 3.8 0.9 258 95 77.4 4.2 0.8
9 218 84 144.2 8.7 1.7 234 100 96.7 4.5 1.0 228 83 72.4 5.1 0.9
10 167 80 122.8 5.5 1.5 178 79 84.5 6.8 1.1 270 87 75.5 3.1 0.9
11 466 82 114.4 9.0 1.4 484 126 98.8 4.8 0.8 691 115 92.1 8.7 0.8
12 163 76 141.9 9.7 1.9 165 84 99.1 8.9 1.2 202 89 84.1 8.3 0.9
Total 3,503 1,076 1,669.9 1.6 3,687 1,229 1,154.6 0.9 4,491 1,358 1,049.2 0.8
(1,252.4)3 (1,201.2) (1,081.2)
1Unique map positions covered by SNP markers.
2Average marker interval (cM) = coverage/number of unique bins.
3Map length recalculated based on subsets of markers that were separated by at least 5 cM interval. doi:10.1371/journal.pone.0040563.t001
SNP
Array-Based
Genetic
Mapping
in
Tomato
PLoS
ONE
|
www.plos
one.org
2
July
2012
|
Volume
7
|
Issue
7
|
[14,15], maize [16], durum wheat [17], sugarcane [18], soybean [19,20], and potato [21]. In tomato, NGS of the transcriptome produced 17 Gb of sequence for six accessions and led to the identification of 62,576 non-redundant SNPs [22].
High-throughput SNP discovery has been paralleled by the development of genotyping platforms that permit cost-effective scoring of many thousands of SNPs in a highly parallel fashion [23,24] facilitating high-density genetic map construction. For maize, an array consisting of 49,585 SNPs was used to develop two linkage maps with 20,912 and 14,524 markers, respectively [25]. In the age of incomplete genome sequences and partial physical maps, high resolution genetic maps remain an essential resource. Such maps help to improve genome assemblies, provide estimates of recombination relative to physical distance, and remain an essential feature for the dissection of complex traits. The information provides an essential guide to genomic assisted crop improvement, where recombination remains a constraint.
In order to facilitate genetic analysis and breeding, we developed the first large scale SNP genotyping array for tomato using 8,784 SNPs mainly discovered based on NGS-derived transcriptome sequences for six accessions [22]. Three high-resolution linkage maps were constructed using interspecific F2 populations to provide details of genetic order, recombination, and their position relative to the draft assembly of the tomato reference genome sequence. The SNP array and high-density linkage maps will be useful for population level analysis, trait discovery, and selection for cultivar improvement in tomato.
Results
SNP Array
We developed a genotyping array on the Illumina Infinium platform (Illumina Inc., San Diego, CA, USA) based on 8,784 SNPs. These SNPs represented a highly filtered and selected set, optimized for polymorphism detection among cultivated germ-plasm and spread throughout the genome. Of these, 7,720 SNPs (88%) passed manufacturing quality control (Table S1). A failure rate of 12% was considered normal and acceptable (less than 15% is expected according to the manufacturer). The scorable SNPs included 501 from candidate genes and 1,307 that were cross-validated with community data sets from TraitGenetics (Gate-rsleben, Germany), the French National Institute for Agricultural Research (Institut National de la Recherche Agronomique, INRA), and previously published SNPs [22,26,27] (Table S1).
Genetic Map Construction
The widely used tomato reference population EXPEN 2000 was used to develop a SNP map (EXPEN 2000-SNP) based on 79 F2 individuals from a cross between LA0925 (S. lycopersicum) and LA0716 (S. pennellii). Among 7,720 scorable SNPs on the array, 3,640 were polymorphic between the parental lines and were analyzed in the mapping population. 3,503 SNP markers could be placed as codominant markers on the linkage map representing 1,076 unique map positions (genetic bins) with an average marker bin interval of 1.6 cM and the largest gap of 9.7 cM on chromosome 12 (Table 1 and Table S2). Each chromosome was covered by 70–125 genetic bins. We observed an uneven distribution of the markers on the array across all 12 chromosomes that was not in agreement with the reported chromosomal size [28]. For example, 252 SNPs covered 201.8 cM (113 genetic bins) on chromosome 1, while 466 SNPs covered 114.4 cM (82 genetic bins) on the cytologically smaller chromosome 11. For a confirmation of the chromosomal marker assignment, the SNP markers that were polymorphic between M82 and S. pennellii
LA0716 were also localized on the reference introgression lines (ILs) [29] that were available for most of the tomato genome (except parts of chromosomes 4, 5, 8 and 9). The linkage mapping and the IL assignment were consistent with very few mismatches (Table S2).
Since the EXPEN 2000-SNP map was based on relatively few (n = 79) individuals and the introgression lines did not cover all chromosomal regions, another linkage map (EXPEN 2012) was generated based on 160 F2 individuals derived from a cross between Moneymaker (S. lycopersicum) and LA0716. Of 3,770 polymorphic SNPs between the parental lines, 3,687 markers (1,229 genetic bins) were mapped with an average marker bin interval of 0.9 cM (Table 1 and Table S3). The two largest gaps of 8.9 cM each were on chromosomes 1 and 12. As in the EXPEN 2000-SNP map, the number of polymorphic markers for each chromosome did not correlate fully with the chromosomal size with the discrepancy being most pronounced for chromosome 1 and 11 (Table 1). Otherwise, the marker distribution between the two EXPEN maps was comparable.
In addition to the two EXPEN maps which were based on crosses between red-fruited speciesS. lycopersicum and the green-fruitedS. pennellii, the EXPIM 2012 map was analyzed with 183 F2 individuals derived from a more narrow cross between Money-maker (S. lycopersicum) and the red fruited LA0121 (S. pimpinellifo-lium). Among 4,792 polymorphic SNPs between the parental lines, 4,491 markers were mapped as codominant loci representing 1,358 genetic bins with an average marker bin interval of 0.8 cM and the largest gap of 8.7 cM on chromosome 11 (Table 1 and Table S4). The distribution of the SNP markers across all chromosomes was again similar to the other linkage maps (Table 1). The map of chromosome 1 consisted of 332 SNP markers covering 127.5 cM and 158 unique bins while the map of chromosome 11 consisted of 691 SNP markers covering 92.1 cM and 115 unique bins.
Genetic Map Length
The total genetic distance of the EXPEN 2000-SNP map was estimated as 1,669.9 cM, or approximately 45% larger than the EXPEN 2012 map (1,154.6 cM) and 59% larger than the EXPIM 2012 map (1,049.2 cM) (Table 1). Although our estimate of genetic length for the EXPEN 2000-SNP map was marginally larger than expected based on previous estimates of genetic map length for this population (1,503 cM) [9], we were concerned about discrepancies in size between the three populations. One possible explanation for the observed increase in the amount of recombination in the EXPEN 2000-SNP map could be selection at gametophytic and post-zygotic stages, leading to distorted segregation and inflated estimates of recombination in that specific population. To address this possibility, we investigated whether there was an excess of chromosomes with distorted makers. Chromosomes 1, 10 and 11 contained a high proportion of distorted markers. A test for correlations between map expansion and distorted segregation did not support a positive relationship (m =20.7; R2= 0.19; P= 0.146) suggesting that distorted segre-gation was not responsible for the expanded map.
hypothesis, we repeated the EXPEN 2000-SNP map construction by selecting 307–325 markers that were separated by at least 5 cM interval and recalculated the genetic map. This resampling analysis led to estimates of map length that were reduced by an average of 25% (range 22–27%) relative to the EXPEN 2000-SNP map length based on all markers (Table 1). This reduction was not observed when the same approach was used in the EXPEN 2012 and EXPIM 2012 populations (Table 1). These results suggest that the small population size of the EXPEN 2000-SNP reference map limited the ability to accurately determine marker distance based on recombination when marker density was high.
The approach of creating a series of resampled maps allowed us to compare map length between the EXPEN 2012 and EXPIM 2012 populations. The 10% difference between the two maps was significant based on over 100 iterations. The EXPEN 2012 map was significantly (P,0.001) longer for chromosomes 2, 4, 5, 6, 9, 10, 11 and 12. The EXPIM 2012 map was significantly (P,0.001) longer for chromosome 1 and 7. No differences were detected for average distances on chromosome 3 and 8, though there may be differences in recombination length between the two maps for the arms of chromosome 8.
Chromosome Assignment and Colinearity between Genetic Maps
The genetic positions of 5,621 SNP markers across 12 chromosomes could be determined with 3,149 markers in common between the EXPEN 2000-SNP and EXPEN 2012 maps; 2,509 markers in common between EXPEN 2000-SNP and EXPIM 2012 maps; and 2,841 markers in common between EXPEN 2012 and EXPIM 2012 maps (Table 2 and Tables S5, S6, S7). All of the shared markers showed highly conserved chromosome assignments. As with the individual maps, the number of markers in common for each chromosome varied and ranged from 106 on chromosome 12 to 413 on chromosome 11 (Table 2). In order to assess levels of colinearity between the linkage maps, the common markers were ranked based on their chromosome positions and their rank orders were used for regression analysis. High levels of colinearity (0.96–1.00 regression coefficients) were observed across 12 chromosomes between both EXPEN maps (Table 2). The EXPIM 2012 map showed coefficients of colinearity ranging between 0.85–0.99 for the EXPEN 2000-SNP comparison and 0.98–1.00 for the EXPEN 2012 comparison again indicating that the larger EXPEN 2012 map is most likely more accurate. Due to map quality, further comparative analysis was conducted only between the EXPEN 2012 and EXPIM 2012 maps which were of comparable population size (160 vs. 183 individuals). Plotting the common markers based on rank order revealed several regions with inverse marker orders, characterized by a strong linear correlation with a negative slope over short distances, between these linkage maps. Specifically, patterns on chromosome 1 (coordinates 20, 20), chromosome 3 (coordinates 40, 40), chromosome 6 (coordinates 20, 20), chromosome 7 (coordinates 5, 5 and 140, 140), and chromosome 9 (coordinates 20, 20) are consistent with inversions between the S. pimpinellifolium LA0121 and S. pennellii LA0716 parents (Figure 1). Regions on chromosome 1 (coordinates 100, 100) and chromosome 2 (coordinates 60, 60) highlight where marker order diverges, but evidence for a simple inversion based on a strong negative correlation is less robust (Figure 1).
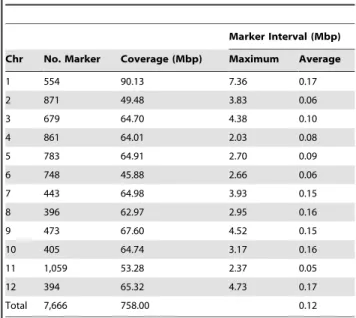
Comparison between Genetic and Physical Positions In addition to the genetic map position, the physical positions of 7,666 SNPs were determined relative to the tomato reference genome sequence [30] (Table S1) and available through the
Solanaceae Genome Network (SGN; http://solgenomics.net). A total of 758 Mbp of the tomato genome was covered by the SNP markers on the array with an average distance between markers of 0.12 Mbp (Table 3). Chromosome 1 showed the largest physical gap with no markers (7.36 Mbp) followed by a region on chromosome 12 (4.73 Mbp). The most markers (1,059 SNPs) were mapped on chromosome 11, which is cytologically one of the smallest tomato chromosomes [28].
Among the 7,666 SNPs with physical positions, 5,296 SNP markers were mapped on one or both of the EXPEN 2012 and EXPIM 2012 genetic linkage maps (Table S8). These markers were used for comparative analysis of genetic and physical positions. We found that the vast majority (99.7%) of the SNPs in the linkage maps showed conserved chromosome assignments with the corresponding physical positions. Sixteen non-syntenic markers were not genetically mapped to the assigned physical chromosomes (Table S8). Among the 16 non-syntenic markers, there were eight markers mapped on both linkage maps with consistent chromosome assignments. For example, two markers were mapped genetically on chromosome 2, while they were physically placed on chromosomes 1 and 3. Further comparative analysis was conducted to determine colinearity within chromo-somes. The two linkage maps revealed conserved marker order with the physical map for most regions of the genome, with chromosomes 4, 5, 8, and 11 having a very high level of colinearity (Figure 2 and Figure 3). A number of markers assigned to chromosomes 3, 10 and 12 in both linkage maps were not colinear with the physical map.
The meiotic recombination rate within each chromosome was estimated based on the 5,280 SNP markers with conserved chromosome assignments between genetic and physical maps. High recombination was found on the distal regions across all 12 chromosomes in both linkage maps, while recombination was suppressed in large regions that are most likely pericentromeric (Figure 3). The linkage maps also revealed similar patterns of variation in recombination rate between chromosomes. However, recombination rates appeared to be higher in the EXPEN 2012 map relative to the EXPIM 2012 map on chromosomes 2, 4, 5, 6, 9, 10, and 12, while the EXPIM 2012 population showed higher levels of recombination on chromosomes 1 and 7 (Figure 3). On chromosome 8, the overall rate of recombination appears similar, though the rate within each arm appears to differ between the two populations. These results are consistent with the results of the iterative mapping, described above. In addition, there was suppression of recombination specific to the EXPEN 2012 map on chromosome 1 (70–75 Mbp), chromosome 6 (36–38 Mbp), chromosome 7 (0–2 Mbp and 58–60 Mbp), and chromosome 8 (0–2 Mbp) (Figure 3). A recombination suppression specific to the EXPIM 2012 map was found on the region spanning 0–4 Mbp on chromosome 9.
Discussion
The array with 7,720 scorable SNPs provides a valuable tool for high-throughput and cost-effective genotyping and mapping in tomato. The SNPs used for the array were derived from a computational pipeline based on cDNA sequences from six accessions including four representatives of large-fruited cultivated tomato, a cherry tomato and a closely related wild relative [22]. The array was optimized based on polymorphic SNP markers within cultivated lineages, allele frequency and genome coverage. In addition, 501 functional SNPs on the array were derived from candidate genes for traits such as disease resistance and carotenoid biosynthesis.
SNP Array-Based Genetic Mapping in Tomato
Given the physical length of chromosome 1 (largest chromo-some), the number of markers is lower than expected while the number of markers on chromosome 11 is higher than expected. This distribution is not due to a lack of or excess of genes on these chromosomes but is likely due to the process of SNP marker selection. Alternatively, the distribution may reflect the introgres-sion of highly polymorphic regions (e.g. containing disease resistance loci such as the I2 Fusariumresistance gene or the Rx-4andXv3bacterial spot resistance genes on chromosome 11) that have created an ascertainment bias.
Despite the SNP selection for cultivated populations and the observed over- and under-representation, the SNP array provides a powerful resource for genetic map construction in interspecific populations. The EXPEN 2000 population has been used in the last ten years as a reference mapping population in tomato and 2,506 markers have been previously mapped (http://solgenomics. net) [31,32]. With the SNP array, we mapped 3,503 SNP markers to this population. We also generated the EXPEN 2012 map for the S. lycopersicum Moneymaker x S. pennelliiLA0716 population with 3,687 markers and the EXPIM 2012 map for the S. lycopersicum Moneymaker x S. pimpinellifolium LA0121 population with 4,491 markers. In total, we genetically positioned 5,621 SNP markers including common sets of 2,509–3,149 markers between the linkage maps.
The length of the genetic maps derived from the two EXPEN (S. lycopersicum x S. pennellii) populations differed from each other with the EXPEN 2000-SNP map length estimated to be 1,670 cM and the EXPEN 2012 map length as 1,155 cM. We investigated whether a possible reason for the differences in map length could be differential distortion due to gametic phase selection. If such distortion occurred in favor of LA0716 alleles on one portion of the chromosome and in favor of cultivated alleles on another, recombination would be overestimated in the progeny. Although the EXPEN 2000-SNP map showed a number of distorted markers on several chromosomes including chromosome 1 where genes affecting self and unilateral incompatibility are located [33], there was no correlation between segregation distortion and map
expansion. Through the iterative analysis of marker subsets, we showed that the difference in genetic length between the two EXPEN maps was most likely due to the effect of scoring or ordering mistakes being amplified due to the small size the EXPEN 2000 population. Nevertheless both EXPEN maps are larger in terms of cM than the map from the EXPIM (S. lycopersicumxS. pimpinellifolium) population, and these differences were significant based on iterative estimates of map length. We expected that a genetic map generated from two more closely related parents would display a generally higher level of recombination. Our observation of greater map distance in the EXPEN populations is even more surprising given the likely existence of several small inversions betweenS. lycopersicumandS. pennelliiwhich suppress recombination in these regions. Compar-ing the EXPEN 2012 and EXPIM 2012 maps suggests that there could be regions on chromosomes 1, 3, 6, 7, and 9 where small inversions differentiate LA0716 and LA0121. A paracentric inversion on the distal end of chromosome 7 was previously reported inS. pennelliiLA0716 relative toS. pimpinellifoliumLA1589 [34]. Further, cytogenetic analysis revealed that interspecific crosses betweenS. lycopersicumandS. pennelliican lead to changes in chromosome structure presumably due to inversions and translocations [35].
High-resolution genetic mapping with a large number of markers has helped to improve genome sequence assemblies in plants [25]. Comparison of genetic positions with physical positions provides an independent validation of reference genome sequence assembly. Most regions of the EXPEN 2012 and EXPIM 2012 linkage maps were fully colinear with the current assembly of the tomato reference sequence, suggesting a very good quality of the assembly. Sixteen markers with inconsistent chromosome assignment between genetic and physical maps were observed. Among them, eight markers had consistent chromosome assign-ments between the EXPEN 2012 and EXPIM 2012 maps, suggesting that the physical position may be incorrect or that the sequences are duplicated in the genome. Thus, the high-density genetic maps provide a guide to improve the assembly of genome Table 2.Colinearity between common markers for the three linkage maps.
EXPEN 2000 vs. EXPEN 2012 EXPEN 2000 vs. EXPIM 2012 EXPEN 2012 vs. EXPIM 2012
Chr
No. Common Marker
Coefficient of Colinearity1
No. Common Marker
Coefficient of Colinearity
No. Common Marker
Coefficient of Colinearity
1 216 1.00 184 0.99 226 0.99
2 377 1.00 308 0.99 328 0.99
3 280 0.96 213 0.85 227 0.99
4 341 1.00 306 0.99 361 1.00
5 349 1.00 287 0.99 313 1.00
6 340 1.00 196 0.98 222 0.99
7 203 0.98 168 0.95 194 0.99
8 163 1.00 135 0.99 165 0.99
9 184 0.97 120 0.91 138 0.98
10 153 0.99 125 0.98 147 1.00
11 413 0.97 361 0.92 387 1.00
12 130 0.99 106 0.97 133 0.99
Total 3,149 0.99 2,509 0.96 2,841 1.00
1Colinearity within each chromosome was assessed using common markers. The markers were ranked based on their map positions and the rank order was used for regression analysis, and expressed as R2.
SNP Array-Based Genetic Mapping in Tomato
sequence data. The genetic mapping of markers that are not present in the reference genome sequences can also improve the current genome assembly.
The comparisons between genetic and physical distances with several thousand markers reveal that there are similar patterns of variation in recombination rates along the tomato chromosomes. Strong recombination suppression occurs in the large pericen-tromeric regions within each chromosome. These regions repre-sent repeat-rich and gene-poor heterochromatin encompassing 77% of the tomato genome [28,36]. Such recombination suppression has been noted before for tomato and is also found in many other plant species [25,37,38] albeit often not as pronounced as in tomato.
With the availability of complete genome sequences, there is a tendency for genetic mapping to be relegated to a position of secondary importance. However, trait discovery, functional characterization, and crop improvement are largely dependent on recombination. Therefore, the construction of genetic maps which maximize the amount of recombination remains an essential tool in plant biology and plant breeding for precise and cost-efficient localization of traits and the generation of specific recombination events adjacent to interesting genes. Our data suggest that different crosses could reveal different general and location-specific levels of recombination, and that these differences are not necessarily related to the genetic distance between parents. The SNP array and high-density genetic maps developed in this study will be useful in population level analysis of germplasm collections representing different market classes of cultivated tomato, regionally adapted populations and wild relatives. Other applications of the resource include genome-wide association mapping with high resolution and marker-assisted selection (MAS) for tomato breeding. For association mapping, accounting for
population structure and/or familial relatedness is often necessary to avoid spurious marker-trait associations [39]. Large sets of genome-wide SNP markers will help to precisely estimate the relatedness and capture effects of quantitative trait loci (QTL). Association mapping has the potential to increase the efficiency of MAS by identifying markers tightly linked to traits of interest in germplasm panels that are directly relevant to plant breeders. In addition, the SNP array may facilitate genomic selection (GS) for plant breeding. As first suggested in animal improvement, GS seeks to predict the breeding value of individuals using markers distributed across the genome [40]. With the advent of high-throughput and cost-effective genotyping methods, GS is showing promise for improving complex traits in plant populations [41– 43]. In summary, the SNP array provides a survey tool for the tomato research community and creates new opportunities for innovative strategies in both basic research and applied breeding.
Materials and Methods
Plant Material
For genetic mapping, we used 79 F2progeny from the EXPEN 2000 population S. lycopersicum (LA0925) x S. pennellii (LA0716) which was previously published [31,32]. To distinguish the new SNP map from the EXPEN 2000 reference map, we referred to the map described here as EXPEN 2000-SNP. The two other mapping populations were generated by TraitGenetics with the EXPEN 2012 consisting of 160 F2progeny from aS. lycopersicum Moneymaker xS. pennellii(LA0716) cross and the EXPIM 2012 population of 183 F2 progeny derived from Moneymaker x S.
pimpinellifolium(LA0121) [44]. The availableS. pennellii introgres-sion lines in the M82 background [29] were also used to compare marker assignment with the EXPEN SNP maps.
SNP Array Development
SNPs for the array were selected based on a multi-tier strategy that was optimized for polymorphisms within and among cultivated types. Briefly, SNP discovery was based on the Genome Analyzer II-derived transcriptome sequences of four cultivated tomato accessions (NC84173, Fla.7600, OH08-6405, and OH9242), anS. lycopersicum var.cerasiformeaccession (PI 114490), and an S. pimpinellifoliumaccession (PI 128216) [22]. SNPs were filtered such that any SNP within 50 bp of an intron/exon junction was removed and SNPs within 50 bp of a second polymorphism were excluded. The frequency of SNP occurrence among the six sequenced accessions was then assessed, with SNPs preferentially chosen based on their occurrence in multiple accessions. Genome coverage was assessed, and additional SNPs were selected to improve spacing across the genome. The research community provided a set of candidate genes of interest and 567 SNPs in the high confidence SNP set were located in these genes. Finally, SNPs were cross-validated with data sets from TraitGe-netics, INRA, and previously published SNPs [26,27]. We included 1,470 validated SNPs from these data sets on the array. A total of 8,784 SNPs detected with 10,000 probes were used to design the array (Table S1).
Genotyping
Genomic DNA was isolated from fresh, young leaf tissue using a modified CTAB method [45]. Original DNA for the 75 F2 individuals of the EXPEN 2000 population was provided by Figure 1. Regression of marker order between the EXPEN 2012 and EXPIM 2012 linkage maps.The 2,841 SNP markers common to both maps were ranked based on their map positions within chromosomes for each map and the rank orders were used for regression analysis. doi:10.1371/journal.pone.0040563.g001
Table 3.Physical coverage of 7,666 SNP markers.
Marker Interval (Mbp) Chr No. Marker Coverage (Mbp) Maximum Average
1 554 90.13 7.36 0.17
2 871 49.48 3.83 0.06
3 679 64.70 4.38 0.10
4 861 64.01 2.03 0.08
5 783 64.91 2.70 0.09
6 748 45.88 2.66 0.06
7 443 64.98 3.93 0.15
8 396 62.97 2.95 0.16
9 473 67.60 4.52 0.15
10 405 64.74 3.17 0.16
11 1,059 53.28 2.37 0.05
12 394 65.32 4.73 0.17
Total 7,666 758.00 0.12
Steven Tanksley (Cornell University, Ithaca, New York, USA) We also obtained DNA from theS. pennelliiintrogression lines in the M82 background from Dani Zamir (Hebrew University, Rehovot, Israel). Genotyping with the array was performed according to the manufacturer’s instructions for Illumina Infinium assay. The resulting intensity data was processed using the genotyping module v1.7.4 of the GenomeStudio software (Illumina Inc., San Diego, CA, USA) for SNP calling. In order to determine SNP genotype, a cluster file developed by TraitGenetics based on 92 hybrids facilitated allele calling in the Genome Studio software.
Genetic and Physical Mapping
Three different software packages were used for mapping of the markers: JoinMap 4.0 [46], Map Manager QTXb20 [47], and MapChart 2.2 [48]. First, the genotyping data were transformed into the respective mapping data format (‘‘ABH’’, A = genotype parent 1, B = genotype parent 2, H = heterozy-gous). Subsequently, the JoinMap 4.0 program was used for verification of the segregation patterns, the formation of linkage groups and the preliminary positioning of the markers on
chromosomes using the default grouping settings and the maximum likelihood mapping algorithm.
The final map position of the markers and the genetic distances between the markers were further optimized manually with respect to the number of crossovers (as low as possible) and the length of the linkage group (as short as possible) using the ABH mapping data file in Excel and MapManager QTX (settings: linkage evaluation F2intercross, search linkage criterionP= 0.05, map function Kosambi, cross type line cross). The final map was drawn using MapChart 2.2.
In order to compare maps, an iterative approach was used in which at least 60 independent maps were created for each of the three populations. For each iteration, 217–325 markers were chosen based on a filter for 5 cM separation (determined by initial mapping). Map construction followed the steps described above, and comparisons between total map length and individual chromosome lengths were based on Analysis of Variance.
We determined the physical map position of the SNPs based on the flanking sequences used to develop the high-density Infinium array. These sequences were oriented relative to the genome sequence using the automated batch BLAST feature to search the Figure 2. Comparative analysis of the EXPEN 2012 and EXPIM 2012 genetic maps relative to the draft assembly (v SL2.40;http:// solgenomics.net/organism/Solanum_lycopersicum/genome) of the tomato reference genome sequence.
doi:10.1371/journal.pone.0040563.g002
SNP Array-Based Genetic Mapping in Tomato
Tomato WGS chromosome (v SL2.40; http://solgenomics.net/ organism/Solanum_lycopersicum/genome) [30]. For a SNP with multiple BLAST hits, the best match was used to infer a map position. A custom Python script was then used to identify the actual SNP positions relative to the SL 2.40 genome sequence. We first calculated the 59flanking sequence length for each SNP. The script determined sequence orientation based on start and end positional information, and the SNP position was determined by adding or subtracting, depending on sequence orientation, the length of the flanking sequence to the corresponding subject start position. The accuracy of SNP positions was manually verified using a subset of data.
Supporting Information
Table S1 8,784 SNPs used for array development in this study.
(XLSX)
Table S2 3,503 SNP markers in the EXPEN 2000 (LA0925 x LA0716) linkage map and their assignment on the introgression line population ofS. pennellii(IL).
(XLSX)
Table S3 3,687 SNP markers in the EXPEN 2012 (Moneymaker x LA0716) linkage map.
(XLSX)
Table S4 4,491 SNP markers in the EXPIM 2012 (Moneymaker x LA0121) linkage map.
(XLSX)
Table S5 3,149 SNP markers mapped on both the EXPEN 2000 and EXPEN 2012 linkage maps.
(XLSX)
Table S6 2,509 SNP markers mapped on both the EXPEN 2000 and EXPIM 2012 linkage maps.
(XLSX)
Table S7 2,841 SNP markers mapped on both the EXPEN 2012 and EXPIM 2012 linkage maps.
(XLSX)
Table S8 5,295 SNP markers with both genetic and physical positions.
(XLSX)
Acknowledgments
We would like to thank Cindy Lawley of Illumina Inc. for her coordination of the Tomato SNP array Consortium. We also thank internal reviewers at The Ohio State University, OARDC for comments and helpful suggestions on the manuscript. TraitGenetics acknowledges the excellent technical assistance of Sandra Reis and Steffie Wehle. For the INRA SNPs, Gautier Sarah and Jean Paul Bouchet are acknowledged for bioinformatic analyses and Ste´phane Munos, Nicolas Ranc, Sylvain Santoni and Laure Sene´ for production of sequences.
Author Contributions
Conceived and designed the experiments: SCS MWG AVD CRB DMF. Performed the experiments: SCS GD JP RW JPH. Analyzed the data: SCS GD JP RW JPH DMF. Contributed reagents/materials/analysis tools: MC SW. Wrote the paper: SCS MWG DMF.
References
1. Martin GB, Brommonschenkel SH, Chunwongse J, Frary A, Ganal MW, et al. (1993) Map-based cloning of a protein kinase gene conferring disease resistance in tomato. Science 262: 1432–1436.
2. Jones DA, Thomas CM, Hammondkosack KE, Balintkurti PJ, Jones JDG (1994) Isolation of the tomato Cf-9 gene for resistance to Cladosporium fulvum by transposon tagging. Science 266: 789–793.
3. Kawchuk LM, Hachey J, Lynch DR, Kulcsar F, van Rooijen G, et al. (2001) TomatoVedisease resistance genes encode cell surface-like receptors. Proc Natl Acad Sci U S A 98: 6511–6515.
4. Milligan SB, Bodeau J, Yaghoobi J, Kaloshian I, Zabel P, et al. (1998) The root knot nematode resistance geneMifrom tomato is a member of the leucine zipper, nucleotide binding, leucine-rich repeat family of plant genes. Plant Cell 10: 1307–1319.
5. Pnueli L, CarmelGoren L, Hareven D, Gutfinger T, Alvarez J, et al. (1998) The SELF-PRUNINGgene of tomato regulates vegetative to reproductive switching of sympodial meristems and is the ortholog ofCENandTFL1. Development 125: 1979–1989.
6. Xiao H, Jiang N, Schaffner E, Stockinger EJ, van der Knaap E (2008) A retrotransposon-mediated gene duplication underlies morphological variation of tomato fruit. Science 319: 1527–1530.
7. Ronen G, Carmel-Goren L, Zamir D, Hirschberg J (2000) An alternative pathway to beta-carotene formation in plant chromoplasts discovered by map-based cloning of Beta and old-gold color mutations in tomato. Proc Natl Acad Sci U S A 97: 11102–11107.
8. Tanksley SD, Ganal MW, Prince JP, Devicente MC, Bonierbale MW, et al. (1992) High-density molecular linkage maps of the tomato and potato genomes. Genetics 132: 1141–1160.
9. Shirasawa K, Isobe S, Hirakawa H, Asamizu E, Fukuoka H, et al. (2010) SNP Discovery and Linkage Map Construction in Cultivated Tomato. DNA Research 17: 381–391.
10. Robbins MD, Sim S, Yang W, Van Deynze A, van der Knaap E, et al. (2011) Mapping and linkage disequilibrium analysis with a genome-wide collection of SNPs that detect polymorphism in cultivated tomato. Journal of experimental botany 62: 1831–1845.
11. Shendure J, Ji H (2008) Next-generation DNA sequencing. Nat Biotechnol 26: 1135–1145.
12. Deschamps S, Campbell MA (2010) Utilization of next-generation sequencing platforms in plant genomics and genetic variant discovery. Mol Breed 25: 553– 570.
13. Davey JW, Hohenlohe PA, Etter PD, Boone JQ, Catchen JM, et al. (2011) Genome-wide genetic marker discovery and genotyping using next-generation sequencing. Nature Reviews Genetics 12: 499–510.
14. McNally KL, Childs KL, Bohnert R, Davidson RM, Zhao K, et al. (2009) Genomewide SNP variation reveals relationships among landraces and modern varieties of rice. Proc Natl Acad Sci U S A 106: 12273–12278.
15. Yamamoto T, Nagasaki H, Yonemaru J, Ebana K, Nakajima M, et al. (2010) Fine definition of the pedigree haplotypes of closely related rice cultivars by means of genome-wide discovery of single-nucleotide polymorphisms. BMC Genomics 11: 267.
16. Barbazuk WB, Emrich SJ, Chen HD, Li L, Schnable PS (2007) SNP discovery via 454 transcriptome sequencing. Plant J 51: 910–918.
17. Trebbi D, Maccaferri M, de Heer P, Sorensen A, Giuliani S, et al. (2011) High-throughput SNP discovery and genotyping in durum wheat (Triticum durum Desf.). Theor Appl Genet 123: 555–569.
18. Bundock PC, Eliott FG, Ablett G, Benson AD, Casu RE, et al. (2009) Targeted single nucleotide polymorphism (SNP) discovery in a highly polyploid plant species using 454 sequencing. Plant Biotechnol J 7: 347–354.
19. Hyten DL, Cannon SB, Song QJ, Weeks N, Fickus EW, et al. (2010) High-throughput SNP discovery through deep resequencing of a reduced represen-tation library to anchor and orient scaffolds in the soybean whole genome sequence. BMC Genomics 11: 38.
20. Kim MY, Lee S, Van K, Kim TH, Jeong SC, et al. (2010) Whole-genome sequencing and intensive analysis of the undomesticated soybean (Glycine soja Sieb. and Zucc.) genome. Proc Natl Acad Sci U S A 107: 22032–22037. 21. Hamilton JP, Hansey CN, Whitty BR, Stoffel K, Massa AN, et al. (2011) Single
nucleotide polymorphism discovery in elite north american potato germplasm. BMC Genomics 12: 12.
22. Hamilton JP, Sim S, Stoffel K, Van Deynze A, Buell CR, et al. (2012) Single nucleotide polymorphism discovery in cultivated tomato via sequencing by synthesis. The Plant Genome 5: 17–29.
23. Steemers FJ, Chang WH, Lee G, Barker DL, Shen R, et al. (2006) Whole-genome genotyping with the single-base extension assay. Nat Methods 3: 31–33.
Figure 3. Relationship between genetic and physical positions within each chromosome.The genetic positions of SNP markers are indicated by red circles for the EXPEN 2012 population and blue triangles for the EXPIM 2012 population.
doi:10.1371/journal.pone.0040563.g003
SNP Array-Based Genetic Mapping in Tomato
24. Gupta PK, Rustgi S, Mir RR (2008) Array-based high-throughput DNA markers for crop improvement. Heredity 101: 5–18.
25. Ganal MW, Durstewitz G, Polley A, Berard A, Buckler ES, et al. (2011) A large maize (Zea mays L.) SNP genotyping array: development and germplasm genotyping, and genetic mapping to compare with the B73 reference genome. PLoS ONE 6: e28334.
26. Van Deynze A, Stoffel K, Buell CR, Kozik A, Liu J, et al. (2007) Diversity in conserved genes in tomato. BMC Genomics 8: 465.
27. Sim SC, Robbins MD, Chilcott C, Zhu T, Francis DM (2009) Oligonucleotide array discovery of polymorphisms in cultivated tomato (Solanum lycopersicumL.) reveals patterns of SNP variation associated with breeding. BMC Genomics 10: 10.
28. Sherman JD, Stack SM (1992) Two-dimensional spreads of synaptonemal complexes from solanaceous plants.5. Tomato (Lycopersicon esculentum) karyotype and idiogram. Genome 35: 354–359.
29. Eshed Y, Zamir D (1995) An introgression line population ofLycopersicon pennellii in the cultivated tomato enables the identification and fine mapping of yield-associated QTL. Genetics 141: 1147–1162.
30. The Tomato Genome Consortium (2012) The tomato genome sequence provides insights into fleshy fruit evolution. Nature 485: 635–641.
31. Fulton TM, Van der Hoeven R, Eannetta NT, Tanksley SD (2002) Identification, analysis, and utilization of conserved ortholog set markers for comparative genomics in higher plants. Plant Cell 14: 1457–1467.
32. Frary A, Xu YM, Liu JP, Mitchell S, Tedeschi E, et al. (2005) Development of a set of PCR-based anchor markers encompassing the tomato genome and evaluation of their usefulness for genetics and breeding experiments. Theor Appl Genet 111: 291–312.
33. Chetelat RT, Deverna JW (1991) Expression of unilateral incompatibility in pollen ofLycopersicon pennelliiis determined by major loci on chromosomes 1, 6 and 10. Theor Appl Genet 82: 704–712.
34. van der Knaap E, Sanyal A, Jackson SA, Tanksley SD (2004) High-resolution fine mapping and fluorescence in situ hybridization analysis of sun, a locus controlling tomato fruit shape, reveals a region of the tomato genome prone to DNA rearrangements. Genetics 168: 2127–2140.
35. Anderson LK, Covey PA, Larsen LR, Bedinger P, Stack SM (2010) Structural differences in chromosomes distinguish species in the tomato clade. Cytogenet Genome Res 129: 24–34.
36. Stack SM, Royer SM, Shearer LA, Chang SB, Giovannoni JJ, et al. (2009) Role of Fluorescence in situ Hybridization in Sequencing the Tomato Genome. Cytogenet Genome Res 124: 339–350.
37. Frary A, Presting GG, Tanksley SD (1996) Molecular mapping of the centromeres of tomato chromosomes 7 and 9. Mol Gen Genet 250: 295–304. 38. Wenzl P, Li HB, Carling J, Zhou MX, Raman H, et al. (2006) A high-density
consensus map of barley linking DArT markers to SSR, RFLP and STS loci and agricultural traits. BMC Genomics 7: 206.
39. Yu J, Pressoir G, Briggs WH, Vroh Bi I, Yamasaki M, et al. (2006) A unified mixed-model method for association mapping that accounts for multiple levels of relatedness. Nat Genet 38: 203–208.
40. Meuwissen THE, Hayes BJ, Goddard ME (2001) Prediction of total genetic value using genome-wide dense marker maps. Genetics 157: 1819–1829. 41. Asoro FG, Newell MA, Beavis WD, Scott MP, Jannink JL (2011) Accuracy and
Training Population Design for Genomic Selection on Quantitative Traits in Elite North American Oats. The Plant Genome 4: 132–144.
42. Heffner EL, Jannink JL, Iwata H, Souza E, Sorrells ME (2011) Genomic Selection Accuracy for Grain Quality Traits in Biparental Wheat Populations. Crop Sci 51: 2597–2606.
43. Zhao Y, Gowda M, Liu W, Wu¨rschum T, Maurer HP, et al. (2012) Accuracy of genomic selection in European maize elite breeding populations. Theor Appl Genet 124: 769–776.
44. Ernst K, Kumar A, Kriseleit D, Kloos DU, Phillips MS, et al. (2002) The broad-spectrum potato cyst nematode resistance gene (Hero) from tomato is the only member of a large gene family of NBS-LRR genes with an unusual amino acid repeat in the LRR region. Plant J 31: 127–136.
45. Kabelka E, Franchino B, Francis DM (2002) Two loci fromLycopersicon hirsutum LA407 confer resistance to strains ofClavibacter michiganensissubsp.michiganensis. Phytopathology 92: 504–510.
46. Van Ooijen JW (2006) JoinMapH4.0, Software for the calculation of genetic linkage maps in experimental populations. Kyazma B.V., Wageningen, Netherlands.
47. Manly KF, Cudmore RH Jr, Meer JM (2001) Map Manager QTX, cross-platform software for genetic mapping. Mamm Genome 12: 930–932. 48. Voorrips RE (2002) MapChart: software for the graphical presentation of