www.ann-geophys.net/27/3387/2009/
© Author(s) 2009. This work is distributed under the Creative Commons Attribution 3.0 License.
Annales
Geophysicae
Vertical and interhemispheric links in the stratosphere-mesosphere
as revealed by the day-to-day variability of Aura-MLS temperature
data
X. Xu1, A. H. Manson1, C. E. Meek1, T. Chshyolkova1, J. R. Drummond2, C. M. Hall3, D. M. Riggin4, and R. E. Hibbins5
1Institute of Space and Atmospheric Studies, University of Saskatchewan, Saskatoon, Canada 2Physics and Atmospheric Science Department, University of Dalhousie, Halifax, Canada 3Tromsø Geophysical Observatory, University of Tromsø, Tromsø, Norway
4Colorado Research Associates, Boulder, USA 5British Antarctic Survey, Cambridge, UK
Received: 26 February 2009 – Revised: 20 August 2009 – Accepted: 24 August 2009 – Published: 1 September 2009
Abstract. The coupling processes in the middle atmo-sphere have been a subject of intense research activity be-cause of their effects on atmospheric circulation, structure, variability, and the distribution of chemical constituents. In this study, the day-to-day variability of Aura-MLS (Mi-crowave Limb Sounder) temperature data are used to reveal the vertical and interhemispheric coupling processes in the stratosphere-mesosphere during four Northern Hemisphere winters (2004/2005–2007/2008). The UKMO (United King-dom Meteorological Office) assimilated data and meso-spheric winds from MF (medium frequency) radars are also applied to help highlight the coupling processes.
In this study, a clear vertical link can be seen between the stratosphere and mesosphere during winter months. The coolings and reversals of northward meridional winds in the polar winter mesosphere are often observed in relation to warming events (Sudden Stratospheric Warming, SSW for short) and the associated changes in zonal winds in the polar winter stratosphere. An upper-mesospheric cooling usually precedes the beginning of the warming in the stratosphere by 1–2 days.
Inter-hemispheric coupling has been identified initially by a correlation analysis using the year-to-year monthly zonal mean temperature. Then the correlation analyses are per-formed based upon the daily zonal mean temperature. From the original time sequences, significant positive (negative) correlations are generally found between zonal mean temper-atures at the Antarctic summer mesopause and in the
Arc-Correspondence to:X. Xu ([email protected])
tic winter stratosphere (mesosphere) during northern mid-winters, although these correlations are dominated by the low frequency variability (i.e. the seasonal trend). Using the short-term oscillations (less than 15 days), the statisti-cal result, by looking for the largest magnitude of correla-tion within a range of time-lags (0 to 10 days; positive lags mean that the Antarctic summer mesopause is lagging), indi-cates that the temporal variability of zonal mean temperature at the Antarctic summer mesopause is also positively (neg-atively) correlated with the polar winter stratosphere (meso-sphere) during three (2004/2005, 2005/2006, and 2007/2008) out of the four winters. The highest value of the corre-lation coefficient is over 0.7 in the winter-stratosphere for the three winters. The remaining winter (2006/2007) has more complex correlations structures; correspondingly the polar vortex was distinguished this winter. The time-lags obtained for 2004/2005 and 2006/2007 are distinct from 2005/2006 and 2007/2008 where a 6-day lag dominates for the coupling between the winter stratosphere and the sum-mer mesopause. The correlations are also provided using temperatures in northern longitudinal sectors in a compari-son with the Antarctic-mesopause zonal mean temperature. For northern mid-high latitudes (∼50–70◦N), temperatures in Scandinavia-Eastern Europe and in the Pacific-Western Canada longitudinal sectors often have opposite signs of cor-relations with zonal mean temperatures near the Antarctic summer mesopause during northern mid-winters. The sta-tistical results are shown to be associated with the Northern Hemisphere’s polar vortex characteristics.
1 Introduction
A pole-to-pole atmospheric circulation can be driven by the dissipation of gravity waves (e.g. Fritts and Alexan-der, 2003). During the stratospherically undisturbed winter months in either hemisphere, the summer-to-winter merid-ional circulation leads to a warm winter mesopause and a cold summer mesopause (e.g. Manson et al., 2002). The latter provides opportunities for noctilucent clouds (NLC) or polar mesospheric clouds, and polar mesospheric sum-mer echoes. During sudden stratospheric warmings (SSW), which are defined as mid-winter events almost exclusively occurring in the Northern Hemisphere, variability and even reversal of this meridional flow may occur (e.g. Becker and Fritts, 2006), associated with major changes in planetary wave (PW) and gravity wave (GW) activities in both hemi-spheres. A SSW may be major or minor: briefly, “major” if, at 10 hPa or below, the latitudinal mean temperature in-creases poleward from 60 degrees latitude and an associated zonal mean wind reversal occurs (eastward to westward); “minor” if the warming event is regional, the polar vortex is less disturbed and the wind reversal is less extensive in longitude and latitude. We also use the abbreviation MMW, standing for Major Mid-winter Warming. For clarification, note that a MMW is a major SSW while a SSW might be major or minor.
There is growing evidence in recent years that the Arc-tic atmosphere is linked dynamically and thence chemically with the Antarctic atmosphere. Modeling studies such as those by Becker et al. (2004) and Becker and Fritts (2006) addressed how gravity waves could have driven an interhemi-spheric coupling in the mesosphere and lower thermosphere (MLT) during the MaCWAVE/MIDAS northern summer pro-gram of 2002. They linked several anomalies observed in the Northern Hemisphere (NH) polar summer MLT during 2002 to unusually high planetary wave activity in the South-ern Hemisphere (SH) winter. This was a historically unique SH winter (e.g. Chshyolkova et al., 2006), since a major SSW occurred. Karlsson et al. (2007) found a strong anti-correlation between winter stratospheric temperatures and summer mesospheric NLC occurrences based on the year-to-year variability of the monthly means over 5 years. Such an interhemispheric link was also reproduced by the use of temperature simulations from the extended Canadian Middle Atmosphere Model (CMAM) (Karlsson et al., 2009). Both of these studies confirmed that the source for an anoma-lous stratosphere e.g. one having a warmer monthly temper-ature than average in a given year, is the enhanced plane-tary wave flux entering the winter stratosphere; but following that an anomaly in gravity-wave drag arises, through chang-ing wind-filterchang-ing conditions, leadchang-ing to an anomalously cool month in the winter mesopause region. The meridional winds between the polar-regions are therefore weakened or reversed, resulting in relative warming of the summer polar mesopause.
Interhemispheric propagation of PWs is also possible. Chshyolkova et al. (2006) noted that with favourable con-ditions, PWs with ∼10-, 16- and 25-day periods can pen-etrate to the opposite hemisphere at stratospheric heights and further propagate upward to mesospheric heights during equinoxes. This has also been supported by modeling studies (Forbes et al., 1995; Miyoshi, 1999) which showed that a tie exists between the two hemispheres.
Some attention has been paid to the interhemispheric sta-tionary planetary wave (SPW)-tidal connections recently. These studies were incited by the report that the nonlinear in-teractions between the migrating semidiurnal tide (s=2) and the SPW (S=1) could produce the nonmigrating semidiur-nal tide (e.g. Angelats i Coll and Forbes, 2002). Baumgaert-ner et al. (2005) compared the seasonal sequences of plan-etary wave amplitudes with amplitudes of the semidiurnal tide at Scott Base (78◦S, 167◦E) and pointed out that plan-etary waves in both the SH and NH are partly responsible for the seasonal variability of the SH semidiurnal tide via the generation of a s=1 semidiurnal tide. Based on observations at Scott Base and at Halley (76◦S, 26◦W), Baumgaertner et al. (2006) further showed that the amplitudes of the non-migrating semidiurnal tide (s=1) were positively correlated with the NH SPW near 1 hPa during the SH summer months, but also with the SH SPW near 10 hPa during SH winter. Most recently, Smith et al. (2007) provided evidence for a correlation between variability of the mesospheric semidiur-nal tide in the NH and the quasi-stationary planetary wave (S=1) in the SH stratosphere during NH summer and fall. Their interpretation is that the SPW in the SH interacts with the global semidiurnal migrating tide and produces nonmi-grating semidiurnal tides that vary in time in concert with the SH planetary wave. Smith et al. (2007) used the semidiurnal tidal data only at Esrange (68◦N, 21◦E). However, longitu-dinal and latitulongitu-dinal variations in the tidal (24-h and 12-h) amplitudes and phases are present in most cases (e.g. Man-son et al., 2002). In addition, the low and high frequency processes, or in other words seasonal trends and the shorter time-scale oscillations respectively, were not distinguished in these correlation studies. Therefore, additional work is necessary for a better understanding of the interhemispheric SPW-tidal coupling processes. This is the subject of scrutiny in another paper by the present authors (Xu et al., 2009).
the polar vortex in the NH and the associated minor and ma-jor warmings in the stratosphere (e.g. Manson et al., 2008). The objective of this study is to identify the response of the summer Antarctic mesospheric temperature to disturbances at the mid-winter Arctic stratospheric altitudes. The winter stratospheric disturbances often have durations of only a few days, so that several events can occur within a given month. Therefore, the day-to-day variability can potentially reveal the summer mesosphere-response of the winter stratospheric polar vortex and warming events better than the year-to-year monthly mean (e.g. Karlsson et al., 2007, 2009).
This study also looks at the local mesosphere-responses to the winter stratospheric disturbances since intra-hemispheric stratosphere-mesosphere connection (i.e. spatially varying vertical connection) is often the foundation of interhemi-spheric stratosphere-mesosphere linkage. The vertical con-nection has been widely studied (e.g. Jacobi et al., 1997, 2003; Walterscheid et al., 2000; Hoffmann et al., 2002; Chshyolkova et al., 2005; Dowdy et al., 2007; Manson et al., 2008), but will be highlighted by the use of the larger observational dataset in this work.
This work is based on the day-to-day variability of tem-perature measurements by Aura-MLS covering the win-ters 2004/2005–2007/2008 and supplemented by the UKMO (also called MetO) assimilated data as well as mesospheric winds from MF radars. Section 2 will briefly describe the dataset. In Sect. 3 the winter characteristics and vertical cou-pling will be addressed. Section 4 will focus on the inter-hemispheric coupling. Finally a discussion and summary will be made in Sect. 5.
2 Data
The data used in this work are from the same sources as those in Chshyolkova et al. (2007), so only brief descriptions are made here. More information on the data can be found in Chshyolkova et al. (2007) and references therein.
2.1 Aura-MLS temperature
The temperatures used here are version 2.2 data by the Mi-crowave Limb Sounder (MLS) on board the National Aero-nautic and Space Administration (NASA) Aura satellite. The Aura satellite is sun synchronous with∼90 min orbital pe-riod. The daily data are available starting in August 2004 and have latitude coverage from 82◦S to 82◦N. The useful altitude range is 316–0.001 hPa (∼8–97 km) with precision ranging from 0.6 K in the lower stratosphere to 2.5 K in the mesosphere and approximately 3 to 6 km steps depending on height. In this paper, zonal mean temperature and tempera-ture planetary waves (PW) are constructed in latitude bands with 5◦width. In order to investigate longitudinal difference in correlation plots, the data are also further sorted into lon-gitude sectors of 20◦. The daily temperature is obtained by
averaging over a 3-day window which is stepped by 1-day interval. We can expect some aliasing effects on the zonal mean temperatures from the migrating tides. However, note that since Aura is in a sun synchronous orbit, its samples are stationary with respect to migrating tides. These should appear as constant offsets to the measurements at a particu-lar latitude. If the means are subtracted, the migrating tides theoretically should be removed. Therefore, the aliasing ef-fect on the correlation result is negligible. In addition, in the stratosphere and lower mesosphere, the tides are usually weak so the tidal contamination is also weak.
2.2 UKMO data
The UKMO (United Kingdom Meteorological Office, also known as MetO) data are the result of assimilation of op-erational meteorological measurements from satellites, ra-diosondes and aircrafts into a numerical forecasting model of the stratosphere and troposphere. The UKMO data have been widely used to describe the state of the stratosphere (e.g. O’Neill et al., 1994; Chshyolkova et al., 2005, 2006, 2007; Manson et al., 2008). In this paper, we use UKMO temper-atures and horizontal wind components to describe the state of winter stratospheric circulation and polar vortex.
2.3 MF radar data
Daily mean meridional winds from MF (medium frequency) radars (e.g. Tromsø (70◦N, 19◦E), Saskatoon (52◦N, 253◦E)) are used to examine responses of the mesospheric circulation to stratospheric disturbances. Daily mean winds are obtained by a least-squares fit of the mean, 24-, and 12-h tidal components to t12-he 12-hourly mean radar measurements. The fitting uses a window of 3 days shifted by 1 day.
3 Polar vortex characteristics and vertical linkage in the stratosphere-mesosphere
In this section, the characterization of the vortex for each winter is completed to provide perspective for the statistical analyses in the next section. This is necessary; in particular longitudinal asymmetry of the vortex and hence atmosphere has largely been ignored by earlier researchers in the corre-lation analysis. Also this can inform the readers who wish to learn some new aspects of the atmosphere in these winters. The detailed descriptions are presented mainly for the last two winters (2006/2007 and 2007/2008). For the two earlier winters (2004/2005 and 2005/2006), more information about the vortex were given in our recent studies (Chshyolkova et al., 2007, 2009; Manson et al., 2008).
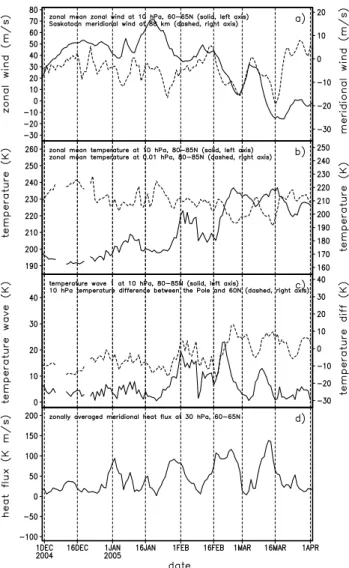
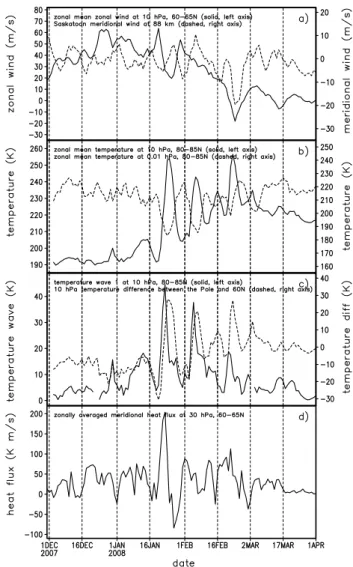
Fig. 1.The day-to-day variability of UKMO zonal mean zonal wind at 10 hPa, 60–65◦N and meridional wind at 88 km over Saskatoon (52◦N, 253◦E) (panela); MLS zonal mean temperatures at 10 hPa and 0.01 hPa, 80–85◦N (panelb); Amplitude of MLS temperature planetary wave number 1 and zonal mean temperature difference between the North Pole (80–85◦N) and 60–65◦N for the 10 hPa level (panelc); and UKMO zonally averaged meridional heat flux at 30 hPa, 60–65◦N (paneld), during the 2004/2005 winter.
(e.g., Hoffmann et al., 2002; Jacobi et al., 2003). Here we use data of multi-years (4 winters), more variables (temper-ature, heat flux, planetary wave amplitude, mesospheric and stratospheric winds) and higher vertical resolution (∼3–6 km from tropopause to upper mesosphere).
3.1 2004/2005 winter
The winter stratosphere of 2004/2005 has been described (e.g. Manney et al., 2006; Manson et al., 2008) as cold and with a strong polar vortex, i.e. zonal mean lower stratospheric temperatures were generally cold, with no MMW. This win-ter was also typified as having a “cold” 30 hPa polar
atmo-sphere in December and January (statistics from the Institute of Meteorology, Free University of Berlin “FUB”).
Manson et al. (2008, Fig. 9) discussed 2004/2005 and 2005/2006 differences: the planetary wave breaking oc-curred at lower stratospheric heights in December 2004, leading to a cold mid-winter middle-upper stratosphere and the absence of a major SSW. Appropriately (Labitzke et al., 2006), the Quasi Biennial Oscillation (QBO) was in its “westerly wind” phase. Despite the above, 2004/2005 was not simple dynamically (Chshyolkova et al., 2007). Like more than 50% of all years (Harvey et al., 2002) there was a regional or minor warming in the Pacific Western-Canada, which in 2004 was associated with a very strong and deep Aleutian stratospheric anticyclone. This anticyclone led to a smaller but very cold, strong, and distorted vortex lying over Scandinavia-Western Europe in January and February.
should be noted that the response of mesospheric wind to the stratospheric disturbances has longitudinal dependence. The longitudinal differences are related to the relative posi-tion of the cyclone (vortex) and the anticyclone. During this winter, the Canada-Saskatoon MF radar observed clear re-sponses of mesospheric meridional winds to the stratospheric disturbances because of stratospheric warmings in that lon-gitudinal (the Pacific Western-Canada) sector (Manson et al., 2008).
3.2 2005/2006 winter
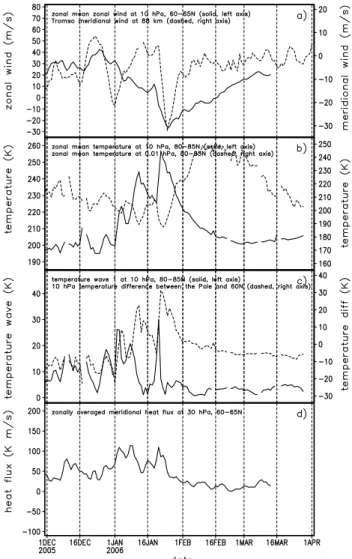
Moving to the 2005/2006 winter, the planetary wave break-ing occurred at the upper stratospheric heights in December 2005, leading to a warmer mid-winter middle-upper strato-sphere and weaker winds than in December 2004, and the presence of a major SSW (Manson et al., 2008; FUB statis-tics). The major SSW event occurred around 22–25 Jan-uary, accompanied by a zonal mean mesospheric cooling and the reversal of the stratospheric zonal mean zonal wind (Fig. 2). Also at Tromsø (70◦N, 19◦E) the MF radar ob-served a strong southward wind near this event (dashed line in Fig. 2a). There were several hemispheric stratospheric disturbances prior to the MMW (they began in late Decem-ber), which were followed by extremely low temperatures in the stratosphere and extremely high temperatures in the mesosphere (Fig. 2b). Similar descriptions were also pre-sented in recent studies (e.g. Manney et al., 2008; Coy et al., 2009). It is important to remember that these low and high temperatures were zonal mean values. During Jan-uary 2006, the stratospheric zonal mean zonal wind showed a weakening trend from eastward to westward flows, with superimposed short term oscillations (solid line in Fig. 2a), which are associated with the MMW and its earlier strato-spheric disturbances. The PW1 (Fig. 2c) and meridional heat fluxes (Fig. 2d) feature related variability, but the lack of de-tailed visual positive correlation indicate the complexity of the hemispheric spatial structures that contributed to the var-ious zonal means.
Indeed, the vortex was significantly disturbed and dis-torted during January 2006, which contributed to the se-quence of zonal mean temperature disturbances (Fig. 2 and Chshyolkova et al., 2009). The Aleutian anticyclone was more toward the western Pacific this year than in 2004/2005, and during the MMW event the anticyclone moved further west and literally slid within and under the existing vor-tex. This resulted in warm polar temperatures, and reversed stratospheric westward winds at the majority of mid-latitude longitudes, which is an indicator of significant zonal symme-try. However the longitudinal asymmetries before the MMW were significant, with Scandinavia (Pacific) being respect-fully colder (warmer) in the middle stratosphere, but warmer (colder) from stratosphere into mesosphere (Chshyolkova et al., 2009; Figs. 7 and 8). The effects of these asymmetries will be demonstrated later in the correlation plots.
Fig. 2.As in Fig. 1, but for the 2005/2006 winter and the meridional wind in panel(a)comes from Tromsø (70◦N, 19◦E) MF radar ob-servations.
3.3 2006/2007 winter
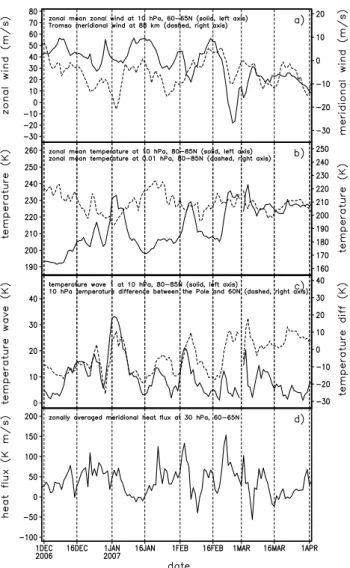
Fig. 3.As in Fig. 2, but for the 2006/2007 winter.
reversed meridional flow over Tromsø. There was no short term mesospheric thermal effect of the minor SSW near 5 February (Fig. 3b), although the four other parameters for 30 and 10 hPa (Fig. 3a, c and d) showed appropriate re-sponses. Nevertheless, this event did occur in the middle of an overall mesospheric cooling trend. During the major SSW near 24 February, reversals of stratospheric zonal wind and mesospheric meridional wind were observed (Fig. 3a), al-though no obvious mesospheric cooling event occurred. This speaks to the longitudinal variability and complexity of upper heights of the major SSW. Between the disturbances around 2 January and 5 February, and based upon mean 10 hPa tem-peratures at 60–65◦N for two longitudinal sectors (Pacific and eastern Canada-central Russian; not shown) hemispheric symmetry was re-established and the polar vortex apparently recovered near 12 January. These features will influence the results in the correlation plots in the next section.
As is to be expected, in this winter the vortex was again significantly distorted, especially near the dates discussed
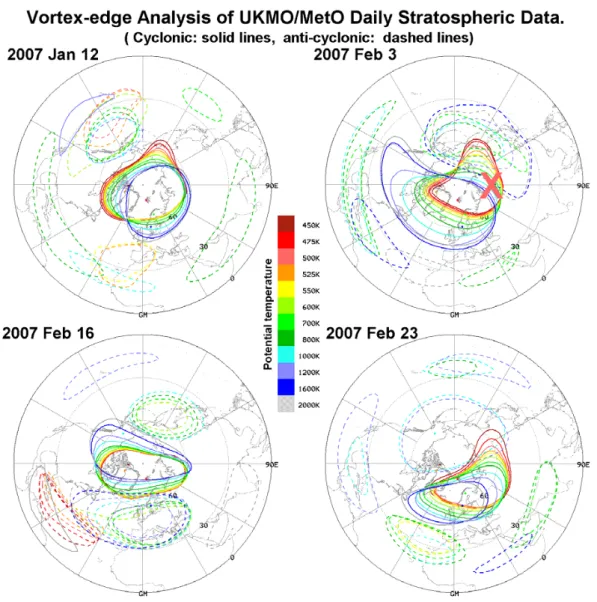
above. Four typical and appropriate vortices are shown in Fig. 4: 12 January, between the first two thermal disturbances when zonal symmetry is strongest; disturbed vortices on 3 and 23 February; and the vortex for another intermediate date of 16 February. It should be noted that the date of a vortex best representing an event (circa 15–50 km) differs slightly from the date of a peak in 10 hPa zonal mean temperature time sequences. It is interesting that on 12 January the vor-tex was centered on the pole, approaches circularity, has little vertical tilt, and yet there was still a multi-height anticyclone centered near 800 K/30 km over the Pacific. For the two February disturbances the vortices at lowest heights (450– 550 K, 16–22 km) were centered over Scandinavia, with vari-able extensions into the Atlantic and/or Russia sectors, and with westward tilts with increasing height. On 3 February the vortex at 2000 K/50 km extended over Canada, and the Aleutian anticyclone was centered over the western Pacific-Japan. The latter extended from 600–1600 K (24–43 km). The vortex-tilt is less during the major SSW (23 February is shown), the pole is actually outside the vortex, and the Aleutian anticyclone was centered over the central northern Pacific. As expected, between these two events (16 Febru-ary), the vortex was more closely centered on the pole, but it was more elliptical because of two anticyclones near 0◦and 180◦E longitude.
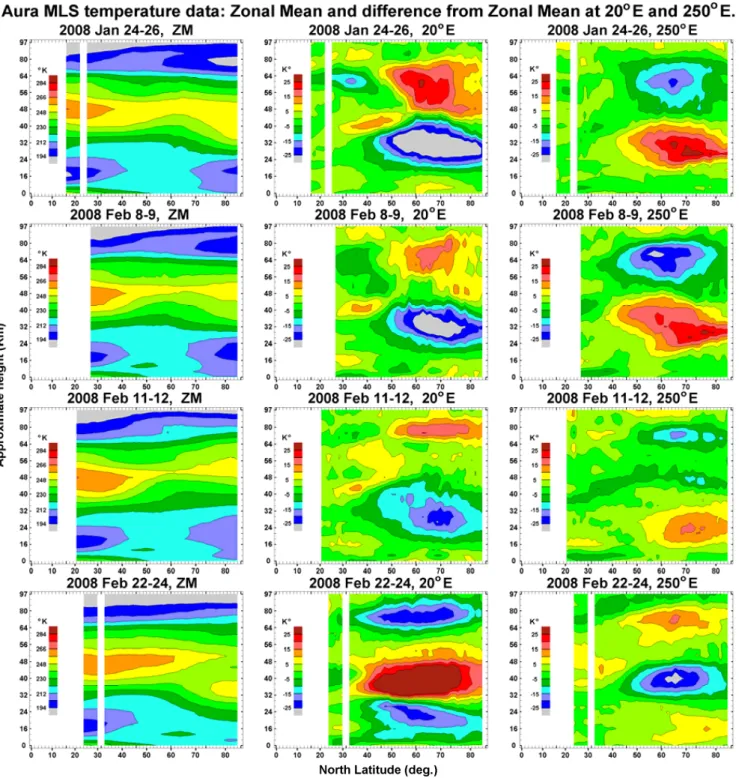
The height-latitude temperature contours for 20◦±12.5◦E and 180◦±12.5◦E longitude sectors were derived from Aura-MLS (Fig. 5): the dates are for three days centered on the two February warming events, and the 11–13 January sym-metrical condition. We have chosen longitudes that pass through the vortex and the Aleutian anticyclone for each of the three dates, so that contrasts in temperatures up to the mesosphere can be distinguished. The zonal means (left side) are subtracted from the values for the two events to even bet-ter distinguish the thermal conditions appropriate to the cy-clone (near 20◦E, middle of the figure) and the anticyclone (near 180◦E, right side). The stratosphere (mesosphere) over Scandinavia-western Europe is still very cold (warm) dur-ing the 4–6 February warmdur-ing days and even for SSW days (23–25 February). Conversely the Pacific sector has reverse temperature tendencies. The zonal mean sections of Fig. 5 show the contrast between the cold polar stratospheric tem-peratures during the undisturbed 11–13 January days and the increasingly warm polar temperatures during the minor and then major warmings.
3.4 2007/2008 winter
Fig. 4.The polar vortex (solid lines) and anticyclone edges (dashed lines) at 450–2000 K isentropic surfaces (∼20–50 km) for 12 January, 3, 16 and 23 February 2007. A “×” symbol marks the region with low O3mixing ratios near 20 km (500 K) in the 3 February 2007 vortex.
shows the four disturbances occurring at 80–85◦N and 10 hPa near 22 January, 5, 15 and 23 February. The sev-eral disturbances cause the alternating occurrence of warm-ing and coolwarm-ing at stratospheric heights in January and Febru-ary (solid line in Fig. 6b). The mesospheric zonal mean temperature shows a clear anti-phase with them during this period (dashed line in Fig. 6b). Both stratospheric zonal wind and mesospheric meridional wind were found to be re-versed when the MMW appeared near 23 February (Fig. 6a). Similar to 2005/2006 winter, the stratospheric zonal mean zonal wind shows a reversal trend from eastward to west-ward flows with superimposed short term oscillations (solid line in Fig. 6a) during the occurrence of the MMW and the several earlier disturbances.
The vortex was again significantly distorted, especially near the dates discussed above. Four vortices, which are
Fig. 5.Height-latitude contour plots for MLS zonal mean temperature and differences from zonal mean at two longitudinal sectors for three time-intervals during winter 2006/2007. See text for details.
and variability within these ranges continued until the ma-jor SSW near 23 February, when warm air presided near the pole in the lower to middle stratosphere. The complexity of the vortex-shapes is due to anti-cyclones, again seen at sev-eral longitudes besides the Pacific. On 23 February the vortex has little vertical tilt from 15–50 km.
The height-latitude temperature contours for 20◦±12.5◦E and 250◦±12.5◦E longitude sectors were again derived from Aura-MLS (Fig. 8): the dates are chosen from Fig. 7. As for 2006/2007 we have chosen two longitude-sectors that pass through the vortex and the Aleutian anticyclone on all four dates, so that contrasts in temperatures up to the mesosphere can be distinguished. The zonal means (left side) are sub-tracted from the values for the two longitudes to even better distinguish the thermal conditions appropriate to the cyclonic
conditions in the vortex and in the Pacific anticyclone will be considered in later sections of this paper, when spatial corre-lations are provided and discussed.
3.5 Leading of upper mesospheric cooling
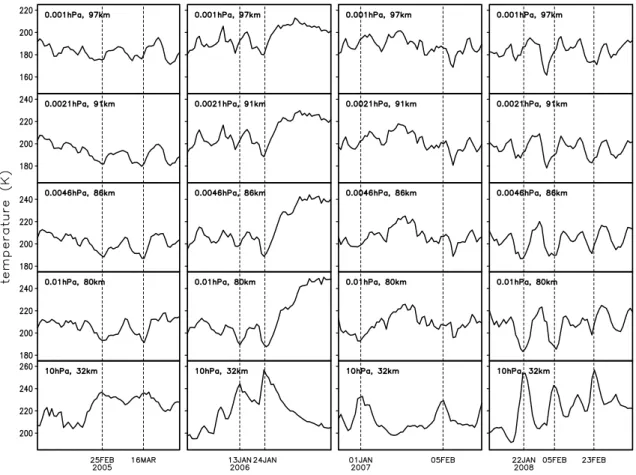
As shown in Figs. 1–3 and 6, the mesospheric coolings are often connected with the warmings at stratospheric heights. However, there is possibly a time-shift between strato-spheric warming and mesostrato-spheric cooling. Walterscheid et al. (2000) reported that the mesospheric cooling preceded the warming in the lower stratosphere. Figure 9 shows time-sequences of the 80–85◦N zonal mean temperature at 10, 0.01, 0046, 0.0021 and 0.001 hPa for the four winters. One can see for most pronounced stratospheric disturbances (e.g. around 25 February 2005; 13 and 24 January 2006; 1 Jan-uary 2007; 22 JanJan-uary and 5 FebrJan-uary 2008), the middle mesosphere (∼80 km) usually showed a simultaneous cool-ing while in the upper mesosphere (>85 km) the cooling of-ten occurred slightly (1 or 2 days) earlier than the beginning of the warming in the stratosphere.
Following discussions by Walterscheid et al. (2000), a rea-sonable explanation for why the upper mesospheric cooling precedes the stratospheric warming disturbance is as follows. The amplification of SPW (mainly S=1 and S=2) results in northward heat transport and vertical motion during strato-spheric disturbances. Initially, the upper mesosphere be-comes cooled as a result of the upward forcing from below, while in the stratosphere the adiabatic cooling due to the up-ward motion is balanced by northup-ward heat transport. The stratospheric warming does not occur until the heat trans-port overwhelms the adiabatic cooling. GW propagation into the MLT is also affected by the changing background winds due to PW, which produce longitudinal variations in atmo-spheric parameters (Figs. 4 and 7). GCM models with data assimilation will be useful in assessing these lower and upper atmospheric behaviours, which might be also related to dif-ferences between gravity wave fluxes and momentum depo-sition in the lower mesosphere and in the upper mesosphere. The impacts of this time shift will be demonstrated later in the correlation plots of short term variations.
4 Interhemispheric coupling in the stratosphere-mesosphere
4.1 Year-to-year variability of monthly zonal mean temperature
Investigations in this paper on interhemispheric linkage are through a series of correlation analyses. This work focuses on correlation analysis with the daily temperatures. How-ever, before we show that, we want to demonstrate whether the Aura-MLS temperature data used here can reproduce the results of others. Following Karlsson et al. (2007, 2009), we perform correlation analysis based on the year-to-year
Fig. 6.As in Fig. 1, but for the 2007/2008 winter.
Fig. 7. Same as Fig. 4, but for 26 January, 9, 11 and 23 February 2008. A “×” symbol marks the region with low O3mixing ratios near
20 km (500 K) in the 9 February 2008 vortex.
with much less ozone loss; and 2006/2007 had fewer thermal disturbances than 2007/2008.
Notice that averages over a month might lead to the loss of information associated with SSWs. To assess this we repeated the monthly mean correlations for December and February. The month with cleanest partitions between +/− correlations was December (left side of Fig. 10), when few if any SSW/stratospheric disturbances occur; January (mid-dle of Fig. 10) was still very clean, but less well partitioned, likely due to the occurrence of a few SSW; February (right side of Fig. 10), which experienced most of the SSW, was quite noisy. When a winter stratosphere is little disturbed, the cold/warm relationship among different parts of the mid-dle atmosphere is relatively stable, i.e. cooler winter strato-sphere, warmer winter mesosphere and cooler summer meso-sphere. The occurrence of SSWs in the winter hemisphere will cause distinctive and strong responses in both winter
Fig. 8.Same as Fig. 5, but for four time-intervals during winter 2007/2008. See text for details.
4.2 Original sequence of daily zonal mean temperature
Now we turn to the correlation analysis with the daily tem-peratures (3-day means, centered on the middle day). Fig-ure 11 shows the correlation coefficients between zonal mean temperatures near the Antarctic summer polar mesopause (0.002 hPa,∼90 km, 80–85◦S) and zonal mean temperatures
Fig. 9.Time sequences of the 80–85◦N zonal mean temperature at 10, 0.01, 0.0046, 0.0021 and 0.001 hPa during the 4 winters (2004/2005– 2007/2008).
December January February
2004/5 winter 2005/6 winter
2006/7 winter 2007/8 winter
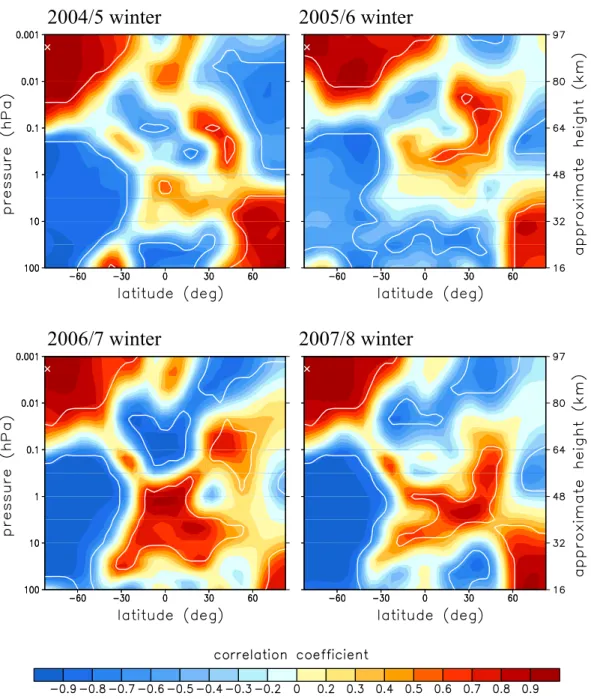
Fig. 11.Correlation coefficient for daily zonal mean temperature at each latitude/pressure with respect to the same parameter at the Antarctic summer polar mesopause (∼0.002 hPa, 80–85◦S, position marked with a “×”). The correlations are based on the day-to-day variability over 2004/2005 winter (24 January to 5 March), 2005/2006 winter (26 December to 4 February), 2006/2007 winter (26 December to 5 March) and 2007/2008 winter (26 December to 5 March), respectively. The white lines indicate the 95% level of significance.
in the respective mid-winter (see Figs. 1–3 and 6). Hence we can expect to be able to identify the influence on the sum-mer mesosphere of the winter disturbances. These time inter-vals will also be used for the subsequent correlation analyses and figures. In this paper, a Monte-Carlo shuffling method is applied to estimate the significance of correlation (e.g. Ebisuzaki, 1997; Usoskin et al., 2006). This spectral method ensures that the significances are appropriate to the degrees of freedom existing in each of the time sequences and hence correlations.
2005/2006 and 2007/2008. Other clear features are the negative and significant correlations in the stratosphere and lower mesosphere of the SH summer, in comparison with the middle-upper mesosphere. Both of these areas of significant correlation extend out to low-middle latitudes (circa 30◦S). This is interesting, as anti-correlations between temperature variations in stratosphere and mesosphere are usually not the subject of discussion in the summer hemisphere. Presum-ably the summer stratosphere is generally warmer due to long hours of insolation, and the mesosphere cooler due to the GW-driven northward flow toward the Arctic (Lindzen, 1981). The correlations in Fig. 11 are showing variations about those mean states. Finally, in the winter hemisphere, at latitudes outside the polar vortex (circa 50◦N) and extending to the equator, there are areas of significant anti-correlation with height-regions within the vortex. These will be asso-ciated with variations in the strength of the Brewer-Dobson Circulation (Salby, 1996; Shepherd, 2000).
The significant positive correlation coefficients in the po-lar winter stratosphere indicate that when the popo-lar win-ter stratosphere gets warmer, the polar summer mesosphere gets warmer too. This link matches with the interhemi-spheric connection suggested on the basis of model studies or the year-to-year variability of monthly averaged observa-tions (e.g. Becker and Fritts, 2006; Karlsson et al., 2007, 2009). The intermediary phenomenon is the variable merid-ional flow, which is initially forced by GW, such that air-flows into the winter mesosphere are weakened or reversed, leading to winter mesospheric cooling. However, we must be careful in the interpretation of such a connection because these correlations in Fig. 11 are dominated by the low fre-quency variability (i.e. the seasonal trend) in the sequences. We find similar correlation patterns (not shown) if only low frequency variability in zonal mean temperature sequence is used. Because of this, these correlations are not sensitive to the time lag between the sequences, i.e. the correlation coef-ficient varies little over a wide range of time lags. Hence, for the original sequences of zonal mean temperature (Fig. 11), correlations have been calculated with simultaneous time se-ries.
4.3 Short-term variations in daily zonal mean temperature
In order to see what the correlation looks like for the high frequency variability (i.e. the short term variations), we have removed the trend from the temperature sequences. The de-trended value for any day is obtained by removing the linear trend over a time window of 15 days (±7 days). Compared with other detrending methods, this approach should intro-duce as few spurious high-frequency fluctuations as possible. A stratospheric disturbance has a duration of typically∼10 days. The use of a window of 15 days minimizes the effect of seasonal variability with the disturbances little changed.
It has been reported that the response in the summer hemi-sphere could be traced into the winter hemihemi-sphere with a time lag (Becker and Fritts, 2006; Karlsson et al., 2007). Hence in this case we have to consider the effect of the time lag on the correlation with the detrended temperature se-quences. So lagged-correlations have been calculated at each latitude/height for the detrended sequences. Figure 12 shows the strongest lagged-correlation coefficient over time-lags of 0 to 10 days (the Antarctic summer mesopause is the refer-ence point; positive lags mean that the Antarctic mesopause temperature sequence is lagging) at each latitude/height. In addition, a 9-point 2-D smoothing algorithm was applied to the contour plots to highlight their main features. The cor-responding time lags are labeled with black numbers (unit: day) in the plots. Only regions with clear time lags are shown for clarity. The reasons for why a range of 0 to 10 days are chosen are as follows. First, it is usually believed that the winter hemisphere drives the summer mesopause due to the variability in time and space of the winter polar vortex. That is to say, the time lag usually should be≥0. Second, a strato-spheric disturbance has a duration of typically∼10 days, so the lagged-correlation often also has a periodic fluctuation as a function of the time lag. If we use a lag longer than 10 days, we would not separate the effect of the time lag from that due to the oscillation of the sequence.
It is shown in Fig. 12 that the temporal variability, at time scales of less than 15 days, of zonal mean tempera-ture at the Antarctic summer mesopause is again positively (negatively) correlated with in the Arctic winter stratosphere (mesosphere) during 2004/2005, 2005/2006 and 2007/2008 winters. That is to say, in these three winters when the po-lar winter stratosphere experiences a disturbance/warming (SSW), the local polar mesosphere gets cooler for the same time scale and the other polar mesosphere experiences a warming event. This is consistent with the interhemispheric coupling chain proposed by Becker and Schmitz (2003), Becker et al. (2004) and Becker and Fritts (2006), although here we are now referring only to temporal disturbances of period less than 15 days. The 2006/2007 winter, however, is largely different from other winters. The negative (posi-tive) correlations are mainly found in the winter stratosphere (mesosphere) over the middle-high northern latitudes during winter 2006/2007. As mentioned in Sect. 3.3 and shown in Fig. 4, between disturbances the polar vortex recovered in the winter hemisphere, and zonal asymmetry was restored. The rapid alternation between strong asymmetric and symmetric structures might lead to the difference in correlation (Figs. 11 and 12) between the 2006/2007 winter and other winters.
2004/5 winter 2005/6 winter
2006/7 winter 2007/8 winter
Fig. 12.Similar to Fig. 11, but for the strongest lagged-correlation coefficient over time lags of 0 to 10 days with the detrended time series. The black numbers represent the time lags (unit: day). The Antarctic summer mesopause is the reference point; positive lags mean that the Antarctic mesopause temperature sequence is lagging.
disturbance are nearly simultaneous in the 2004/2005 win-ter. This is also the only year of our study during which a major SSW did not occur (Sect. 3.1). During 2005/2006 and 2007/2008 winters, the summer mesopause shows re-sponse to the winter stratospheric disturbance with a time lag of about a week. Both of these two winters experienced a MMW, continuous and numerous disturbances, and consec-utive and cumulative reversals of stratospheric zonal wind from westerly to easterly (Sects. 3.2 and 3.4). For winter 2006/2007, the interhemispheric time lag is not clear as ex-pected from earlier discussion. The time difference between the response of the Antarctic summer mesopause and the Arctic winter stratospheric disturbance reflects the time scale for interhemispheric coupling, which is probably related to the characteristics of the winter polar vortex for a given year. In Fig. 12, the black numbers in the Arctic upper mesosphere are usually slightly larger than those in the Arctic
2004/5 2005/6 C oher e nc e Period (days) 30 10 5 4 3 2 0 0.2 0.4 0.6 0.8 1 P has e ( deg. ) -180 -90 0 90 180 C oher e nc e Period (days) 30 10 5 4 3 2 0 0.2 0.4 0.6 0.8 1 P has e ( deg. ) -180 -90 0 90 180
2006/7 2007/8
C oher e nc e Period (days) 30 10 5 4 3 2 0 0.2 0.4 0.6 0.8 1 P has e ( deg. ) -180 -90 0 90 180 C oher e nc e Period (days) 30 10 5 4 3 2 0 0.2 0.4 0.6 0.8 1 P has e ( deg. ) -180 -90 0 90 180
Fig. 13. Coherence (solid line, scale on left axis) and phase (dots, scale on right axis) between the detrended sequences of zonal mean temperatures at the Antarctic mesopause (80–85◦S, 0.002 hPa) and in the Arctic winter stratosphere (>65◦N, 21–4.6 hPa) for the four winter intervals used in Fig. 12. The dashed line indicates a 95% confidence level. Time lags are applied based upon the results from Fig. 12. See text for details.
Note that the values of (Pearson) correlation coefficient shown in Fig. 12 are a measure of a linear relationship in-tegrated over all frequencies. The significance test using the Monte-Carlo method generally indicates that the corre-lation shown between summer mesopause and winter strato-sphere reaches a 95% significance level. To further as-sess the “reality” of the relationship, first we inspected the sampling distributions and spectra of the detrended (short-term variation) sequences of zonal mean temperatures at the Antarctic summer mesopause and in the Arctic winter strato-sphere(not shown here). The two sequences for each win-ter are approximately in a normal distribution, which meets the fundamental condition for the Pearson correlation cal-culations. In 2005/2006 and 2007/2008, the spectra of the two sequences are dominated by variations of∼10 day pe-riod, while in the other two winters the dominant periods are longer. Then we performed cross-spectral analyses, which can add information on frequencies relevant to a correla-tion. Figure 13 provides the coherence and phase between the detrended sequences of zonal mean temperatures at the Antarctic mesopause (80–85◦S, 0.002 hPa) and in the Arctic winter stratosphere (>65◦N, 21–4.6 hPa) for the four winter intervals used in Fig. 12. Time-lags of 0, 6, 2 and 6 days (derived from Fig. 12) were respectively applied in the four winters so that the spectral information of strongest lagged-correlation can be examined. These spectral estimates were
2004/5 winter 2005/6 winter
2006/7 winter 2007/8 winter
Fig. 14. Correlation coefficient for temperature over 60–65◦N at each longitude/pressure with respect to zonal mean temperature at the Antarctic summer mesopause (∼0.002 hPa, 80–85◦S, position cannot be marked in this figure). The white line indicates the 95% level of significance. Time lags are applied based upon the results from Fig. 12. See text for details.
4.4 Longitudinal variability
The aforementioned correlations are based on the temporal variability of zonal mean temperature. However, we know the temperatures in the winter hemisphere have longitudi-nal dependence. In particular, the zolongitudi-nal asymmetry of tem-perature over the winter mid-high latitudes is most obvious during the disturbed days (e.g. Figs. 5 and 8). Compared to previous correlations with zonal mean temperatures, the cor-relation with temperatures in different longitudinal sectors in the NH might give more details of the interhemispheric connection. Figure 14 shows the correlation between zonal mean temperature at the Antarctic summer mesopause and temperature over 60–65◦N at each longitude sector and pres-sure level. The SH zonal mean temperature was used be-cause the longitudinal variations were very small in the local summers. As for Fig. 12, time sequences of temperatures were detrended before calculating correlations for Fig. 14.
To keep consistent with Fig. 12, the time lags of 0, 6, 2, and 6 days between the summer mesopause and the winter stratosphere-lower mesosphere (∼16–80 km), and of 1, 8, 3, and 8 days between the summer mesopause and the winter upper mesosphere (∼80–97 km) were respectively applied to the correlations for the 2004/2005, 2005/2006, 2006/2007, and 2007/2008 winters in Fig. 14. These lags were chosen based on the results of Fig. 12. On the whole, the correlations show opposite signs for Scandinavia-Eastern Europe and the Pacific-Western Canada longitudinal quadrants in these four winters (Fig. 14). This is an indicative of temperature asym-metries. As described in Sect. 3 and shown in the vortices of Figs. 4 and 7, Scandinavia-Eastern Europe (the Pacific Western-Canada) is usually occupied by the polar vortex or cyclone (anti-cyclone) near the disturbance dates.
(positive) in the stratosphere (mesosphere). This year did not experience a major SSW, meaning that the zonal asymme-tries were not as large as during the other years. So the corre-lations using zonal mean temperatures show very weak pos-itive (negative) values in the stratosphere (mesosphere) over 60–65◦N (upper left panel of Fig. 12). During the 2005/2006 and 2007/2008 winters, stratospheric (mesospheric) positive (negative) correlations appeared at most of mid-latitude lon-gitudes, leading to the associated strong and spatially clear positive (negative) correlations with zonal mean temperature in the stratosphere (mesosphere) (right column of Fig. 12). In contrast, negative (positive) correlations in the stratosphere (mesosphere) occupied the majority of mid-latitude longi-tudes in the 2006/2007 winter. Correspondingly, the nega-tive (posinega-tive) correlations at the stratosphere (mesosphere) are found for the correlations using the zonal mean temper-ature (lower left panel of Fig. 12). All these indicate a sta-tistical consistency between the correlations for the height versus latitude plots using zonal mean temperatures (Fig. 12) and for the height versus longitude plots using temperatures in different longitudinal sectors (Fig. 14). This analysis also illustrates the inadequacies associated with the use of zonal mean data when dealing with time intervals and winters for which the vortex was significantly distorted and/or displaced from the pole.
Asymmetry of the polar vortex, which led to longitu-dinally alternating maxima and minima in middle atmo-spheric temperatures (Figs. 5 and 8), and varying positive and negative correlations in the stratosphere and mesosphere at northern latitudes (>50◦N, Fig. 14), also will have led to strong variations in the distribution of chemical constituents: ozone, chlorine monoxide, nitrous oxide and hydrochloric acid. A prime source for these and other chemicals involved in the loss of ozone due to heterogeneous chemistry is the data archive of Aura-MLS. Using that for winter 2004/2005, Manson et al. (2008) showed strong variations in these chem-icals within the Aleutian anticyclone and the Scandinavian-Western Europe sector, which latter preferentially remains within the distorted polar vortex. Also for that winter, and within the vortex, temperatures required for Polar Strato-spheric Clouds (PSC) and ozone loss were shown to occur preferentially within the regions of cyclonic curvatures and not in the anticyclonic regions of the vortex.
We have assessed the chemical and thermal conditions on days near the SSW/disturbances of 3 and 23 February 2007, using Aura-MLS data. For heights near 500 K (orange to red) and relative to the areas inside the vortex (Fig. 4), the mixing ratios for O3 were hemispherically low, espe-cially in the coldest locations (T <196 K) where ClO had maximum values. The height-latitude ozone contours on 3– 5 February for longitude sectors passing through the vor-tex (90◦±12.5◦E) and the anticyclone (190◦±12.5◦E) are shown in Fig. 15. The zonal means are subtracted in this figure to better distinguish the chemical conditions in the cy-clone and the anticycy-clone. There are anomalously low O3
mixing ratios in the vortex and near 20 km (500 K). Max-imum ClO values are collocated, and a “×” symbol has been placed in that area of the 3 February 2007 vortex (Fig. 4). Ozone mixing ratios are high in the anticyclone sector, due to the presence of ozone-rich air from middle-low latitudes. Notably, ozone minima and the presence of essential heterogeneous chemicals, continue to exist during SSW/disturbances, as at these particular times the vortex is most distorted and strongly cyclonic regions favoring very low temperature prosper. The SSW/disturbances of winter 2007/2008 are summarized chemically by reference to the vortices in Fig. 7 and related discussion of Sect. 3.4. As noted there, a quasi-elliptical vortex existed until the ma-jor SSW (∼23 February), with major axis lying through 90– 120◦E and 270–290◦E. We have chosen the 9 February dis-turbance, which was included in the longitudinal correlations of Fig. 14, as being behaviorally typical of the pre-MMW in-terval. The height-latitude ozone contours on 9 February for longitude sectors passing through the vortex (290◦±12.5◦E) and therefore close to Eureka (Canada), plus through the Pa-cific anticyclone (210◦±12.5◦E) are also shown in Fig. 15: again, there are anomalously low O3mixing ratios in the vor-tex and near 20 km (500 K). Maximum ClO values are also collocated, and a “×” symbol has been placed in that area of the 9 February 2008 vortex (Fig. 7). In this year temperatures favouring PSC did not occur during the MMW, as the lower stratosphere of the polar vortex had become too large (Fig. 7) and relatively warm.
The longitudinal asymmetry of the distribution of ozone-chemicals during the quiet and disturbed intervals of 2006/2007 and 2007/2008, including thermal and vortical changes, is a powerful indicator of the importance of the vor-tex in hemispheric and global studies. Further consideration of the coupling processes between the vortex and the asso-ciated Aleutian anti-cyclone are warranted. Given that the vertical motions in the mesosphere within and above these systems are respectively normally downward and upward, si-multaneous coupling between them and the Antarctic sum-mer mesosphere are inevitable and inherent in the correla-tions of Fig. 14. The result will be longitudinal variability of meridional winds, having continental and vortex-scales, which flow from Antarctica into the winter Northern Hemi-sphere.
5 Summary and discussion
Based on temperature measurements with near global view by Aura-MLS and supplemented by the UKMO stratospheric assimilated data as well as the MF radar wind observa-tions, we address the vertical and interhemispheric linkages in the stratosphere-mesosphere during four northern winters 2004/2005–2007/2008.
Fig. 15.Contour plots of ozone mixing ratio (the zonal means are subtracted) at the chosen longitudinal sectors that pass through the vortex (left side) and the anticyclone (right side) for two dates (3–5 February 2007 and 9 February 2008).
months. The vertical coupling process is as follows: An in-creased (dein-creased) planetary wave activity from the tropo-sphere drives increased (decreased) temperatures and a rever-sal or weakening (strengthening) of eastward zonal flow in the polar winter stratosphere. Accordingly, the polar winter mesosphere shows a clear response with a cooling (warming) as well as a reversed or weaker (stronger) northward wind. The cooling in the upper-mesosphere often slightly precedes the beginning of the warming in the stratosphere. These ver-tical connections agree well with previous studies by others (e.g. Jacobi et al., 1997, 2003; Walterscheid et al., 2000; Hoffmann et al., 2002; Dowdy et al., 2007), but are more completely (multiple years; more parameters; and higher ver-tical resolution) revealed by the larger observational dataset in this study.
The characterization of the vortex for each year was com-pleted to provide perspective for the analyses later within the paper. The vortices shown and discussed demonstrated strong and variable distortion and displacement, usually into the Scandinavian-Russian sector, which were most extreme during temperature disturbances (SSW or regional warm-ings). There were 3–4 disturbances each winter, and the three last winters (2005/2006–2007/2008) experienced
ma-jor SSW. The Aleutian stratospheric anticyclone was always in evidence in the middle to upper stratosphere and was strongest during the SSW. Major and minor SSWs are seen to be distinguished purely by the relative spatial sizes and intensities of the vortex and the anticyclone, so that dis-tinctions between the two categories are sometimes tenuous. We used temperature contours plotted with height-latitude axes, and passing through a disturbed vortex and the asso-ciated anticyclone to reveal the expected, but extraordinar-ily large anti-correlations between stratospheric/mesospheric temperature perturbations. For the examples of 2006/2007 and 2007/2008, and in the anticyclone, the entire strato-sphere was warmer than the vortex (typically +24 K), and the mesosphere was colder (typically−24 K). Given that vertical motions within the vortex and the anticyclone are opposite (downward and upward), and that zonal means are mainly used for interhemispheric coupling studies, it is clear that great caution has to be used in interpreting such results.
temperature, a positive correlation is generally found be-tween the polar SH summer mesopause and the polar NH winter lower and middle stratosphere (∼16–40 km) during four winters, 2004/2005–2007/2008. These correlations are dominated by the low frequency variability (i.e. the trend) over the 40–70 day sequences. The length and dates of these sequences were ascertained by assessments of zonal-mean parameters, characterizations of the winter polar vortex us-ing vortex-edges, and associated longitudinal temperature-variations.
With the detrended sequences, which retain periods less than 15 days, the strongest value of correlation coefficient for time lags of 0 to 10 days (the summer mesopause is lag-ging) indicates that the Antarctic summer mesopause is pos-itively (negatively) correlated with the Arctic winter strato-sphere (mesostrato-sphere) during three out of the four winters. The remaining winter (2006/2007) has more complex cor-relations structures; correspondingly the polar vortex was distinguished this year by variations between longitudinal quasi-symmetry and strong asymmetry when the vortex was distorted and centered over western Russia. The use of zonal means for the correlation time-sequences in this case appears to be unjustified; indeed we consider it problematic in any winter study, without considerable investigation.
Due to this significant departure from longitudinal tem-perature symmetry, associated with dynamical-thermal vor-tex structures, interhemispheric correlations were also com-pleted and provided using longitudinal sectors. For northern mid-high latitudes (∼50–70◦N), temperatures in Scandinavia-Eastern Europe and in the Pacific-Western Canada longitudinal sectors often have opposite signs of cor-relations with zonal mean temperatures near the SH sum-mer mesopause during mid-winters. These longitudinal dif-ferences in the correlation are related to the relative posi-tions of the cyclone (vortex) and the anticyclone. In addi-tion, this study also observed a positive correlation between the Antarctic polar summer mesopause region and the Arc-tic winter stratosphere from the year-to-year variability of monthly averaged zonal mean temperature in December and January, with the greatest clarity in the early winter. This extends the study of Karlsson et al. (2007) to 1 other year and early and late winter months. The changing clarity with time is considered associated with the greater distortion and displacement of the vortex, and the competing physical pro-cesses within the vortex and the Aleutian anticyclone.
Inspection of global temperature-correlation figures indi-cates variations from winter to winter. These are considered to be associated with the evolution of the winter polar vortex. The correlations in winters 2005/2006 and 2007/2008 were very similar, which is perhaps due to congruities in their win-ter stratospheres such as the occurrence of a MMW, continu-ous and numercontinu-ous disturbances, and consecutive and cumu-lative reversals of zonal mean zonal wind from westerly to easterly. In the winter stratosphere of 2006/2007, between well temporally spaced disturbances there were strong
vor-tex recoveries and movements of the vorvor-tex back toward the pole. The alternation between strong asymmetric and sym-metric structures, along with the use of zonal means for two of the three correlation plots shown, might well have led to the differences in the correlations between the 2006/2007 winter and other winters. Indeed the correlations between Antarctic mesospheric temperatures and the NH high mid-latitudes, with longitude as the variable, show very organized structures that are different from any of the other three win-ters.
The correlation results also vary depending on the time in-terval used. In this paper the correlations are calculated over intervals covering most of the stratospheric disturbances in respective winters because what we are most interested in are SH summer mesospheric manifestations of NH winter distur-bances. It is known that the temporal evolution of tempera-ture includes not only transient variations but also seasonal variability. The transient variations with periods of several days (∼5, 10 and 16 days) are induced by planetary scale resonances or Rossby Waves, while the seasonal variability is attributed to a complex combination of insolation, dynam-ics and chemistry. A detailed statistical analysis of the sea-sonality in global temperature would require many years of data for stable estimates, and cannot be performed in this pa-per. The use of the detrending method as applied in this paper will have significantly reduced the influence of the seasonal variability on correlations for each winter (see Sect. 4).
Another important factor influencing the features of the global (height versus latitude) correlations for the high fre-quency variability (periods less than 15 days) is the time-lag between the reference position and each latitude/height. We associate these time-lags with the time-scales for interhemi-spheric coupling in each winter. Since we do not know the time-scales, the correlation and time-lag are determined by looking for the largest magnitude of correlation coefficient within a range of time-lags (e.g. Becker and Fritts, 2006). In this paper time lags ranging from 0 to 10 days are considered in the correlation analyses with high frequency variability. Our principle reason for this choice is that stratospheric dis-turbances in our four winter study have durations of typically ∼10 days. The differences in correlation-patterns between the four winters might be related to this limited range of time lags, but our analyses are most consistent and physically re-alistic with the lag-range of 0–10 days.
Fig. 16.Time sequences of meridional winds at 88 km over Rothera (68◦S, 292◦E) (solid line) and over Saskatoon (52◦N, 253◦E) (dashed line) in winter 2004/2005.
from the troposphere is well understood (Matsuno, 1971): the amplification of PWs results in an upward and northward transport of heat by wave-mean flow, wave-wave interac-tions. Warming occurs when the heat transport is larger than the adiabatic cooling caused by wave-forced vertical motion. Due to wave-forced vertical motion from below (e.g. Wal-terscheid et al., 2000) and the modulated gravity wave drag in the mesosphere (e.g. Becker and Fritts, 2006), the north-ward meridional wind into the Arctic mesosphere will be weakened or reversed when a stratospheric warming occurs, leading to a cooler winter mesosphere. The associated down-welling at high polar latitudes will be weaker or in the case of a reversed meridional flow, an upwelling will occur. This in-terpretation is supported by the in-phase relation near the dis-turbance dates of 2004/2005–2007/2008 between the merid-ional wind and zonal mean temperature in the NH polar mesosphere, as shown in Sect. 3.
Based on Becker and Fritts (2006), the meridional cir-culation anomaly can go across the equator and continue in the SH summer hemisphere, causing a warmer summer mesopause by a weaker upwelling or a down-welling. The observed global meridional flows near 95 km for the two solstices (June–July 1993, December–January 1993/2004; Manson et al., 2002) demonstrate this along with some smaller scale longitudinal variability of the meridional flows. Such flows are strongly inferred by the global atmospheric correlations that have been the focus of this paper. Currently we cannot directly demonstrate this across-equator propaga-tion, by the use of observations for the years of this study, due to lack of sufficient meridional wind data near the equa-tor and at the southern high latitudes. Here we show only one example. Figure 16 gives meridional winds at 88 km over Saskatoon (52◦N, 253◦E) (dashed line) compared with those over Rothera (68◦S, 292◦E) (solid line) for the 2004/2005 winter. During the Pacific-Western Canada warming near the end of February and the final warming in mid-March, the meridional winds over Rothera and Saskatoon are nearly in phase. This may be an example of the mesospheric
merid-ional wind flowing southward across the equator in the pres-ence of enhanced SPW activity and a distorted polar vortex in the NH winter stratosphere. Detailed interhemispheric dy-namics will be explored in the future after additional merid-ional wind observations become available.
Acknowledgements. Funding for this work was from CANDAC-PEARL, in part from its IPY funding; the Canadian Natural Sci-ences and Engineering Research Council; and the University of Saskatchewan through support to ISAS. Thanks are given to the Aura team for their MLS dataset as well as to the UK Meteorolog-ical Office for the stratospheric assimilated data, and to the British Atmosphere Data centre for providing access to these data. The Rothera MF radar was jointly supported by National Science Foun-dation grant OPP-0438777 and by the UK Natural Environment Re-search Council.
Topical Editor C. Jacobi thanks three anonymous referees for their help in evaluating this paper.
References
Abatzoglou, J. T. and Magnusdottir, G.: Wave breaking along the stratospheric polar vortex as seen inn ERA-40 data, Geophys. Res. Lett., 34, L08812, doi:10.1029/2007GL029509, 2007. Angelats i Coll, M. and Forbes, J. M.: Nonlinear
interac-tions in the upper atmosphere: the s=1 and s=3 nonmi-grating semidiurnal tides, J. Geophys. Res., 107(A8), 1157, doi:10.1029/2001JA900179, 2002.
Baumgaertner, A. J. G., McDonald, A. J., Fraser, G. J., and Plank, G. E.: Long-term observations of mean winds and tides in the upper mesosphere and lower thermosphere above Scott Base, Antarctica, J. Atmos. Solar-Terr. Phys., 67(16), 1480–1496, 2005.
Baumgaertner, A. J. G., Jarvis, M. J., McDonald, A. J., and Fraser, G. J.: Observations of the wavenumber 1 and 2 components of the semi-diurnal tide over Antarctica, J. Atmos. Solar-Terr. Phys., 68(11), 1195–1214, 2006.
Becker, E. and Fritts, D. C.: Enhanced gravity-wave activity and in-terhemispheric coupling during the MaCWAVE/MIDAS north-ern summer program 2002, Ann. Geophys., 24, 1175–1188, 2006,
http://www.ann-geophys.net/24/1175/2006/.
Becker, E. and Schmitz, G.: Climatological effects of orography and land-sea heating contrasts on the gravity-wave driven circu-lation of the mesosphere, J. Atmos. Sci., 60, 103–118, 2003. Becker, E., M¨ullemann, A., L¨ubken, F.-J., K¨ornich, H., Hoffmann,
P., and Rapp, M.: High Rossby-wave activity in austral winter 2002: Modulation of the general circulation of the MLT during the MaCWAVE/MIDAS northern summer program, Geophys. Res. Lett., 31, L24S03, doi:10.1029/2004GL019615, 2004. Chshyolkova, T., Manson, A. H., Meek, C. E., Avery, S. K.,
Thorsen, D., MacDougall, J. W., Hocking, W., Murayama, Y., and Igarashi, K.: Planetary wave coupling in the middle atmo-sphere (20–90 km): A CUJO study involving TOMS, MetO and MF radar data, Ann. Geophys., 23, 1103–1121, 2005,
http://www.ann-geophys.net/23/1103/2005/.
and Igarashi, K.: Planetary wave coupling processes in the mid-dle atmosphere (30–90 km): a study involving MetO and MF radar data, J. Atmos. Solar-Terr. Phys., 68, 353–368, 2006. Chshyolkova, T., Manson, A. H., Meek, C. E., Aso, T., Avery, S. K.,
Hall, C. M., Hocking, W., Igarashi, K., Jacobi, C., Makarov, N., Mitchell, N., Murayama, Y., Singer, W., Thorsen, D., and Tsut-sumi, M.: Polar vortex evolution during Northern Hemispheric winter 2004/05, Ann. Geophys., 25, 1279–1298, 2007,
http://www.ann-geophys.net/25/1279/2007/.
Chshyolkova, T., Manson, A. H., Meek, C. E., Jacobi, C., Hall, C. M., and Thorsen, D.: Middle Atmosphere dynamics and its effects on distribution of chemical constituents during NH winter of 2005/06, Ann. Geophys., submitted, 2009.
Coy, L., Eckermann, S., and Hoppel, K.: Planetary wave break-ing and tropospheric forcbreak-ing as seen in the stratospheric sudden warming of 2006, J. Atmos. Sci., 66, 495–507, 2009.
Dowdy, A. J., Vincent, R. A., Tsutsumi M., Igarashi, K., Mu-rayama, Y., Singer, W., Murphy, D. J., and Riggin, D. M.: Polar mesosphere and lower thermosphere dynamics: 2. Response to sudden stratospheric warmings, J. Geophys. Res., 112(D17105), doi:10.1029/2006JD008127, 2007.
Ebisuzaki, W.: A method to estimate the statistical significance of a correlation when the data are serially correlated, J. Climate, 10, 2147–2153, 1997.
Emery, W. J. and Thomson, R. E.: Data analysis methods in phys-ical oceanography, 2nd and Revised edition, Elsevier Inc., San Diego, pp. 658, 2001.
Forbes, J. M., Hagan, M. E., Miyahara, S., Vial, F., Manson, A. H., Meek, C. E., Portnyagin, Y. I.: Quasi 16-day oscillation in the mesosphere and lower thermosphere, J. Geophys. Res., 100(D5), 9149–9163, 1995.
Fritts, D. C. and Alexander, M. J.: Gravity wave dynamics and effects in the middle atmosphere, Rev. Geophys., 41(1), 1003, doi:10.1029/2001RG000106, 2003.
Harvey, V. L., Pierce, R. B., Fairlie, T. D., and Hitchman, M. H.: A climatology of stratospheric polar vortices and anticyclones, J. Geophys. Res., 107(D20), 4442, doi:10.1029/2001JD001471, 2002.
Hoffmann, P., Singer, W., and Keuer, D.: Variability of the meso-spheric wind field at middle and Arctic latitudes in winter and its relation to stratospheric circulation disturbances, J. Atmos. Solar-Terr. Phys., 64(8–11), 1229–1240, 2002.
Jacobi, C., Schminder, R., and K¨urschner, D.: The winter mesopause wind field over Central Europe and its response to stratospheric warmings as measured by LF D1 wind measure-ments at Collm, Germany, Adv. Space Res., 20(6), 1223–1226, 1997.
Jacobi, C., K¨urschner, D., Muller, H. G., Pancheva, D., Mitchell, N. J., and Naujokat, B.: Response of the mesopause region dy-namics to the February 2001 stratospheric warming, J. Atmos. Solar-Terr. Phys., 65(7), 843–855, 2003.
Karlsson, B., K¨ornich, H., and Gumbel, J.: Evidence for in-terhemispheric stratosphere-mesosphere coupling derived from noctilucent cloud properties, Geophys. Res. Lett., 34, L16806, doi:10.1029/2007GL030282, 2007.
Karlsson, B., McLandress, C., and Shepherd, T. G.: Inter-hemispheric mesospheric coupling in a comprehensive middle atmosphere model, J. Atmos. Solar-Terr. Phys., 71, 518–530, 2009.
Labitzke, K.: On the solar cycle-QBO relationship: a summary, J. Atmos. Solar-Terr. Phys., 67(1–2), 45–54, 2005.
Labitzke, K., Kunzel, M., and Broonnimann, S.: Sunspots, the QBO and the stratosphere in the North Polar Region – 20 years later, Meteor. Atmos. Sci., 15(3), 355–363, 2006.
Liberato, M. L. R., Castanheira, J. M., Torre, L., Dacamara, C. C., and Gimeno, L.: Wave energy associated with the variability of the stratospheric polar vortex, J. Atmos. Sci., 64, 2683–2694, 2007.
Lindzen, R. S.: Turbulence and Stress Owing to Gravity Wave and Tidal Breakdown, J. Geophys. Res.-Oceans and Atmospheres, 86, 9707–9714, 1981.
Manney, G. L., Santee, M. L., Froidevaux, L., Hoppel, K., Livesey, N. J., and Waters, J. W.: EOS MLS observations of ozone loss in the 2004–2005 Arctic winter, Geophys. Res. Lett., 33, L04802, doi:10.1029/2005GL024494, 2006.
Manney, G. L., Kruger, K., Pawson, S., et al.: The evolution of the stratopause during the 2006 major warming: Satellite data and assimilated meteorological analyses, J. Geophys. Res., 113, D11115, doi:10.1029/2007JD009097, 2008
Manson, A. H., Luo, Y., and Meek, C.: Global distributions of di-urnal and semi-didi-urnal tides: observations from HRDI-UARS of the MLT region, Ann. Geophys., 20, 1877–1890, 2002, http://www.ann-geophys.net/20/1877/2002/.
Manson, A. H., Meek, C. E., and Chshyolkova, T.: Regional strato-spheric warmings in the Pacific-Western Canada (PWC) sector during winter 2004/2005: implications for temperatures, winds, chemical constituents and the characterization of the Polar vor-tex, Ann. Geophys., 26, 3597–3622, 2008,
http://www.ann-geophys.net/26/3597/2008/.
Matsuno, T.: A dynamical model of the stratospheric sudden warm-ing, J. Atmos. Sci., 28, 1479–1494, 1971.
Miyoshi, Y.: Numerical simulation of the 5-day and 16-day waves in the mesopause region, Earth, Planets and Space, 51, 763–772, 1999.
Newman, P. A., Nash, E. R., and Rosenfield, J. E.: What controls the temperature of the Arctic stratosphere during the spring?, J. Geophys. Res., 106(D17), 19999–20010, 2001.
O’Neill, A., Grose, W. L., Pope, V. D., Maclean, H., and Swin-bank, R.: Evolution of the Stratosphere during Northern Winter 1991/92 as Diagnosed from UK-Meteorological-Office Analy-ses, J. Atmos. Sci., 51(20), 2800–2817, 1994.
Quiroz, R. S.: Tropospheric-stratospheric interaction in the major warming event of January–February 1979, Geophys. Res. Lett., 6, 645–648, 1979.
Randel, W. J.: A study of planetary waves in the southern winter troposphere and stratosphere. Part I: wave structure and vertical propagation, J. Atmos. Sci., 44(6), 917–935, 1987.
Salby, M. L.: Fundamentals of Atmospheric Physics, San Diego, Calif., Academic Press, Inc., pp. 627, 1996.
Shepherd, T. G.: The middle atmosphere, J. Atmos. Solar-Terr. Phys., 62, 1587–1601, 2000.
Smith, A. K., Pancheva, D. V., Mitchell, N. J., Marsh, D. R., Russell III, J. M., and Mlynczak, M. G.: A link between variability of the semidiurnal tide and planetary waves in the opposite hemisphere, Geophys. Res. Lett., 34, L07809, doi:10.1029/2006GL028929, 2007.
ac-tivity: Fact or Artifact?, J. Atmos. Solar-Terr. Phys., 68, 2164– 2172, 2006.
Walterscheid, R. L., Sivjee, G. G., and Roble, R. G.: Mesospheric and lower thermospheric manifestations of a stratospheric warm-ing event over Eureka, Canada, (80◦N), Geophys. Res. Lett., 27, 2897–2900, 2000.