13746 | Chem. Commun.,2014,50, 13746--13749 This journal is © The Royal Society of Chemistry 2014 Cite this:Chem. Commun.,2014,
50, 13746
Supported core–shell nanobiosensors
for quantitative fluorescence imaging
of extracellular pH
†
Je´re´mie Asselin,ab
Carl Roy,ab
Denis Boudreau,*ab
Youne`s Messaddeq,b
Rihab Boucharebc
and Patrick Mathieuc
Covalent ‘‘click’’ cycloaddition was used to functionalize silica substrates with pH-sensitive nanoparticles, thus producing uniform and highly luminescent analytical devices usable in both commercial fluorimeters and fluorescence microscopes. Quantitative and spatially-resolved extra-cellular pH measurements were successfully achieved on live cardiac fibroblasts with these novel ion-sensitive surfaces.
The quantitative measurement of physiological ions near biological membranes is crucial for the investigation of cellular metabolic pathways. For example, the determination of ion concentrations across cell membranes is primordial to study the dysregulation of extracellular pH by cancer cells1or the role of calcium, sodium and potassium cations in neurons2 and other excitable cells.3 Among the techniques available, the use of ion-selective fluorescent markers offers the benefits of being nonintrusive and easily amen-able to in vitro spatially-resolved measurements. The inherent hydrophobicity of many organic fluorophores and fluorescent nanoparticles allows them to penetrate the phospholipid bilayer and emit cytosolic-characteristic fluorescence, and thus to quantify intracellular concentrations.4Because of the diffusion of fluores-cent markers through the membrane, however, no similar method is available to quantify the concentration of ions in the extracellular space. A chemical grafting method able to confine ionic sensors to the extracellular medium could provide a solution to these problems through the use of a functionalized substrate directly implantable in the culture medium forin vitrostudies.
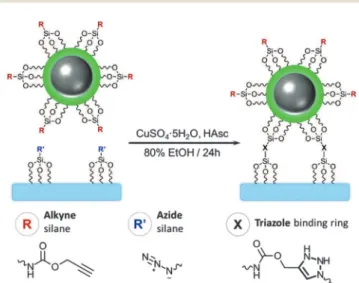
In this work, we used a ‘‘click’’ chemistry synthetic route to attach core–shell luminescent nanoparticles to silica surfaces with com-plementary silane-based functionalities (Fig. 1). The concentric architecture comprises a silver core with an average diameter of 6010 nm on which a silica shell with a thickness of 91 nm doped with ion-selective fluorescent molecules is grown (see the ESI† for a detailed description of the synthesis procedures). Ag@SiO2 -FiTC are very robust with regard to fluorophore leaking to the surrounding media, with insignificant losses after being immersed for 16 h in a phosphate buffer solution (see Fig. S1, ESI†). Several authors have shown that the presence of the silver core increases the local electric field intensity and allows efficient coupling between the oscillating electrons in the metal and the surrounding fluorophores. This results in an increase in the radiative rate and brightness, and the shortening of the excited state lifetime by the metal core improves the robustness with regard to quenching and photo-bleaching, because the faster radiative relaxation competes more effectively with collisional quenching and dissociation processes.5
Fig. 1 ‘‘Click’’ coupling scheme used to graft fluorescent silver core–silica shell nanoparticles (Ag@SiO2-FiTC NPs) onto a SiO2substrate. The complementary
silane moieties are permutable between both components. aDe´partement de chimie, Faculte´ de Sciences et Ge´nie, Universite´ Laval,
Que´bec (QC), Canada G1V 0A6. E-mail: [email protected]; Fax:+1 418-656-7916; Tel:+1 418-656-3287
bCentre d’optique photonique et laser (COPL), Universite´ Laval, Que´bec (QC),
Canada G1V 0A6
cLaboratoire d’e´tudes mole´culaires des valvulopathies, Institut universitaire de
cardiologie et de pneumologie de Que´bec, Universite´ Laval, Que´bec (QC), Canada G1V 4G5
†Electronic supplementary information (ESI) available: Synthesis procedures, UV-Vis and fluorescence spectra of core–shell nanoparticles and pH-sensitive surfaces, fluorescence ratiometry calibration curves and epifluorescence photo-graphs. See DOI: 10.1039/c4cc06075j
Received 8th August 2014, Accepted 9th September 2014
DOI: 10.1039/c4cc06075j
www.rsc.org/chemcomm
ChemComm
COMMUNICATION
Published on 09 September 2014. Downloaded by UNESP-ARAIQ on 08/05/2015 17:48:51.
This journal is © The Royal Society of Chemistry 2014 Chem. Commun.,2014,50, 13746--13749 | 13747
Other studies in the literature have employed the ‘‘click’’ grafting of proteins onto the surface of metallic nanoparticles as delivery devices.6The method has also been used on lamellar silica substrates to attach antibodies and polysaccharides for surface sensing.7The possibility of functionalizing both surfaces separately before combining them using the selective ‘‘click’’ reaction is important; by comparison, other coupling methods (e.g., EDC-NHS) can suffer from secondary reactions that decrease the effective yield. Since the stability of the triazole ring formed by [3+2] cycloadditions is well known on surfaces, various steps were chosen to maximize the homogeneity and luminescence intensity of the final analytical substrate. Ascorbic acid and copper sulfate were used as co-catalysers to generate CuI in situ; this oxidized copper is used to activate the terminal alkyne for the Huisgen cycloaddition.8 Even if the complementary silane moieties are permutable at will between both the Ag@SiO2NPs and the silica coverslips, the functionalization of alkyne silanes on core–shell nanoparticles leads to better grafting density whereas modification of the silica shell with the azide silane displays a less stable fixation (Fig. S2-A, ESI†). Although this high accessibility of the alkynes to catalytic CuIin suspension seems to improve the reaction kinetics and ultimately leads to a more homogeneous grafting, its efficiency was observed to increase rapidly with contact time (Fig. S2-B, ESI†). Binding of non-aggregated nanoparticles was confirmed by SEM and, as such, the fluorescence intensity of the resulting monolayer and its plasmonic extinction were highly uniform and repeatable from substrate to substrate (Fig. 2). In addition to Ag@SiO2 nanoparticles, Au@SiO2and In@SiO2NPs, as well as commercial Ludoxtsilica particles were also successfully grafted onto lamellar substrates using this strategy (see Fig. S3, ESI†).
Fluorescence measurements were performed with custom-made fluidic cells to study the effect of different biological buffers on the Ag@SiO2-FiTC grafted substrates. Fluorescein derivatives,e.g. fluor-escein isothiocyanate (FiTC), are well known for having a pH-dependent quantum yield, leading to a linear increase of emission intensity in the physiological pH rangeB5–8.9Other fluorophores,
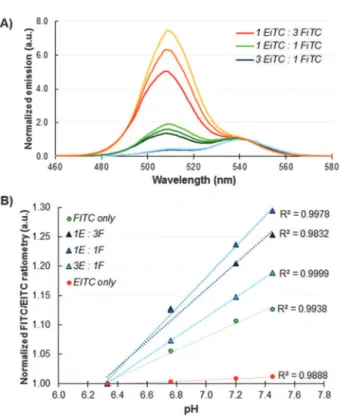
such as SNARF compounds, would also be suitable for the transduc-tion of pH in our nanosensors,10 and fluorescein was chosen because of its well-documented chemistry, wide availability and low cost. The versatility of the core–shell architecture, namely the possibility to bind any molecule with reactive moieties to form a fluorescent silane precursor, also allows mixing of distinct emitters on the same device without undesirable RET (resonant energy transfer) crosstalk and better control of the fluorophore-plasmonic core distance, whereas metal islands formed on surfaces are limited in these aspects.11To verify this possibility, mixtures of nano-biosensors doped with either FiTC or pH-insensitive eosin isothiocyanate (EiTC) were grafted on the same microscopy coverslips (Fig. 3A). Ratiometric normalization of the FiTC signal by proton non-sensitive EiTC minimizes the influence of instrumental errors (e.g., variations in grafting density or excita-tion light source intensity) and the response of the nanobiosensors to slight variations in pH tends to demonstrate the capability of small ions to diffuse through the silica shell and modify the local environment of the sensing moieties (Fig. 3B). Therefore, with subtle changes in the synthesis of the fluorescent NPs, it would be possible to use other ion-specific fluorophores and apply ratiometry
Fig. 2 Up: fluorescence image (lexc= 4896 nm,lem= 53620 nm) of
aB1 mm 2area on a substrate grafted with Ag@SiO2-FiTC (inset: the SEM
image of a representative region of the substrate (scale bar = 1mm)). Down:
fluorescence signal homogeneity across the substrate measured using 4and 20microscope objectives (S/N: signal-to-noise ratio).
Fig. 3 (A) Fluorescence emission of Ag@SiO2-FiTC and Ag@SiO2-EiTC
grafted onto the same coverslip in controlled proportions. Spectra from each color-coded group were measured at pH 6.2, 6.8 and 7.4 (e.g., from bottom to top). Spectra are normalized at EiTC maximum (543 nm); (B) linearity of the FiTC/EiTC ratiometric signal with pH.
Communication ChemComm
Published on 09 September 2014. Downloaded by UNESP-ARAIQ on 08/05/2015 17:48:51.
13748 | Chem. Commun.,2014,50, 13746--13749 This journal is © The Royal Society of Chemistry 2014 for multiplex detection in complex samples with increased sensitivity.
Immobilizing two distinct nanoparticle types,i.e.Ag@SiO2-FiTC and Ag@SiO2-EiTC, on the same substrate rather than a single type of NP doped with both fluorophores would minimize the possibility of energy transfer, since two NPs closer than the Fo¨rster distance for the FiTC/EiTC donor–acceptor pair would only allow a limited number of molecules to interact.
The intrinsic ratiometric properties of FiTC have already been used as a viable correction method to minimize experimental errors.10 The excitation spectrum of FiTC measured at pH values between 6.2 and 7.5 shows an isosbestic point and an inversion of sensitivity to pH at 470 nm (Fig. 4A), with maximum positive and negative sensitivity values recorded at 490 nm and 440–450 nm, respectively (Fig. 4B). The results presented in Fig. 4C show that ratiometric normalization (lexc= 490/440 nm,lem= 512 nm) results in a significant increase in sensitivity and linearity of the measure-ments as compared with measuring at a single excitation wavelength, and could also be used to correct for variations in device response from batch to batch. The procedure can also be easily ported to a fluorescence microscope equipped with appropriate excitation and emission filters (Fig. S4, ESI†). With modern commercial epifluores-cence microscopes capable of acquiring two successive images at different excitation wavelengths in as little as 0.2 s, ratiometric normalization can easily be implemented to minimize impact factors such as variations in excitation source intensity.
To demonstrate the use of Ag@SiO2-FiTC sensing surfaces for the measurement of extracellular pH, human cardiac fibroblasts were grown on a pH-sensitive substrate. This type of cell was chosen because of its good adhesive properties on surfaces in culture media, thus a close proximity between the cellular
membrane and the pH-sensitive surface is achieved. The adhesion of the cells everywhere on the functionalized substrates (Fig. S5, ESI†) suggests that protection of plasmonic silver cores with the dye-doped silica shell reduces the leaching of Ag+ions (a known cytotoxic species12) to tolerable levels. The fibroblasts were trans-fected with a plasmid incorporating a gene for the over-expression of carbonic anhydrase (CA12). CA12 enzymes are known to facilitate the solubilisation of extracellular aqueous carbon dioxide.13Since the membrane proteins are in close proximity to the SLC4A3 bicarbonate-selective transporters working with the gradient, the residual extracellular protons should induce a lowering of the local pH. The fibroblasts were also transfected to express green fluorescent proteins (GFP) as fluorescent markers to help with the identification of the cells on the microscope.
Unaltered, GFP- and GFP + CA12-transfected fibroblasts grown on pH-sensitive substrates in non-buffered cell culture media were imaged at an emission wavelength of 536 20 nm using two different excitation filters (489 6 nm and 436 5 nm). Images from five regions of each sample were recorded and threeB100mm2
regions of interest were selected in each image, 5–10mm away from
cell membranes. Ratiometric values were converted to extracellular pH values and are shown in Fig. 5. As predicted, the increase in cell membrane activity caused by the over-expression of CA12 enzymes led to noticeable acidification of the extracellular medium, i.e., from 7.00.1 to 6.40.1. This decrease in extracellular pH by CA12-transfected cells was confirmed by a separate flow cytometry experiment (see the ESI† for details). Similar pH values and uncertainties were measured in the extracellular space for unaltered and GFP-only cells.
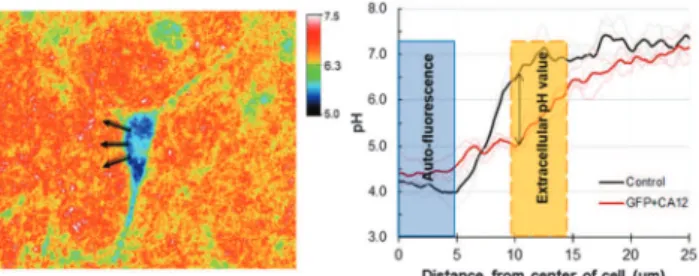
Fig. 6 shows spatially-resolved pH traces measured along a 5mm
wide track leading away from the cell membrane for unaltered and GFP + CA12 transfected cells. The lower pH values recorded inside the unaltered cell are probably due to the background signal from cytosolic GFP autofluorescence which partially overlaps with the emission of FiTC. This artefact can be avoided by using a cell membrane marker with a different emission wavelength range (e.g., mCherry). Interestingly, pH values measured in the extra-cellular space are free from interference from GFP and show a characteristic increase in pH with increasing distance from the cell,
Fig. 4 (A) Excitation spectra of Ag@SiO2-FiTC nanoprobes recorded
at various pH values; the fluorescence signal was collected on the low-energy wing of the emission band of FiTC at 576 nm. (B) Sensitivity to pH measured at different excitation wavelengths; the fluorescence signal was collected at the maximum emission wavelength (512 nm). (C) Emission intensity with excitation at 490 nm (blue) and 440 nm (red), and calculated ratiometric values (green) (lem= 512 nm).
Fig. 5 Left: fluorescence images (lexc= 4896 nm,lem= 53620 nm) and ratiometric pH images (lexc: 4896 nm/4365 nm,lem: 53620 nm) of transfected fibroblasts grown on a pH-sensitive substrate. Right: ratio-metric fluorescence values were measured in the regions identified by the yellow circles and converted to pH values. The error bars show standard error (N= 15). Control: unaltered cardiac fibroblasts. GFP: cells transfected with over-expressed intracellular GFP; GFP + CA12: cells transfected with over-expressed GFP and CA12 enzymes.
ChemComm Communication
Published on 09 September 2014. Downloaded by UNESP-ARAIQ on 08/05/2015 17:48:51.
This journal is © The Royal Society of Chemistry 2014 Chem. Commun.,2014,50, 13746--13749 | 13749
mirroring the diffusion of protons away from the membrane-bound CA12 enzymes, with a maximum difference between transfected and unaltered cells 5–10mm away from the membrane.
Transposition of ‘‘click’’ chemistry was successfully optimized to functionalize silica substrates with pH-sensitive fluorescent Ag@SiO2probes, thus producing uniform and highly luminescent transparent devices. Measuring extracellular ion concentrations using these planar sensors offers many advantages when com-pared to traditional alternatives. The fluorescent Ag@SiO2-grafted surfaces can be handled without prior training and the image processing ratiometry is easily transposable to any commercial epifluorescence microscope equipped with a camera and a basic software. The achievable spatial resolution is determined by the diffraction-limited footprint of the microscope objective and can be as small as 1mm. Because fluorescence lifetimes are notably
faster than biological mechanisms, these pH-sensitive devices can be used to study the kinetics of metabolic pathways with high temporal resolution. Moreover, plasmonic enhancement of fluorescence in core–shell nanoparticles increases lumines-cence intensity and resistance to photobleaching, thus allowing the prolonged analysis of cellular metabolism processes. Stable clicking of the nanoparticles on complementarily functionalized substrates nullifies the migration of ion-selective fluorophores to the cytosol and any associated cytotoxicity issues,14and is relevant to the study of a variety of adhesive eukaryote cells or bacterial organisms. Finally, the versatility of the fabrication procedure could lead to even more precise and more sensitive planar sensors using, for example, pH-sensitive fluorophores emitting at longer wavelengths – where auto-fluorescence interference in transfected
cells is minimal – or fluorophores sensitive to other physiological ions of interest (Mg+, Na+, K+, Ca2+, Cl ).
This work was supported by the Natural Sciences and Engineering Research Council of Canada, the ‘‘Fonds de la Recherche du Que´bec – Nature et Technologies’’ and the Canadian Foundation for Innovation. The authors would also like to thank M. Stephan Gagnon for help with the SEM images, and Prof. Y. De Koninck for inspiring discussions about cellular imaging.
Notes and references
1 B. A. Webb, M. Chimenti, M. P. Jacobson and D. L. Barber,Nat. Rev. Cancer, 2011,11, 671.
2 C. Geinberger and A. Konnerth,Neuron, 2012,73, 862.
3 (a) M. E. O’Leary and J. C. Hancox,Br. J. Clin. Pharmacol., 2010,
69, 427; (b) D. I. Harjes, M. Dubach, A. Rosenzweig, S. Das and H. A. Clark,Macromol. Rapid Commun., 2010,31, 217–221.
4 C. E. Bradburne, J. B. Delehanty, K. B. Gemmill, B. C. Mei, H. Mattoussi, K. Susumu, J. B. Blanco-Canosa, P. E. Dawson and I. L. Medintz,Bioconjugate Chem., 2013,24, 1570.
5 (a) C. D. Geddes and J. R. Lakowicz, J. Fluoresc., 2002, 12, 121; (b) K. Aslan, I. Gryczynski, J. Malicka, E. Maveeva, J. R. Lakowicz and C. D. Geddes,Curr. Opin. Chem. Biol., 2005,16, 55; (c) M. L. Viger, L. S. Live, O. D. Therrien and D. Boudreau,Plasmonics, 2008,3, 33;
(d) J. Yang, F. Zhang, Y. Chen, S. Qian, P. Hu, W. Li, Y. Deng, Y. Fang, L. Han, M. Luqman and D. Zhao,Chem. Commun., 2011,
47, 11681; (e) L. Rainville, M.-C. Dorais and D. Boudreau,RSC Adv., 2013, 3, 13953; (f) F. Magnan, J. Gagnon, F.-G. Fontaine and
D. Boudreau, Chem. Commun., 2013, 49, 9299; (g) D. Brouard, O. Ratelle, A. G. Bracamonte, M. St-Louis and D. Boudreau,
Anal. Methods, 2013,5, 6896; (h) Z. Bai, R. Chen, P. Si, Y. Huang,
H. Sun and D.-H. Kim,ACS Appl. Mater. Interfaces, 2013,5, 5856. 6 P.-C. Lin, S.-H. Ueng, S.-C. Yu, M.-D. Jan, A. K. Adak, C.-C. Yu and
C.-C. Lin,Org. Lett., 2007,9, 2131.
7 (a) L. Huang, S. Dolai, K. Raja and M. Kruk,Langmuir, 2010,26, 2688;
(b) P.-C. Lin, S.-H. Ueng, M.-C. Tseng, J.-L. Ko, K.-T. Huang, S.-C. Yu, A. K. Adak, Y.-L. Chen and C.-C. Lin,Angew. Chem., Int. Ed., 2006, 45, 4286; (c) D. I. Fried, A. Schlossbauer and T. Bein,
Microporous Mesoporous Mater., 2012, 147, 5; (d) S. Prakash, T. M. Long, J. C. Selby, J. S. Moore and M. A. Shannon,Anal. Chem., 2007,79, 1661; (e) N. K. Devaraj and J. P. Collman,QSAR Comb. Sci., 2007,11–12, 1253.
8 (a) V. V. Rostovtsev, L. G. Green, V. V. Fokin and K. B. Sharpless,
Angew. Chem., 2002,114, 2708; (b) V. O. Rodionov, V. V. Fokin and
M. G. Finn,Angew. Chem., 2005,117, 2250.
9 Y. Tian, E. Fuller, S. Klug, F. Lee, F. Su, L. Zhang, S.-H. Chao and D. R. Meldrum,Sens. Actuators, B, 2013,188, 1.
10 E. D. Wieder, H. Hang and M. H. Fox,Cytometry, 1993,14, 916.
11 J. Malicka, I. Gryczynski, J. Kusba, Y. Shen and J. R. Lakowicz,
Biochem. Biophys. Res. Commun., 2002,294, 886.
12 (a) D. Tiedemann, U. Taylor, C. Rehbock, J. Jakobi, S. Klein, W. A. Kues, S. Barcikowski and D. Rath, Analyst, 2014,139, 931; (b) C. Leclerc and K. L. Wilkinson, Environ. Sci. Technol., 2014,
48, 358.
13 C. P. S. Potter and A. L. Harris,Br. J. Cancer, 2003,89, 2.
14 J. Guo, S. Xiong, X. Wu, J. Shen and P. K. Chu,Biomaterials, 2013,
34, 9183. Fig. 6 Left: ratiometric pH image (lexc: 4896 nm/4365 nm,lem:
53620 nm) of a GFP + CA12 transfected cell on a pH-sensitive substrate. Right: pH values measured along 5mm wide tracks leading away from
the cell membrane (shown by the arrows) are compared for unaltered (control) and GFP + CA12 transfected fibroblast cells. Thick lines show averaged pH values. The blue and yellow boxes designate regions inside and outside the cell, respectively.
Communication ChemComm
Published on 09 September 2014. Downloaded by UNESP-ARAIQ on 08/05/2015 17:48:51.