Study of poling behavior of biaxially stretched poly(vinylidene fluoride) films
using the constantcurrent corona triode
José A. Giacometti, P. A. Ribeiro, M. Raposo, J. N. MaratMendes, J. S. Carvalho Campos, and Aimé S. DeReggi
Citation: Journal of Applied Physics 78, 5597 (1995); doi: 10.1063/1.359682 View online: http://dx.doi.org/10.1063/1.359682
View Table of Contents: http://scitation.aip.org/content/aip/journal/jap/78/9?ver=pdfcov Published by the AIP Publishing
Study of poling behavior of biaxially stretched poly(vinylidene
fluoride)
films using the constant-current
corona triode
Jo& A. Giacomettia)
Institute de Fisica de SZo Carlos, Universidade de &io Paulo, CP 369, 13560-970 SZo Carlos, Se Brazil
P. A. Ribeiro, M. Raposo, and J. N. Marat-Mendes
Faculdade de Ci&cias e Tecnologia, Universidade Nova de Lisboa, Torre 2825, M. Caparica, Portugal
J. S. Carvalho Campos
Institute de Geocikias e Cikias Exatas, Universidade Estadual Paulista, CP 178, 13503-200 Rio Claro, SP, Brazil
Aim6 S. DeReggi
National Institute of Standards and Technalogy, Polymers Division, Gaithersburg, Maryland 20899
(Received 21 February 1995; accepted for publication 11 July 1995)
This article reports systematic results of corona poling measurements obtained on biaxially stretched polyvinylidene fluoride films charged in dry air. Charging was performed using the constant current corona triode. The dependence of the poling process on the sample thickness, charging current, and successive charging processes was investigated. Phase transitions from (Y to Sand to p phases were observed when virgin samples were corona charged. The thermal pulse technique showed that the polarization profiles during charging can be made consistently almost uniform and that the ferroclectric reorientation can be associated with the rising plateau region displayed on potential
buildup curves. 0 1995 American Institute of Physics.
I. INTRODUCTION
Since the publication of Kawai’s work in 1969,’ piezo- electric and pyroelectric properties of poly(vinylidene fluo- ride) (PVDF) have been studied extensively because of their scientific2 and technological interest.3 PVDF is a semicrys- talline polymer that may exist in five different crystalline phases (a, j3, 8, ‘y, and E):.’ The ferroelectric p phase is readily obtained by stretching the melt-crystallized (Y phase. When poled, it is the phase with the strongest piezo and pyroelectric activity originating from poling induced ferro- electric polarization associated with the alignment of dipoles in crystals. In addition to dipolar orientation, the application of a high poling field (e.g., 300 MV/m) produces a transition from the nonpolar CY PVDF to the polar S PVDE6 For still higher poling fields (above 300 MV/m) a transition to j3 PVDF is obtained.7
In corona charging, a metallic grid is inserted between the sample and the corona point source. Such a configuration forms a so called corona triode, which permits control over the charging process.” Recently, the corona triode was im- proved to allow charging samples under constant current by controlling the grid voltage.” The sample potential as a function of time can be readily determined from the grid voltage.13 As a poling method, the constant-current corona triode is a good means of obtaining information on charge storage and transport, and on electric polarization processes in dielectric foils?T’4
Several techniques have been used for producing an electric field in PVDF films. In samples with metallic elec- trodes on opposite surfaces, a known dc potential difference between the electrodes may be applied by means of a high- voltage supply. In the case of “hysteresis poling,” a periodi- cally varying bipolar voltage exceeding the positive and negative coercive fields is applied.* In “corona poling,” ions generated by a corona discharge can be used for charging the sample surface and no electrode is required on the sample surface exposed to the corona charges. Often cited advan- tages of corona poling’ are that nonmetallized samples can be poled to high fields in spite of localized breakdowns” and that the technique is well suited for large scale film poling.
In spite of the popularity of corona charging, the prepon- derance of experimental data has been obtained using setups without any charging control. This article gives an overview of the poling kinetics in biaxially-stretched PVDF films charged with constant current. It seeks to clarify the relation- ship between the potential buildup curves, polarization switching, and phase transitions. X-ray diffractograms mea- sured during the first charging of biaxially stretched PVDF (mixture of (Y and /3 phases) allowed the observation of the well-known phase transformation from the a phase to the S phase and at higher electric fields, to the p phase. Thermal pulse (TP) measurements were also performed to investigate the development of polarization-depth profiles for different charging times. Comparison of the TP results with potential buildup curves show that the rising plateau region is an in- dication of switching of the ferroelectric polarization of the sample.
II. EXPERIMENT
‘lElcctronic mail: [email protected]; This work was done during In the following sections, a brief description is given of the author’s stay at NIST. the experimental techniques employed in this work, namely
I \
‘0 I
monitoring the air humidity inside the chamber. Samples can .- . .
be charged to a maximum voltage of about +8 kv. Above
this voltage, Paschen discharges occur inside the triode setup.
__ ,,,pJ
----
-&SAMPLE
t
vo v,
FIG. 1. Schematic circuit of the constant current corona triode setup. V, and V, are produced by dc high-voltage supplies. V, is used in the programming voltage mode and V, in the constant current mode delivering a current I, to the corona point.
the constant current corona triode method, the thermal pulse technique (TP) and x-ray diffraction. Measuring conditions and sample characteristics are also given.
A. The constant current corona triode
A schematic circuit of the constant current corona triode is shown in Fig. 1. It consists of a corona point, a metallic grid and a sample holder consisting of a central electrode and a guard ring. These are mounted inside a cylindrical chamber (not shown) so that different atmospheres can be used during the charging process.
A dc supply of high-voltage, V, , gives a corona current, I,. The sample charging current, I,, is kept constant by con- trolling the grid voltage by means of a feedback current con- trol circuit. This circuit compares the charging current from the measuring electrode with a reference signal and drives the voltage supply, Vg , (voltage-programmed supply). Any deviation from Ia in the charging current is compensated by a variation of Vg .
The sample potential, V(f), can be obtained by measur- ing the grid voltage, Vg , related to V(r) by
V(f) = vgw - vs ,
where V, is the potential difference across the gap between the grid and the corona-exposed sample surface. V, has a constant value during the charging process and is determined prior to each charging operation. A detailed description of the corona triode used in this work is given in Ref. 13 and a general overview of the method is presented in Ref. 9.
Charging operations were performed at room tempera- ture (approximately 25 “C) using dry air in the corona cham- ber. The corona chamber was first evacuated to lo-’ Pa and filled with dry air from a gas cylinder (80% and 20% of N, ami O,, respectively). A capacitive sensor was used for
Prior to charging, the sample surface charge was neutral- ized by exposing it to a corona discharge of opposite polarity with no voltage applied to the grid (from now on referred to as the neutralization process).
B. The thermal pulse technique
TP measurements involved applying heat pulses onto one of the two metallized surfaces of the sample. A modified Q-switched ruby laser is used to apply thermal pulses on 100 ns duration to either of the metallized surfaces. The absorbed heat, initially concentrated sharply on the incident electrode, diffuses through the entire thickness of the sample generating an electric response. The charge flowing in an external cir- cuit, the TP response, is measured with the sample short- circuited through a charge amplifier with its output con- nected to an electronic digitizer.
A pair of response signals is obtained in the TP measure- ments. The first corresponds to the application of the thermal pulse to the corona-exposed surface and the second to the back surface. These two transient signals contain information about the polarization distribution, P(x), which may be ob- tained in a Fourier deconvolution process.‘5
The TP charge response for long times (i.e., t +r, r being the diffusion controlled thermal time constant of the sample) is related to the mean value of the ferroelectric polarization (P) or to the pyroelectric coefficient, p, through the equa- tions:
(2) where Tf is the final temperature (when equilibrium has been re-established at t+r) and p = ap( P). (P) and cyp , are de- fined as:
(P)=(
;) /oLP(x)dx,
a+ g!
(3) During poling, (P) depends on the electric field, E, whose value is also time dependent during the charging pro- cess. The total polarization induced in the sample at the end of a charging process, i.e., the remanent ferroelectric polar- ization, will be represented by P, to distinguish it from (P(E)).C. X-ray measurements
X-ray measurements were performed to detect phase transformations of the PVDF samples during the charging process. To obtain the x-ray diffractograms as a function of charging time the corona was interrupted after different charging times and the sample surface potential was neutral- ized. This procedure gives a null electric field in the sample which assures no further changes in the phase content. The x-ray apparatus employed Cu K,, Ni-filtered radiation and the diffractograms were obtained for x-ray diffraction in the interval of 15”C28<30”.
5598 J. Appt. Phys., Vol. 78, No. 9, 1 November 1995 Giacometti et al.
TABLE I. Characteristics of the biaxially stretched PVDF (before corona poling).
Thickness (wd
6 9 12 25
Ratio of p to a Degree of phase crystallinity
(%) (8)
31 44
29 44
45 42
51 43
D. Samples
The samples were taken from rolls of 12 and 25-pm- thick, biaxially stretched, capacitor grade, PVDF film manu- factured by the Kureha Chemical Industry Company, Ltd.16 and supplied without electrodes. The degrees of crystallinity of the samples were determined by fitting the x-ray curves using Gaussian functions for crystalline reflection peaks and Lorentzian functions for the amorphous spectra. Table I shows that the degree of crystallinity is about 43% ‘for the 25 pm film. Only a relatively small number of control samples of 6 and 9 pm thickness were used. They contain a relatively smaller percentage of p phase when compared to 12- and 25-pm-thick samples.
Corona charging measurements were made on nonmet- allized samples (electrodes were deposited after corona charging for TP measurements). Previous workI showed no differences between results in samples with and without elec- trodes on both surfaces. Samples were clamped between two metallic rings and placed on the sample holder of the corona triode having a central electrode with an area of 1.8 cm2. A guard ring was used to prevent spurious current from reach- ing the central measuring electrode.
For the TP measurements, which were performed after corona charging, both sample surfaces were metallized with 100 nm thick, vacuum-evaporated aluminum coatings. Elec- trodes had a circular part with an area of 1.27 cm2 with tabs for making electrical connections to the TP sample holder. The tabs were made 0.2 cm wide extending 0.3 cm radially outside the circular part.
111. SURFACE POTENTIAL BUILDUP
A. General characteristics of potential buildup curves
Figure 2 shows the surface potential V(t) versus time for
lZym-thick PVDF samples charged in dry air. Curve I cor-
responds to V(r) during the first positive corona charging cycle using an as received sample. After each charging op- eration, the sample surface charge was neutralized. Curves II and III refer to the subsequent negative and positive corona- charging processes on the same sample. Curve IV corre- sponds to the fourth corona-charging process obtained with the same polarity as that used for the previous charging, Curve III. As discussed in previous workI the rising plateau region of V(r) in Curves I, II, and III is considered as a manifestation of ferroelectric switching. This is because the development of dipolar charge due to ferroelectric switching partly compensates the surface charge delivered by the co-
0 200 400 600 600 1000 CHARGING TIME (s)
FIG. 2. Potential buildup curves for a 12-pm-PVDF sample charged with 230 n4. Curve I corresponds to the first positive charging performed with a sample as received. Curves II and III correspond to subsequent charging with negative and positive corona polarity, respectively. Curve IV is a fur- ther subsequent charging but with the same polarity as for Curve IQ. Be- tween the charging steps, the sample surface charge was neutralized.
rona, thus resulting in the decrease of the potential buildup rate. In Curve IV, obtained with the same polarity as the immediately preceding charging, no rising plateau is ob- served since the dipoles are already oriented in the electric field direction and there is no change in the sample polariza- tion.
As pointed out in previous work18 the plateau length At, gives twice the value of the remanent polarization P,.
Evaluation of Arp of Curve II in Fig. 2 gives At,-800 s
which corresponds to a charge density Q=l,Ar,/A
=2PF= 130 mC/m2. Thus, the value Pp65 mC/m2 is in
good agreement with the published values for PVDE8’i9 This estimate assumes that the charge leakage through the sample is negligible as is the case for measurements in dry air.
It is worth noting that the potential buildup depends on the relative humidity.” Measurements performed in humid air showed that after long times of corona charging, V(r) saturates and its final value is inversely proportional to the air humidity.‘7 In dry air, as used in this work, V(r) rises continuously after the plateau, until electric breakdown oc- curs in the sample or until Paschen discharge occurs inside the setup (when V(r) reaches about 8 kV). Such a steady increase of potential indicates that the electric conduction in dry air is negligible.‘*
Curves II and III of Fig. 2 also show that V(r) is inde- pendent of corona polarity (also observed in humid air17). Thus, the potential buildup curves obtained with different polarities can be readily compared.
In hysteresis poling of PVDF, several cycles are neces- sary to obtain reproducible hysteresis 100~s.~ Figure 3 shows that in corona charging a similar behavior is observed (the first charging is not shown), with several charging processes being required for the potential-buildup curve to reach a re- producible shape. Curves obtained during the 2nd, 3rd, 5th, and 7th subsequent charging processes show that the poten- tial buildup rate tends to decrease until they are very similar. The systematic increase in At, (smaller than 10%) with the number of charging cycles corresponds to a gradual increase in the polarization P,. This is consistent with hysteresis measurements that show that the remanent polarization in- creases for several cycles.*
5’
250 d$3 200
5 150
p
P 1,
> ‘00 50
0
0 200 400 600 800 iooa 1200 0 0 200 400 600 800 loo0 CHARGING TIME (s) CHARGING TIME (s)
FIG. 3. Potential buildup of a 12 q PVDF sample submitted to successive
charging cycles with 230 nA. FIG. 5. Potential buildup plotted as electric field, V(t)lL, vs charging time for samples of 12 and 25 pm thickness. Charging current: -30 tu4.
V(t) curves are also sensitive to the interval of time between the charging cycles. Curve I of Fig. 4 was obtained immediately after a previous charging process while Curve II was obtained after the sample had been stored for approxi- mately one day following the previous charging process. The main difference lies in the very beginning when Curve II shows a higher slope than Curve I. The difference can be explained by assuming the existence of a polarization, P,, which decays after the electric field has been removed. After an immediate recharging, P, is still undiminished and its reorientation by 180” will contribute to the neutralization of the incoming charges by 2P, (slow increase). For a long storage time, PR disappears. In this case, the reorientation contribute P, to the neutralization, instead of 2P,, produc- ing a faster increase in potential at the beginning compared to Curve I. Evidence of this slowly varying polarization is also provided by the observation of a potential recovery (re- turning voltage) after neutralization of a charged sample.
B. Dependence of the potential buildup on the
sample thickness
Figure 5 shows curves of E(t) = V( t)lL when t is the
charging time for 12- and 25pm-thick samples. As can be
seen, the curves are almost identical. Comparison of several measurements showed that no systematic deviations occur. Since the plateau length At, is proportional to P, and its height corresponds to the coercive field, E, , the good repro- ducibility of E( t) indicates that the ferroelectric properties of these samples are almost independent of their thickness. We
can therefore analyze surface potential results without refer- ence to the sample thickness (for 12 and 25 pm). The same is not true of the 6- and g-pm-thick samples. In subsidiary experiments, we observed that V(t) curves (not shown here) for these samples systematically deviate from those of Fig. 5. Even though the plateau is still observed, it occurs at a higher voltage and is longer in the 6 and 9 ,um samples. It is possible that in the latter samples the ratios between the cy and p phases are different from those of the 12 and 25 ,um samples (see Table I), leading to different values of P,. Thus, results for the 6- and g-pm-thick samples will not be further presented here.
C. Dependence on the charging current
The dependence of the potential buildup on the charging current during polarization buildup is shown in Fig. 6. Mea- surements were performed using only one 12 pm sample that was first subjected to several charging cycles. This procedure eliminated the discrepancies in the curves for the first charg- ing processes (see Fig. 4), therefore permitting a direct com- parison of curves for different charging currents. Figure 6 shows clearly that the length of the rising plateau region decreases when the charging current is increased (i.e., the length of time required to reverse the ferroelectric polariza- tion decreases with increasing currents).
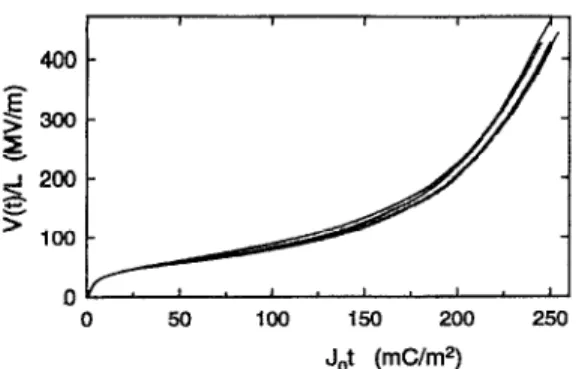
Figure 7 shows the same data as Fig. 6 but now with plots of, V(t) versus the charge Q(t) = Z,t. A master curve is obtained which shows that the total charge necessary to pole
4- s
Y 1
-t 5 3-
9 . : ,’ - 5
F 2-
~~/5’ ,” 2 II
!!I
// ..:v Il. I-
3 I
J d. .---@-- ;.. 0
0 200 400 600 800 1000 1200 0 300 600 900 1200 1500 CHARGING TIME (s) CHARGING TIME (s)
FIG. 4. Potential buildup of a 12 ,um PVDF sample. Curve I obtained with PIG. 6. Potential buildup curves for several values of charging current. an immediately recharged sample. Curve II for a sample stored for 1 d after Sample thickness: 12 pm. Curves obtained using negative corona. Values of the previous charging process. Charging current: 30 n4. the current are given in the figure.
5600 J. Appl. Phys., Vol. 78, No. 9, 1 November 1995 Giacometti et al.
409 P 3300 k St *O” es ’ 100
0
0 50 100 150 200 250 Jot (mC/m2)
FIG. 7. Potential buildups in Fig. 6 plotted as electric field, V(t)/L, vs the total charge density, Jot, deposited on the sample. This universal curve is similar to that of Fig. 4.
the sample, which corresponds to the plateau length, is inde- pendent of the charging current. As discussed in Ref. 20, for a ferroelectric sample with negligible conduction, Q(t) can be expressed as
Q(t) = CVt) +A(PW)), (4) where (P(E)) is a field-dependent mean polarization and the electric field E is dependent on the charging time t. (P(E)) is defined in Eq. (3). As shown in Ref. 20 the introduction of an electric conduction in Eq. (4) destroys the universality of Q(t) in Fig. 7. Thus, E$. (4) confirms our previous conclu- sion from Sec. III B that PVDF samples charged in dry air have negligible conductivity. This permits the determination of changes in (P(E)) fr om V(t) curves although for absolute values to be obtained it is necessary to know the initial value of (P) at the beginning of charging.
IV. X-RAY DIFFRACTOGRAMS
The evolution of x-ray spectra for voltage poled PVDF is well known.7 Here we present the evolution as a function of potential buildup for corona poled PVDF. Figure 8 shows the x-ray scans as 3D surface plots, displaying the evolution of the x-ray pattern as a function of electric field buildup V(t)ld. These measurements were taken with 12-pm-thick PVDF samples that were negatively poled for the first time (similar x-ray patterns were obtained for 25-pm-thick samples, not shown here). As discussed later, subsequent charging operations do not produce significant further changes in the x-ray patterns. After charging a given sample for the desired time, its surface potential was neutralized. The first curve of Fig. 8, for instance, corresponds to the null electric field because it refers to a virgin sample (i.e., never charged). Virgin samples contain a and /3 phases as demon- strated by the peaks in the diffractograms at the following values of 28:
(i) 17.9” and 18.4” corresponding to the reflections of
planes (100) and (020), respectively, of the a phase;
(ii) 20’ corresponding to the plane (110) of the a phase; (iii) 20.8” corresponding to unresolved reflections of planes
(1 IO) and (200) of the fl phase; and
(iv) 25.8” (not shown in the figure) corresponding to the plane (120) of the a phase.
INTENSITY (A.U.)
BRAGG ANGLE 213’
FIG. 8. Dependence of x-ray diffractograms on the poling electric field. PVDF samples 12-q-thick were negatively charged with -30 n4. The curve corresponding to a null electric field (on the front) refers to the x-ray pattern obtained from a virgin sample.
As Table I shows, the degree of crystallinity of the samples is about 43% while the ratio between p phase and a phase is 45% for the 12-pm-thick sample.
Subsequent curves indicate a transition from the a phase to the S phase and in a second stage the transition of the already created S phase to the p phase, in agreement with the results reported by Davis et ~1.~ X-ray curves for intermedi- ate electric fields up to 300 MV/m show that the peaks at
17.9” and 18.4” disappear almost completely indicating that the sample no longer possesses the a phase component (the same happens with the peak at 25.8”). Since the peak at 20” increases up to a maximum amplitude for electric fields of the order of 500 MV/m, it follows that the nonpolar a phase was converted almost completely to its polar counterpart, the Sphase. For higher fields, larger than 500 MV/m, the peak at 20” tends to disappear and the peak at 20.8” increases, indi- cating that the S phase is being transformed into the p phase. It is also evident that the modification towards the /I phase increases slowly in the range from 0 to 500 MV/m, but the p content grows rapidly when the field is larger than 500 MV/m. Thus, phase transformations tend to produce a sample with p phase content only. Similar conclusions were also obtained with FTIR measurements.‘l
As described above, remarkable modifications in the x-ray patterns were observed when the sample was charged for the first time. For further charging operations no recog- nizable changes in the x-ray patterns were noticed, thus in- dicating no significant variation of the phase contents. This result agrees with the fact that on the successive charging cycles shown in Fig. 3, V(t) curves present plateau lengths At, which do not differ significantly (within 10%). At, is proportional to P, , and hence to the ferroelectric phase con- tent. Such phase transformations are clearly stable since no modifications of x-ray scans were noticed even several months later.
V. THERMAL PULSE (TP) RESPONSE
We present the TP responses for 25-pm-PVDF samples. They have a larger thermal time constant compared to those for 12 pm samples which makes it easier to analyze the experimental results. Different samples were used and they
71 I I 12.0
(4
.A-& CORONA CHARGING TIME (s)
@ cv- *lo .o _ 200 . *oo .I00
zs- . . 0
~~~~
_ so0 .I000 1200
4 $5-
.
IQ 6 .
5
.
4-
/)!
1.5
1.0 3 3 E
0.5 2
- 2
“E 2 “2 !$3- . . 0.0 k
.3
1':
/ 0 .;: ; o’i’
2e
2 2-L
. / -0.5 ;
. a”
3
. -1.0
v/ ‘-
2 . -1.5
P -1. CORONA SIDE ! : 0 ‘/ 0 200 400 800 800 1000
1 J
-2.0k -2 CHARGING TIME (s)
(f-4
, aa CORONA CHARGING TIME (3)
1200
2 -1’
a BACK ELECTRODE SlOE
F -2 ’
FIG. 9. Thermal pulse transients obtained after interrupting the charging process at different times. (a) corresponds to the data obtained applying the thermal pulse on the sample side exposed to corona ions. (b) data obtained applying the thermal pulse on the opposite side.
were first positively charged using +30 nA up to +7 kV and then neutralized. TP measurements were performed with samples negatively charged, -30 ~4, at different times (the increment was 90 s).
Figure 9 shows the TP transients for different time inter- vals of corona charging. The curves in Fig. 9(a) were ob- tained by applying the thermal pulses to the sample surface exposed to the corona ions, while in Fig. 9(b) results are shown for the thermal pulse applied to the opposite surface, the converse case. The steplike nature of the TP transients indicate that the sample is uniformly poled during the dipole switching. This result establishes that during poling there are no injected or pre-existing charges available for conduction. This is consistent with the independence of the potential buildup on the corona polarity (Sec. III A and III C). This is a remarkable result which is probably due to the use of an extremely dry and well characterized corona atmosphere. Previous TP results on similar samples charged in ambient air showed very different polarization profiles sensitive to corona polarity.** Since space charge injection is negligible, the electric field in the sample is almost uniform. The round- ing in the beginning of the TP curves indicates a small non- uniformity near the surfaces. An approximate calculation, us-
ing SIL-(t/r)“2 (Ref. 22) (8 is the diffusion length)
indicates that the nonuniformity extends to less than 10% of the sample thickness. This value is smaller than the -25% observed for samples charged in humid air2*
Figure 10 shows the dependence of the long-time TP response, q( tB r), on the charging time. The data were taken from Fig. 9 at 9 ms which is much larger than the diffusion relaxation time, 7, which is 1 ms for 25-pm-thick samples. From these data it is possible to follow the polarization
FIG. 10. The long-time response (obtained from the data in Fig. 9) depen- dence on the charging time. The continuous curve corresponds to the poten- tial buildup of a 25 pm sample charged with 30 n4.
switching during the corona charging process, from Eq. (2),
q(t%-T)=ap7’f(P). Hereafter, q(tBT) will be frequently re- ferred to as the mean value of (P). For reference, Fig. 10 also shows the corresponding V(t) curve of a sample charged with -30 nA. At short times, (P) is almost constant but when the potential reaches the plateau region, (P) de- creases with charging time until it reaches a saturation value at a high voltage. In the range between 100 and 900 s, which corresponds to the rising plateau region in the surface poten- tial curve, (P) decreases almost linearly with the charging time. This result supports the view that the rising plateau of V(t) curves is attributable to the polarization switching. The finding that (P) is linearly dependent on time is consistent with the fact that the deposited charge, Z,t, is being neutral- ized by the polarization, since during the plateau A(P) is much larger than C V( t) .
In Fig. 11, the data in Fig. 10, apr,-(P), are plotted as a function of the electric field, E(t) = V( t)lL. The data corre- spond to the curve (P) versus E which contain, therefore,
the same information as polarization-voltage hysteresis
curves. The dashed line in Fig. 11 represents the theoretical response for a sample possessing a unique coercive field (E,= 120 MV/m). It can be seen from the experimental re- sults (open circles) obtained here that this hypothesis does not hold for PVDF, as the curve is far from a steplike re- sponse. From the experimental data in Fig. 11, the value of -120 MVlm corresponding to the coercive field is slightly
g;zJ <p”~
&
-2.01 I’.““““. -. - 1.. a 8 1. ““I 0 50 100 150 200 250
ELECTRIC FIELD (W/m)
FIG. 11. The long-time TP response (circles) dependence on the electric field during charging (the electric field values were taken just before the interruption of charging). The dashed line is the response for a sample with a unique coercive field. The full line represents (P(E)) calculated from Eq. (4) (arbitrary units).
5602 J. Appl. Phys., Vol. 78, No. 9, 1 November 1995 Giacometti et al.
larger than the 100 MV/m measured using the hysteresis method.’ The determination of the absolute value of P, is only possible with the calibration of TP measurements which were not performed in this work.
Figure 11 also shows the curve corresponding to (P(E)) calculated using Eq. (4) (full line). The scale which repre- sents (P(E)) was chosen to allow comparison of the results with the TP data. Although the agreement is good (P(E)) gives a smaller coercive field compared with the value ob- tained from TP measurements. The difference could be at- tributed to the fact that TP data were obtained after short circuiting the samples and (P(E)) derives directly from the potential buildup curves. At the beginning of charging the electric field increases more slowly than expected because of the effect of the reveriible polarization, as discussed in Sec. III A.
VI. CONCLUSION
This article describes a carefully controlled corona charging process for biaxially stretched PVDF films employ- ing the constant current corona triode. In dry air, 12-pm- thick samples were charged up to -8 kV which corresponds to an electric field of the order of 650 MV/m. Samples which are being charged for the first time undergo a phase transition from (Y to S and on a second stage, at fields above 300 MVlm, to the ,B phase.
The potential buildup curves exhibit a rising plateau which corresponds to ferroelectric polarization switching. Samples charged in dry air showed that V(t) versus time can be scaled to a master curve by plotting the electric field ver- sus the charge deposited onto the sample. The master curve was obtained for different charging currents regardless of sample thickness (12 and 25 pm) and polarity of charging. It was demonstrated that the electric conduction is negligible and the variation of the polarization during the charging could be determined using Eq. (4). The master curve also
indicates that the field-dependence (P(E)) exists which
means that the relaxation time for the dipole switching pro- cess is rather short when compared to the time scale of the experiments at each field value. Similar results were found in measurements with the copolymer P(VDF-TrFE).20
Measurements of TP responses indicated that the polar- ization distribution is almost uniform even during its switch- ing while the sample is being charged. This is expected only if the electric conduction is negligible and if no space charge is injected to distort the internal field. All transient curves are rounded for short times indicating small polarization deple-
tion near the surfaces. A careful inspection of the IT trau-
sients in Figs. 9(a) and 9(b) shows that the initial rounding is more pronounced on the side exposed to the corona ions. Fourier deconvolution of the TP responses has not sufficient resolution to account for such non uniformity. The number of Fourier coefficients which can be determined in the decon- volution process is about five.
The long-time TP response values, q( tS 7) = apTA P),
which also correspond to the sample pyroelectric responses, show that during the corona charging the polarization is switched to the reverse direction. Clearly, such a switching is associated with the rising plateau of the potential buildup curves.
ACKNOWLEDGMENT
The authors are grateful to FAPESP for partial financial support.
’ H. Kawai, Jpn. J. Appl. Phys. 8, 975 (1969).
*M. G. Broadhurst and G. T. Davis, in “Electrets,” edited by G. M. Sessler, Topics on Applied Physics, Vol. 33 (Springer, Berlin, 1987), p. 285. 3 “Medical Applications of Ferroelectric Polymers,” edited by P M. Galetti,
D. E. DeRossi, and A. S. DeReggi, Fermelectricity and Related Phenom- ena, Vol. 5 (Gordon and Breach, New York, 1988).
4T. Furukawa, Phase Transitions 18, 143 (1989). 5A. J. Lovinger, Macromolecules 18, 40 (1982).
6D. Naegele, D. Y. Yoon, and M. G. Broadhurst, Macromolecules 11, 1297 (1978).
‘G. T. Davis, J. E. McKinney, M. G. Broadhurst, and S. C. Roth, J. Appl. Phys. 49,4998 (1978).
*B. Dickens, E. Balizer, A. S. DeReggi, and S. C. Roth, J. Appl. Phys. 72, 4258, (1992).
9J. A. Giacometti and 0. N. Oliveira, Jr., IEEE Trans. Electron. Insul. 27, 924 (1992).
‘OP. D. Soutghate, Appl. Phys. Lett. 28, 250 (1976).
“R. A. Moreno and B. Gross, J. Appl. Phys. 47, 3397 (1976). “J. A. Giacometti, J. Phys. D Appl. Phys. 20, 675 (1987).
13J A Giacometti and J. S. Carvalho Campos, Rev. Sci. Instrum. 60, 1143 (1990,.
14G F Lea1 Ferreira and M. T. Figueiredo, IEEE Trans. Electron. Insul. 27, 719 (1992).
‘“F. I. Mopsik and A. S. DeReggi, J. Appl. Phys. 53, 4333 (1982). ‘6Commercial materials are identified to document the procedure. Their use
does not represent or imply recommendation or endorsement by NIST. “P A Ribeiro J A. Giacometti, M. Raposo, and J. N. Marat-Mendes, IEEE
Trans. Eleckon. Insul. 27, 744 (1992).
‘*N Alves J A. Giacometti, and 0. N. Oliveira Jr., Rev. Sci. Instrum. 62, 1840 (1992).
19T. Furukawa, M. Date, and E. Fukada, J. Appl. Phys. 51, 1135 (1980). ?N. Alves, G. Minami, J. A. Giacometti, G. F. Leal Ferreira, and 0. N.
Oliveira Jr., Ferroelectrics 150, 219 (1993). ” P. A. Ribeiro and M. Raposo (unpublished data).
“5. A. Giacometti and A. S. DeReggi, J. Appl. Phys. 74, 3357 (1993).
J. Appl. Phys., Vol. 78, No. 9, 1 November 1995 Giacometti et al. 5603