The strut-and-tie models are appropriate to design and to detail certain types of structural elements in reinforced concrete and in regions of stress concentrations, called “D” regions. This is a good model representation of the structural behavior and mechanism. The numerical techniques pre-sented herein are used to identify stress regions which represent the strut-and-tie elements and to quantify their respective efforts. Elastic linear plane problems are analyzed using strut-and-tie models by coupling the classical evolutionary structural optimization, ESO, and a new variant called SESO - Smoothing ESO, for inite element formulation. The SESO method is based on the procedure of gradual reduction of stiffness con -tribution of the ineficient elements at lower stress until it no longer has any inluence. Optimal topologies of strut-and-tie models are presented in several instances with good settings comparing with other pioneer works allowing the design of reinforcement for structural elements.
Keywords: strut and tie models, topology optimization, reinforced concrete structures.
Os modelos de bielas e tirantes são procedimentos de análise apropriados para projetar elementos de concreto armado em casos de regiões onde há alterações geométricas ou concentrações de tensões, denominadas regiões “D”. Trata-se de bons modelos de representação da estru-tura para avaliar melhor o seu comportamento estruestru-tural e seu mecanismo resistente. O presente artigo aplica a técnica da otimização topológica para identiicar o luxo de tensões nas estruturas, deinindo a coniguração dos membros de bielas e tirantes, e quantiica seus valores para dimensionamento. Utilizam-se o método ESO, e uma variante desse, o SESO (Smoothing ESO) com o método dos elementos initos em elas-ticidade plana. A ilosoia do SESO baseia-se na observação de que se o elemento não for necessário à estrutura, sua contribuição de rigidez vai diminuindo progressivamente. Isto é, sua remoção é atenuada nos valores da matriz constitutiva, como se este estivesse em processo de daniicação. Para validar a presente formulação, apresentam-se alguns exemplos numéricos onde se comparam suas respostas com as advindas de trabalhos cientíicos pioneiros sobre o assunto.
Palavras-chave: modelo de bielas e tirantes, otimização topológica, concreto armado.
The strut-and-tie models in reinforced concrete
structures analysed by a numerical technique
Análise de modelos de bielas e tirantes para estruturas
de concreto armado via uma técnica numérica
V. S. ALMEIDA a [email protected]
H. L. SIMONETTI b [email protected]
L. OLIVEIRA NETO c [email protected]
a Department of Structural and Geotechnical Engineering, University of São Paulo, São Paulo, Brazil, [email protected] b Department of Civil Engineering, Federal University of Ouro Preto, Minas Gerais, Brazil, [email protected]
c Department of Civil Engineering, Faculdade de Engenharia, UNESP, Bauru, São Paulo, Brazil, [email protected]
Received: 06 Feb 2012 • Accepted: 29 Oct 2012 • Available Online: 08 Feb 2013
Abstract
1. Introduction
In structural engineering, most concrete linear elements are de-signed by a simpliied theory, using the Bernoulli hypothesis. How-ever, the application of this hypothesis to any structural element can lead to over or under sizing of certain parts of the structure. This hypothesis is valid for parts of the frame that suffer no in-terference from rigid regions, such as sections near the columns, cavities or other areas where the inluence of strain due to shear efforts is not negligible.
Thus, there are structural elements or regions for which the as-sumptions of Bernoulli hypothesis do not adequately represent the bending structural behavior and the stress distribution. Structural elements such as beams, walls, footings and foundation blocks, and special areas such as beam-column connection, openings in beams and geometric discontinuities are examples. These re -gions, denominated discontinuity regions or D-regions, are limited to distances of the dimension order of structural adjacent elements (Saint Venant’s Principle), in which the shear stresses are appli-cable and the distribution of deformations in the cross section is not linear.
For a real physical analysis about the behavior of these elements, the use of the strut-and-tie model, a generalization of the classical analogy of the truss beam model, is customary. This analogy was shown by Ritter and Morsch at the beginning of the twentieth cen-tury, associated with a reinforced concrete beam in an equivalent truss structure. The discrete elements (bars) represent the ields of tensile (rods) and compression (compressed struts) stresses that occur inside the structural element as bending effects. This anal-ogy has been improved and is still used by technical standards in the design of reinforced concrete beams in lexural and shear force and devising various criteria for determining safe limits in its procedures.
In the 1980s, a Professor at the University of Stuttgart and oth -er collaborators presented sev-eral pap-ers that more adequately evaluate these D-regions. The pioneering work by Schlaich et al. [1] describes the strut-and-tie model more generally, covering the equivalent truss models and including special structural elements. The analogy used in the strut-and-tie model uses the same idea as that of the classical theory in order to deine bars representing the low of stress trying to create the shortest and more logical path loads. It is a simple model, but the designer’s experience is nec-essary to select and distribute the elements of the model in order to better represent this low of stresses; the use of more reliable and automatic tools is made evident for deining its geometric and structural coniguration by graphic and visual tools.
Numerical analysis has been providing these tools for years, with faster processing, new theories and formulations. Together with these tools, Topology Optimization (TO) techniques have been em-ployed via strut-and-tie models in reinforced concrete structures as shown in Ali [2], Liang and Steven [3], Liang et al. [4], Liang et al. [5], Liang et al. [6], Liang [7], Reineck [8] and Brugge [9].
TO is a recent topic in the ield of structural optimization. However, the basic concepts that support the theory have been established for over a century, as described Rozvany et al. [10]. The great ad-vantage of TO, as compared to traditional optimization methods, such as shape or parametric optimization, is that the latter are not able to change the layout of the original structure, therefore not
helping the project conceptual framework for designing adequate low stress.
In topological analysis, two methodologies are important: the micro and macro approach. The micro approach considers the existence of a micro porous structure, depending on its geometry and on the volumetric density of a unit cell representative of the material properties and its constitutive relations. These properties are rep-resented by continuous variables, successively distributed in the space of the extended ixed domain, which is a region where the structure can exist, (Stump, [11]). An example of this group is the SIMP (Simple Isotropic Material with Penalization) method, Bend -søe [12], Rozvany et al. [13] and [10].
In the macro approach, the topology of the structure is modiied by the insertion of holes in the ield. As an example of this TO group, ESO (Evolutionary Structural Optimization) can be mentioned, which is based on solving the objective function when an element is removed from the inite element mesh, and TSA (Topological Sensitivity Analysis), based on a scalar function, called derived topology, which provides the sensitivity of the cost function when a small hole is created for each set point in the problem domain (Labanowski et al., [14]).
In order to propose an effective tool for developing a strut-and-tie model, this work uses the TO technique called SESO (Smoothing-ESO) (Simonetti et al., [15]). This technique is a variant of ESO, whose philosophy lies in verifying if the element is not really neces-sary to the structure. The new contribution for the ESO technique is the reduction of stiffness until it no longer has any inluence. That is, the removal of elements is performed smoothly, reducing the values of the constitutive element of the array, as if it is in the process of damage and is capable of generating ideal members of a strut-and-tie model.
2. Evolutionary structural optimization
(ESO)
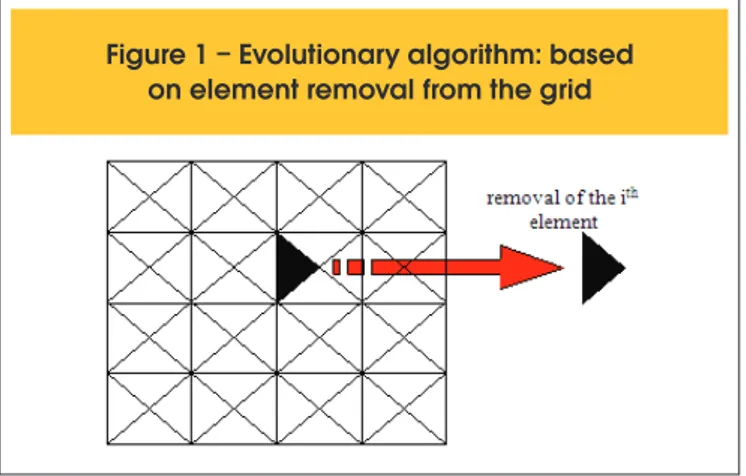
Xie and Steven [16] developed a very simple way to impose modi-ications on the topology of a structure, using a heuristic gradual removal in the mesh of the inite elements, corresponding to the regions that do not effectively contribute to a better performance of the structure.
An initial inite element mesh is deined circumscribing the entire structure, or extended domain of the design to include the boundary conditions (forces, displacements, cavities and other initial condi-tions). The parameters of interest for optimization are evaluated in an iterative process, particularly in this paper, to decrease the weight by a maximum stress criterion of the structure. Thus, the stresses of each element are evaluated by using the inequality [1a]:
(1a)
where
A
j is the area, 0* jW
is the mean energy of deformation, all for elements j, totalizing m elements, 0*W
is the mean energy of deformation of the structure, where “*” represents the point of minimization or a basic feasible solution. In short, each iteration path has become a new basic solution within a feasible region to the linearized problem. In view of eq. [3], the element that has the average energy of deformation close to the deformation energy of the structure can be said to have its partial derivative equal to zero, indicating that a stationary point has been reached.3. Smoothing evolutionary structural
optimization (SESO)
A relaxation condition, a “soft-kill” procedure or Smoothing ESO, is applied to the ESO method, in which the elements that should be removed by the ESO criterion - following inequality [1a] - are ar-ranged in n groups and allocated in order of increasing tensions being weighted by a function
0
≤
η
(
j
)
≤
1
. Then, a deined p% ofthese n groups is removed, and the groups that contain the ele-ments with the least stress (
Γ
LS domain), and (1-p%) are returned to the structure, theΓ
GS domain. This removal and return of ele-ments to the structure is performed by a function, either linear or hyperbolic, that weights the rate maxvm vm e
s s within the
Γ
domain; that is, it allows the high-stress elements (closest to maxvm s s but fulilling the ESO constraint in the
Γ
GS domain) to be reintegrated into the structure at each iteration path.The minimization of the objective function is achieved by inding a stationary region, and this is achieved when all the terms have the value zero gradient vector, that is, if the average energy of deformation of the element j 0*
(
W
j)
tends to the average energy of strain of the structure(
W
0*j)
, the term(
)
* 0 * 0
1
−
W
jW
in eq. [3]tends to zero. Thus, each term is understood to represent a vector element of the discretized structure. Tanskanem [17] also highlights the fact that the removal of an element can affect the convergence of the optimization procedure, because the criteria for withdrawal in the ESO is indicated by the attendance of inequality [1a], which can often be extreme, since there are elements that are left in the vicinity of this condition, which are numerically excluded, but they have strain energy equivalent to the structure; the gradient is thus also zero, but it should compose the gradient vector that deines the stationary point cited by Tanskanem [17]. Thus, the removal of an element drastically may unduly affect the way the optimum; one way to correct this devia -tion would be the possibility of inserting the element in the structure again. In this sense, a variant of the ESO, the BESO - Bidirectional Evolutionary Structural Optimization stands out, Querin [18]. SESO comes from this mathematically consistent philosophy, weighting the Young’s modulus (E), making the strain energy of the element in-creases, tending to the strain energy of the structure then the gradient tends to zero and the direction of the minimum is restored.
The elements near the limit maximum stress are maintained in the structure, deining the procedure for no “hard-kill” withdrawal, but so smoothing. The “soft kill” procedure used in the SESO tech-nique can be interpreted as follows:
(4)
ﮭ
i 0
D ( )
( )
0
ij GS
LS
D if j
j
D
if j
if j
where svmand svm are, respectively, the principal Von Mises stress of element “e” and the maximum stress effective structure in itera-tion “i” , RR is called the rejecitera-tion ratio, which is an input datum that is updated using the evolutionary rate: ER.
In each iteration path, the elements that satisfy the inequality [1a] are removed from the structure, Figure [1]. The RR factor is ap-plied to control the removal process in the structure (0.0 ≤ RR ≤ 1.0). The same cycle of removing elements by inequality [1a] is re-peated until there are no more elements that satisfy the inequality [1a]. When this occurs, a steady state is reached. The evolutionary process is deined by adding the ER. Thus, a new cycle begins, until there are no more elements to be eliminated with this new RR value. The RR factor will be updated according to equation [1b], to obtain an optimal coniguration, achieved by controlling a performance parameter, called the performance index (PI). This procedure is known as “hard kill” and can be interpreted as follows:
(2)
ﮭif j
( )
0 if j
D
D j
�
where
D j
( )
is the constitutive matrix of pointj
∈
Ω
,D
0 is the initial constitutive matrix,Ω
=
Γ
i+
Γ
i is the structure domain,Γ = Ω
i{
/ (
s s
e/
MAXVM( ))
Ω ≥
RR }
i is the amount of ele-ments that will not be removed from the structure (solid), and
{
/ (
/
MAX( ))<RR }
i i
s s
e VM iΓ = Ω − Γ = Ω
Ω
is the set of elements that are removed from the structure (creation of void), in the i-th iteration. In the removal heuristic via ESO, when the element is removed from the design domain during the evolutionary process, elements that remain in the structure represent a basic solution: the terms of the gradient vector are null. As reported by Tanskanen [17], the objective function is written in terms of thickness and it can be minimized such as:f
=
ln[
W
ext({ })] ln[ ({ })]
t
+
V t
, withW
ext being the work of external forces and V is the total volume. The partial derivative of the objective function to thicknesst
of element j is given by:(3)
m
j
where
W
W
V
A
t
f
j jj
,...,
2
,1
1
00*** *
due to Eq. [4] in terms of the constitutive matrix can be written in terms of thickness, due to the direct linear relation between them. In this context, the performance index in Eq. [7], which takes into account expression [4] in terms of each thickness and the regulat-ing function from the SESO procedure, is written as:
(7)
vm vm
0,max 0 0,max 0 0
vm vm
i,max i,max
1 1
σ
.
σ
.
PI=
.
=
.
σ
NE.
σ
NE. . ( )
j j j j
j j
A t
A t
A t
A t
j
where
t
0 is the initial thickness andt
j is the thickness of the thj
element at the ith iteration. The optimal control is obtained by this performance index, because it is a “monitoring factor” in the region optimal design. The control for maximizing this parameter refers to the minimization of the volume control; hence, if the PI falls markedly, it is a strong indication that it underwent a local optimum or stationary coniguration. However, there is no guar -antee that this is a global optimum, but a coniguration optimal for engineering design.
5. Numerical examples
Based on the formulation described in previous sections, a com-puter system was developed applying the SESO in conjunction with the inite element method, using a linear-elastic formulation for plane stress state analysis arising from free formulation (Bergan and Felippa [19]). Thus, some numerical examples are presented for evaluation and comparison of the conigurations obtained by the classical strut-and-tie models. The optimization parameters RR and ER, if not mentioned, are equal to 1% and deined as the regu-latory function
η
(
Γ
)
=
1
0
10−-4.5.1 Example 1
In this example discussed by [3], the SESO procedure is applied to ind the best topology for a bridge deck structure subjected to a uniformly distributed load. The design domain and the boundary conditions are shown in Figure [3a]. The bridge deck is central and it represents a region of non-project domain, which means that it cannot be removed with 180-meter long and 4-meter high dimen-sions, restricting the elements contained on the board. The uniform load is applied as concentrated forces, 500 kN per node. The bot-tom corners of the domain are constrained in the plane, Figure 3a. The Young´s modulus of the material is E = 200 GPa, the Poisson’s ratio is 0.30 and the thickness is 300 mm. Figure [3b] shows the optimal topology obtained by [3], using square inite elements, in-dicating a well-known “tie-arc” commonly used in the engineering design of bridges.
Figures [3c] and [3d] show the optimum topology obtained with the present formulation using a reined mesh with 180x60 elements. When designing bridge structures, the designer must consider a number of important aspects such as structural performance, economy, aesthetic and constructability.
The optimal topology seen in Figure [3c] was obtained due to boundary conditions applied to the length of the edges of non-de-sign domain which determines the bridge deck, while the boundary conditions imposed to achieve the optimal coniguration shown in where
Γ
=
Γ
ΓLS ++
ΓΓ
GS,0
≤
η
j( ) 1
Γ ≤
is the regulating function thatweights the value of the rate
s
evms
maxvm within theΓ
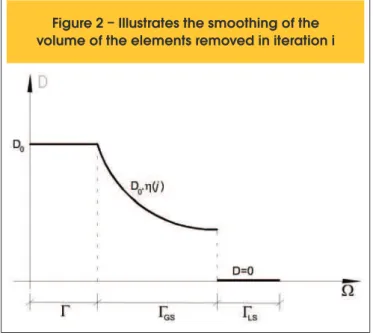
domain, and this procedure can eliminate the checkerboard problem.The proposed smoothing can be, for example, performed by
η
( )
Γ
using a linear function of the
η
( )
Γ =
α
j
+
β
type or a trigonometric function of theη
( )
Γ =
sen(
α
j
)
type. Because these two functions are continuous, they can be differentiated all over of theΓ
domain, and they have an image varying from 0 to 1, Figure [2].4. Performance index for the SESO
formulation
The performance index (PI) is a dimensionless parameter that mea -sures the structural performance eficiency. The problem consists in the minimization of the objective function in terms of weight, subject to an allowable stress constraint (σproject), which is deined as:
(5)
b 9
e e 1
,max
minimize W w ( )
subject to
-
0
e vm project j
t
where
NE
is the total number of inite elements. The PI was pro-posed by Liang et al. [5] as:(6)
0,max 0 0,max 0 0 0,max 0 i,max i i,max i i,max ivm vm vm
vm vm vm
i
W
V
V
PI
W
V
V
where
V
0 andV
i are the initial and ith-iteration volumes,ó
s0,max vmand s
ó
i,maxvm are the initial and ith-iteration maximum Von Mises stresses, and
ρ
0 andρ
i are the initial and ith-iteration densities, which are equal for an incompressible material. The smoothing generatedFigure [3d] also includes a constraint on the width of the non-de-sign domain which represents the bridge deck.
The optimal topology design shown in Figures [3c] and [3d] was obtained with a inal volume of 37.8% and 33.0%, where dark and light regions respectively indicate the compressed regions, strut, and tensioned regions, tie.
The optimal settings respectively shown in Figures [3c] and [3d] were determined with the same optimization parameters, except for the rejection and the evolutionary ratios. Thus, they were de-ined as RR =1% and ER = 1.05% in Figure [3c] and RR = 1.1% and ER = 0.9% in 3d. Note that the proposed algorithm is sensitive to the variation of these parameters, boundary conditions and the geometry of the element (Simonetti et al., [20]).
5.2 Example 2
The bridge pier shown in Figure [4] is designed to support four concentrated loads of 2750 kN transferred from four steel-con-crete composite girders. The bridge pier is clamped on the foun-dation. An initial thickness of 15 dm is assumed for this bridge pier. The Young’s modulus is
E
=
28600 MPa
and the Poisson’sratio is 0.15.
The optimal topology obtained and the strut-and-tie model pro-posed by Liang et al. [6], which used a method called PBO - Per-formance-Based Optimization, with 125-mm square, four-node, plane stress elements. Figure [5a] shows the optimal topology ob-tained by [6], and Figure [5c] the optimal topology obob-tained by the present formulation, SESO, using a reined mesh 170x90, totaling 18,064 triangular inite elements, where the lighter areas represent the ties. Figure [5b] shows the strut-and-tie model proposed by [6]. Table [1] shows the efforts obtained by [6] and by the present formulation for all the members shown in Figures [5b] and [5c]. It shows a great similarity between the responses obtained by both procedures with the same arrangement of bars originating from the strut-and-tie model as well as the efforts obtained at each member of the bridge pier, which can be designed and detailed following normative procedures.
Figure [5d] shows the main horizontal reinforcement bars extend -ed to the extremities in a range of 120 cm. Notes that the sum of the efforts in ties 1 and 2 is almost the same as that of tie 3. The vertical components of the efforts in inclined ties are balanced by vertical reinforcement bars which, as auxiliary reinforcements, are not displayed in Figure [5d].
5.3 Example 3
This example was reported by Schlaich et al. [1]. It is a simply supported deep beam with a large hole, the geometry and load (P) of which are presented in Figure [6], which is used as a do-main extended to the optimization process. The Young’s modulus is
E
=
20820 MPa
, the Poisson’s ratio is n = 0.15 and thethick-ness is
0.4
m
. The design strength of reinforced concrete is taken with values fyd = 434 MPa and fcd = 25 MPa. This structure has a D-region due to the geometric discontinuity corresponding to the cavity imposed by the design. In this case, this region should be evaluated using a strut-and-tie model.For modeling with the present formulation, 13,200 triangular
ele-Figure 3 – (a) Design domain of the bridge (b), Topology optimal proposed by [3],
(c) and (d) Topology optimal proposed by the present formulation (SESO)
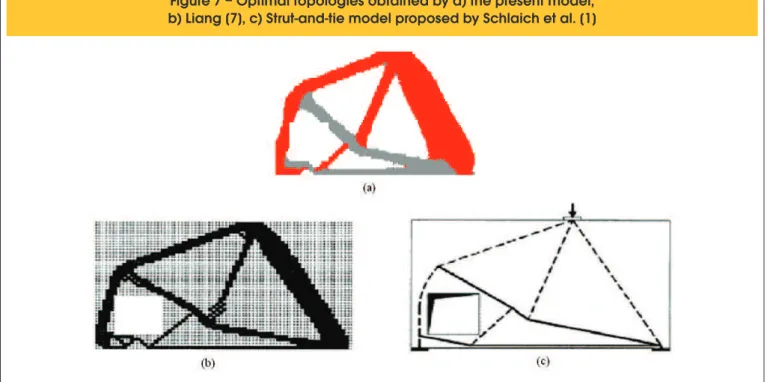
ments were used (mesh 150x47). Figure [7a] show the optimal design obtained by the SESO formulation and compared with the work developed by Liang [7], Figure [7b], and Schlaich et al. [1], Figure [7c].
The optimum topology design shown in Figure [7a] was obtained with a inal volume of 30.3%; dark and light regions respectively indicate the compressed regions, strut, and tensioned regions, tie. Figure [7b] shows the optimal design presented by [7], who uses the ESO optimization method to obtain a inal volume of 33%. Fig-ure [7c] shows the optimal coniguration for the strut-and-tie design proposed by [1], who uses the strut-and-tie model. The graph in Figure [8] shows the monitoring made by this formulation to deter-mine the optimal topology. The growth of the PI values is plotted for each iteration path, and the sharp drop in PI indicates that the previous iteration is thus the area of optimal design.
Schlaich et al. [1] proposed strengthening for this structure, ob-tained with the use of a strut-and-tie model deriving from the com-bination of the inite element method with a procedure to obtain the low strength, using the method called “load path”. Thus, Figure [12] shows the disposition of reinforcement by the authors, [1], to strengthen the beam cavity.
With the indication of optimal topology obtained by the present for-mulation, a proposal for a strut-and-tie model can be directly pre-sented. Note the proposed strut-and-tie shown in Figure [9] where the dotted and continuous lines indicate, respectively, compressed members (C), strut, and tensioned members (T), tie. The efforts at the members where the low stress stand out can be calculated by multiplying the average stress values of each member and their
re-Figure 5 – (a) Optimal topology (b) strut-and-tie model, proposed by [6], mm; (c) Optimal topology
using the present model; (d) Proposed disposition of reinforcement for the present model (mm)
Table 1 – Strut-and-tie forces (kN) for each
member of the bridge
Member
Force [6]
Force
(present model)
1
2,114
2,192
2
1,162
1,195
3
3,363
3,454
4
-3,470
-3,589
5
-3,919
-4,083
6
-3,219
-3,482
7
-3,363
-3,569
8
-5,500
-5,964
spective area, given by the product of beam thickness to the width of the average low region.
It is thus possible to calculate the required reinforcement areas in the tie region and to evaluate the strength of concrete in each strut. Table [2] shows the values of the average efforts obtained at ties. The T2 and T4 ties are inclined at 15 and 45 degrees, respectively, from the horizontal line. The longitudinal bar which represents tie T2 is calculated from the decomposed horizontal portion of its ef-forts, thus obtaining the required area of reinforcement As2. Tie T4 has its representation in the orthogonal mesh, As3, which covers the stretch along the edge of the cavity and the in-angle encounters struts C3, C8 and C5 at the left end. An additional
re-inforcement As4, at 45 degrees, is proposed covering the in-angle encounter struts C2, C5 and C8.
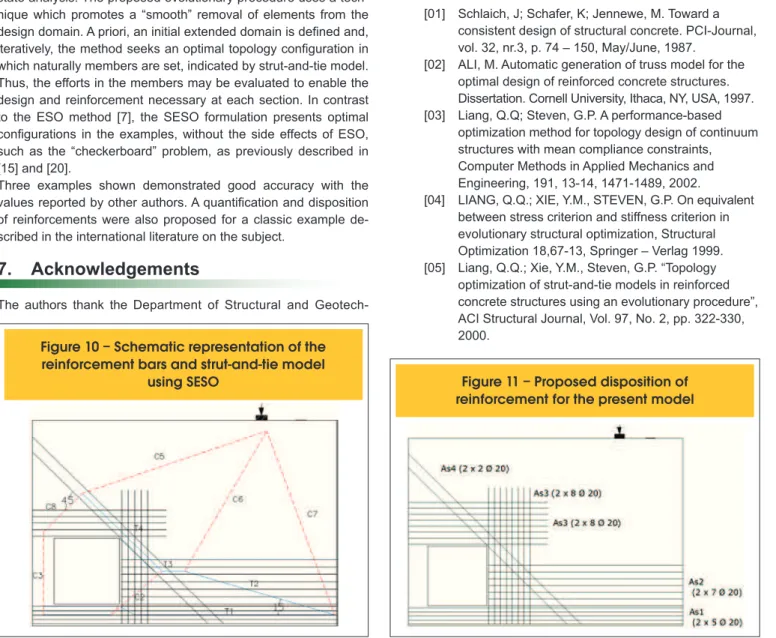
Conforming to the calculation procedures to obtain the representa-tive reinforcement of ties (Table [2] and Figure [10]), the details of these reinforcements are shown in Figure [11], where we can see the proposed extension of reinforcement As3.
Table [3] presents the veriication of the compression stresses acting at strut members where the non-attendance of the ultimate state of compression in the concrete is observed at struts C3 and C8.
6. Conclusions
Our aim is to present a numerical formulation for the design of
Figure
7 – Optimal topologies obtained by a) the present model;
b) Liang [7], c) Strut-and-tie model proposed by Schlaich et al. [1]
Figure 8 – Performance index versus number
reinforced concrete structures under the focus of the strut-and-tie model.
An alternative topology optimization procedure, called Smooth-ing Evolutionary Structural Optimization – SESO, was employed to this end in conjunction with a FEM formulation in stress plane state analysis. The proposed evolutionary procedure uses a tech-nique which promotes a “smooth” removal of elements from the design domain. A priori, an initial extended domain is deined and, iteratively, the method seeks an optimal topology coniguration in which naturally members are set, indicated by strut-and-tie model. Thus, the efforts in the members may be evaluated to enable the design and reinforcement necessary at each section. In contrast to the ESO method [7], the SESO formulation presents optimal conigurations in the examples, without the side effects of ESO, such as the “checkerboard” problem, as previously described in [15] and [20].
Three examples shown demonstrated good accuracy with the values reported by other authors. A quantiication and disposition of reinforcements were also proposed for a classic example de -scribed in the international literature on the subject.
7. Acknowledgements
The authors thank the Department of Structural and
Geotech-nical Engineering, Polytechnic School, University of São Paulo (EPUSP), the University of Ouro Preto (UFOP) and (UNESP) São Paulo State University for their inancial support to this research.
8. References
[01] Schlaich, J; Schafer, K; Jennewe, M. Toward a consistent design of structural concrete. PCI-Journal, vol. 32, nr.3, p. 74 – 150, May/June, 1987.
[02] ALI, M. Automatic generation of truss model for the optimal design of reinforced concrete structures. Dissertation. Cornell University, Ithaca, NY, USA, 1997. [03] Liang, Q.Q; Steven, G.P. A performance-based
optimization method for topology design of continuum structures with mean compliance constraints, Computer Methods in Applied Mechanics and Engineering, 191, 13-14, 1471-1489, 2002.
[04] LIANG, Q.Q.; XIE, Y.M., STEVEN, G.P. On equivalent between stress criterion and stiffness criterion in evolutionary structural optimization, Structural Optimization 18,67-13, Springer – Verlag 1999. [05] Liang, Q.Q.; Xie, Y.M., Steven, G.P. “Topology
optimization of strut-and-tie models in reinforced concrete structures using an evolutionary procedure”, ACI Structural Journal, Vol. 97, No. 2, pp. 322-330, 2000.
2
Table 2 – Dimensioning of reinforcement ties (MN, cm )
Ties
Forces (MN)
A
S,nec 2(cm )
Tie forces
(MN)
Proposed
reinforcement
2
(cm )
Number
of bars
T
11.50
34.60
1.50
As = 34.60
12 x 5 ø 20
T
2
2.24
51.53
0.966.T
2As = 49.75
22 x 7 ø 20
T auxiliar
4–
0.01
–
–
–
–
As
42 x 2 ø 20
T
42.20
50.70
0.707.T
4As = 35.85
32 x 5 ø 20
0.707.T
4As = 35.85
32 x 5 ø 20
Figure 10 – Schematic representation of the
reinforcement bars and strut-and-tie model
using SESO
Figure 11
– Proposed disposition of
[06] Liang, Q.Q; Uy, B.; Steven, G.P. Performance-Based Optimization for Strut-Tie Modeling of Structural Concrete. Journal of Structural Engineering, pp. 815p–823, 2002.
[07] LIANG, Q.Q. Performance-based Optimization of Structures: Theory and applications, Spon Press,
London, 2005.
[08] Reineck, Karl-Heinz. Shear and concrete tensile strength in the design concept of strut-and-tie models, Ibracon Structural Journal, vol 3, n.1,p. 1-18, 2007. [09] Brugge, M. Generating strut-and-tie patterns for
reinforced concrete structures using topology optimization. Computers and Structures, 87:1483-1495, 2009.
[10] Rozvany, G.I.N.; Bendoe, M.P.; Kirsch, U. Layout optimization of structures, Applied Mechanics Review, v. 48, p. 41-119, 1995.
[11] STUMP, F. V. Otimização Topológica Aplicada ao Projeto de Estruturas Tradicionais e Estruturas com Gradação Funcional sujeitas a Restrição de Tensão. Dissertação (Mestrado) - Escola Politécnica da USP, São Paulo, 2006.
[12] Bendsøe, M.P. Optimal Shape design as a material
distribution problem, Structural Optimization, v. 1, pp. 193-202, 1989.
[13] Rozvany, G.I.N.; Zhou, M.; Birker, T. Generalized shape optimization without homogenization, Structural Optimization, v. 4, p. 250-252, 1992.
[14] LABANOWSKI, A. FANCELLO, E. A. e NOVOTNY, A.A. SIMP, ESO e TSA: uma análise comparativa de métodos de otimização topológica para elasticidade 2d; CILAMCE 2004; Recife; 10/11/2004; 12/11/2004; Publicação: Proceedings of the XXV Iberian
Latin-American Congress on Computational Methods in Engineering. CILAMCE 2004.
[15] SIMONETTI, H.L., ALMEIDA, V.S., NEVES, F.A Seleção de Topologias Ótimas para Estruturas do Contínuo com minimização de Volume sujeita a restrição de tensão via “Smoothing ESO” (SESO); CILAMCE; Argentina; 2010.
[16] Xie, Y.M., Steven, G.P. A simple evolutionary procedure for structural optimization, Computers & Structures, Vol. 49, n. 5, p. 885-896, 1993.
[17] Tanskanen P., The evolutionary structural optimization method: theoretical aspects. Comput Methods Appl Mech Eng 191:5485–5498, 2002
[18] QUERIN, O.M., Evolutionary Structural Optimization stress based formulation and implementation. PhD dissertation, University of Sydney,1997.
[19] Bergan, P.G. E Felippa, C.A. A triangular membrane element with rotational degrees of freedom. Comp. Meths. in Appl. Mech. Eng., v.50, p.25-69, 1985. [20] SIMONETTI, H.L., ALMEIDA, V.S., NEVES, F.A , The
inluence of geometry on the structural elements of topology via SESO. CILAMCE; Armação de Búzios, 2009.
![Figure 4 – Design domain of the structure, [6], measurements in mm](https://thumb-eu.123doks.com/thumbv2/123dok_br/16286718.185066/5.892.457.831.887.1134/figure-design-domain-structure-measurements-mm.webp)

![Figure 12 – Proposed disposition of beam hole reinforcement (Schlaich et al., [1])](https://thumb-eu.123doks.com/thumbv2/123dok_br/16286718.185066/9.892.66.436.171.517/figure-proposed-disposition-beam-hole-reinforcement-schlaich-et.webp)
