Reliability of partially encased steel-concrete composite
columns under eccentric loading
Coniabilidade de pilares mistos aço-concreto
parcialmente revestidos em lexo-compressão
Abstract
Resumo
The Brazilian design code for composite buildings (NBR8800) has never been subject to a reliability-based calibration of the partial factors used in design. As a consequence, the level of structural safety achieved by using these factors is, in general, unknown. This paper presents a study of the reliability of partially encased steel-concrete composite columns, subject to compression and bending. Literature statistics are used to quan-tify uncertainty in strength of structural materials and in loads. Reliability indexes are evaluated, via FORM, for two ratios between dead and live loads, and for some values of load eccentricity. It was found that larger load eccentricity leads to a reduction in reliability indexes. These values are larger than minimum values recommended in international design codes; hence one concludes that design of such columns using NBR8800 leads to acceptable safety levels.
Keywords: reliability, composite column, structural safety.
A norma brasileira que embasa o projeto estrutural de edifícios contendo elementos mistos (NBR8800) nunca passou pelo processo de calibra-ção, baseada em coniabilidade, dos coeicientes parciais de segurança utilizados em projeto. Como consequência, o nível de segurança obtido com o uso destes coeicientes é, em geral, desconhecido. Este trabalho apresenta um estudo da coniabilidade estrutural de pilares mistos de aço-concreto, parcialmente revestidos e submetidos à lexo-compressão. Estatísticas da literatura são utilizadas para caracterizar as incertezas nas propriedades dos materiais constituintes e nas ações. Índices de coniabilidade (β) são avaliados, via FORM, para duas razões entre ação permanente e ação variável, e para alguns valores de excentricidade da ação vertical. Veriica-se que o índice de coniabilidade dos pilares mis-tos diminui com o aumento da excentricidade de projeto. Estes valores estão acima de índices de coniabilidade mínimos sugeridos em normas internacionais, o que sugere que o projeto utilizando a norma NBR8800 resulta em colunas mistas seguras.
Palavras-chave: coniabilidade; pilares mistos; segurança estrutural.
a Universidade de São Paulo, Departamento de Engenharia de Estruturas, Escola de Engenharia de São Carlos, São Carlos, SP, Brasil.
Received: 14 Apr 2016 • Accepted: 23 Jul 2016 •Available Online: 17 Apr 2017
M. F. PEREIRA a
A. T. BECK a
A. L. H. C. EL DEBS a
1. Introduction
The demand for fast and economical constructive systems in en-gineering pushes the advancement of composite structures such as steel-concrete composites. In comparison to usual reinforced concrete, steel-concrete composite construction reduces or elimi-nates the need for form-work, reduces material consumption and workmanship, and increases dimensional precision of structural elements. Fabrication of steel-concrete composites can be indus-trialized, with elements assembled in place at the construction site. In spite of the beneits above, lack of deeper knowledge by de-sign engineers restricts greater employment. Only in 2008, steel-concrete composite construction was normalized in Brazil, with the advent of NBR 8800 [1].
Modern codes for the design of buildings are based on limit states, where partial safety factors are used to establish an appropriate mar-gin of safety w.r.t. each of the main sources of uncertainty in design: the structural loads, and the strength of materials. Partial safety fac-tors ensure an adequate level of safety for the designed structures. However, Brazilian design codes have never been subject to the process of reliability-based calibration of partial safety factors, as the equivalent foreign codes (ACI 318 [2], EN 1992 [3], EN 1994 [4], FIB [5]). The calibration process for NBR 8800 was studied in [6], but the suggested safety factors were never incorporated in the actual code. In the speciic case of composite structures, only isolated evalua-tions of safety factors are found in the literature [7-11]. The main objective of this work is to study the safety of partially-encased steel-concrete composite columns (Figure 1), submitted to com-pressive bending, and designed according to NBR 8800 [1].
2. Design codes for steel
and concrete buildings
Design of steel-concrete composite elements using NBR 8800 [1] is based on safety criteria deined in NBR 8681 [12] and em-ploys design loads deined in speciic codes [13]. Design codes for buildings in Brazil use the limit state method, where partial safety factors are employed to warrant minimal safety levels during the useful life of the structure. Hence, for each undesirable state of the structure, either in terms of serviceability or ultimate failure, one limit state function is written. Based on limit states, design equa-tions are written, such as:
(1)
³
d dR
S
where:
Rd represents the design strength;
Sd represents the efects of design loads.
Design values for loads and strengths are obtained from represen-tative (characteristic or nominal) values, which are multiplied by partial safety factors. Load efects have to be evaluated, consid-ering the inluence of all loads with signiicate efects [1], in load combinations which have non-negligible probability of occurring simultaneously (Table 1).
Following NBR 8800 [1], the capacity of composite columns sub-ject to combined compression bending, w.r.t. one or two symmetry axes, can be evaluated in two ways: Model I is the most precise, Model II is the simpliied version. Both models consider interac-tion diagrams, which simplify the real bending moment versus axial load interaction diagram.
Model I is similar to the model for isolated steel columns, add-ing to it only the inluence of concrete between the langes of the steel beam. The interaction diagram between axial load and bending moment is composed of two straight lines, as illustrated in Figure 2a. In Model II (Figure 2b), the interaction diagram is composed of three straight lines, similar to EUROCODE 4 [4]. In both models, geometrical non-linearity is considered by adding a complementary bending moment, due to geometrical imperfections.
The main equations for designing composite columns according to NBR 8800 [1] are presented in this section. Details can be found in [1]. The strength of composite columns is given by:
(2)
( )
1æ
ö
=
ç
+
+
÷
è
ø
n
n
n
n
y a c c s sRd
a c s
f A
f A
f A
N
c l
a
g
g
g
Figure 1
Cross-section of partially encased steel-concrete
composite column
Table 1
Concrete mix designs used in the study
Strength Load
combination Dead (D) +
Live (L) 1,40D+1,5L Steel Concrete Reinforcement
where fy is the steel tensile yield strength, fc is the concrete compressive strength, fs is the reinforcement steel tensile yield strength, Aa, Ac e As are the cross-sectional areas of the steel beam, the concrete block and the reinforcement steel, respec-tively. Partial safety coefficients on structural steel, concrete and reinforcement are given by γa, γc and γs, respectively. Co-efficient α1 is a constant value, given as 0.85 for partially
en-cased steel-concrete composite columns. Factor χ (λ) takes into account the slenderness factor of the column (λ), and is given by:
(3)
( )
2
2
0,658,
1,5
0,877 , 1,5
ì
£
ï
= í
³
ïî
if
if
ll
c l
l
l
In this work, Model II of NBR 8800 [1] is used. The interaction dia-gram for Model II is given by:
(4)
, , , ,
, ,
1,0
+
£
x tot Sd y tot Sd
x c x y c y
M
M
M
M
m
m
where μx and μyrepresent interaction factors between bending mo-ment and axial load. For each of the considered axes, one has
Mc=0,9Mpl,Rd, where Mpl,Rd is given by:
(5)
(
)
(
)
,
=
-
+
0,5
1-
+
pl Rd yd a an cd c cn
M
f
Z
Z
f
Z Z
(
-
)
sd s sn
f Z Z
When employing these models, one has to respect the code-speciied limits of applicability, such as double-symmetric cross-sections, and other items described in Table 2. For situations out of this scope, EUROCODE 4 [4] presents a general design methodology.
3. Analysis method
The strength of a steel-concrete composite column depends on the strengths of the composing materials, as well as on geometrical cross-sectional characteristics, both associated to physical uncertainty. In this paper, we denote by XR the vector that contains the ran-dom variables which afect strength of the column. These variables are assumed time-invariant, i.e, strength degradation in time is not considered. For a given realization xR, and for a speciied load ec-centricity, column strength is obtained from the interaction curve, which yields axial and bending loads capacities (resistance). The actual interaction curve is parabolic in shape, but following Model II of NBR 8800, the parabolic capacity curve is approximated by three straight lines, as shown in Figure 2.
3.1 Limit state equations
In this paper, we use an adaptation of the method developed by Hong & Zhou [14] for reinforced concrete columns. The axial capacity of the composite column is written as PR = pR(XR), and
Table 2
Application limits of NBR 8800
Item Recommendation
Column slenderness λ
l
<
2,0
Cross-section aspect ratio
0,2
£
c£
5,0
c
h
b
Local instability
£
1,49
fy
b
E
t
f
partially encased columns
Figure 2
the bending moment capacity is MR = mR(XR). The ordinated pairs
AR=(PR, MR) form a curve that separates the survival and failure domains.
We denote by XDL the vector containing the load efects acting on
the column. Dead (D) and live loads (L) are considered, such that
XDL={D,L, MD, ML}. MD and ML represent the bending moments re-sulting from dead and life loads, respectively. Hence, for a given eccentricity, point ADL, is the combined efect of axial load and
bending moment, for all actions. In this setting, failure occurs when the segments
OA
DL>
OA
R, that is, when vector ADL enters the failure domain (Figure 3).With these preliminaries, the limit state equation g(XR, XDL) can be written by comparing the segments
OA
R andOA
DL:(6)
(
)
2(
)
1/2,
=
é
ë
+
/ ²
ù
û
-R DL R R
g X X
P
M h
(
) (
2)
1/2(
) / ²
é
+
+
+
ù
ë
D L
M
DM
Lh
û
The failure probability can be evaluated by means of well-known methods such as FORM, SORM or Monte Carlo Simulation. The First Order Reliability Method (FORM) is used in this paper.
3.2 Model error
One relevant source of uncertainty in structural reliability prob-lems is the model error. This is a measure of the ratio between the strength of a structural element, a given by a simpliied calculation model, and the actual strength, as tested. For steel-concrete com-posite columns under centric axial load, some information on
mod-el errors exist [7, 8, 14]. However, our literature survey resulted in no such results for eccentric loading.
Some experimental results obtained by the authors, regarding compressive-bending of short and slender columns, have shown that the NBR 8800 [1] model is quite conservative, especially for large slenderness columns. Figure 4 illustrates the capacity of intermediate-slender and short columns, in comparison with the code model. The experimental results are close to the theoreti-cal model, and show small variability. The NBR 8800 models are
Figure 3
Interaction diagrams and limit state functions for eccentric column loading
Figure 4
conservative w.r.t. experimental results, especially the model that takes imperfections into account. With this limited analysis, we in-tend to show that the NBR 8800 model presents small bias and small variability; hence the efect of such a model error in the fol-lowing reliability analysis is limited. Due to the small number of tested specimens, however, it was not possible for us to obtain a statistical characterization of the NBR 8800 model error for eccen-trically loaded steel-concrete composite columns.
4. Numerical analyses and results
The reliability of steel-concrete composite columns was investi-gated, with column cross-section as presented in Figure 1. The reduced slenderness factor is 0.41. Geometrical and mechanical characteristics of the studied column are presented in Table 3:
characteristic concrete strength is 50 MPa, and reinforcement is CA-50. Table 3 also presents the statistical data on the considered random variables. The following is also relevant:
a) Uncertainties associated to cross-section dimensions were discon-sidered, as their efects on structural safety are generally small; b) The data shown in Table 3 was obtained either by actual testing
or taken from the literature [15].
In the usual design condition, the structural element is designed to support a speciied load. In the current reliability analysis, however, it is easier but equivalent to adopt an inverse procedure: given a cross-section and slenderness, the admissible loading is designed following code speciications (Eq. 1). The same admissible loading can be obtained from diferent ratios between dead and live loads, hence the life-to-dead load ratio (α = Ln/Dn) also has to be deined. So-called heavy structures have (α<<1.0), whereas light structures
Table 3
Cross-section characteristics of studied column
Variable Nominal Mean/nominal COV Distribution
Concrete compressive strength fc 50 MPa 1.2 0.12 Normal
Steel yield strength fy 300 MPa 1.2 0.04 Normal
Reinforcing steel yield strength fs 600 MPa 1.0 – Deterministic
Steel elasticity modulus E 200 GPa 1.0 – Deterministic
Cross–section height h 152 mm 1.0 – Deterministic
Flange width b 152 mm 1.0 – Deterministic
Web thickness tw 5.8 mm 1.0 – Deterministic
Flange thickness tf 6.6 mm 1.0 – Deterministic
Reinforcement area 2.01 cm² 1.0 – Deterministic
Figure 5
have (α≥1.0). In this paper, two life-to-dead load ratios are con-sidered, α=0.25 and α=1.0. Since eccentric loading is considered, the same ratio is admitted between nominal values of bending mo-ments (MDn and MLn).
The design eccentricity is given by:
(7)
(
)
(
)
1,4
1,5
1,4
1,5
+
=
+
Dn Ln
design
n n
M
M
e
D
L
With the cross-section, the load ratio and the design eccentricity speciied, one inds the nominal values of loading variables (Dn, Ln, MDnand MLn). From the nominal loads, the probability distributions of random loads are re-constructed (Tabela 4), following Nowak [16]. The existence of correlation between axial loads (Dn and Ln) and bending moments (MDn and MLn) is not fully addressed in the litera-ture. Clearly, there is some positive correlation, because bending moments are in part caused by load eccentricity. However, correla-tion is not perfect, because bending moments are also caused by
Table 4
Characterization of random loading [16]
Variable Nominal Mean/
nominal COV Distribution
Axial dead load 1.03 0.08 Normal Normal
Bending moment due to dead load 1.03 0.08 Normal Normal
Axial live load (50-year extreme) 1.00 0.18 Gumbel Deterministic
Bending moment due to life load (50-year extreme) 1.00 0.18 Gumbel Deterministic
Figure 6
straightness imperfections, for instance. In this work, we assume a linear correlation coeicient of 0.5.
The analysis procedure is based in Hong and Zhou [4], and is giv-en in four steps:
1. Determination of design values for axial loads and bending moments, following Table 3, using two procedures based on Model II of NBR 8800: Strategy A), without consideration of imperfections; Strategy B) considering additional moments due to imperfections [1] (Figure 5);
2. Evaluation of nominal load values (Ln, Dn, MLn and MDn), for the
chosen load ratio α, and using Table 1;
3. Construction of loading random variables, from nominal values (step 2), and using Table 4;
4. Evaluation of reliability indexes by FORM and Eq. (6). The procedure is illustrated by a luxogram in Figure 6.
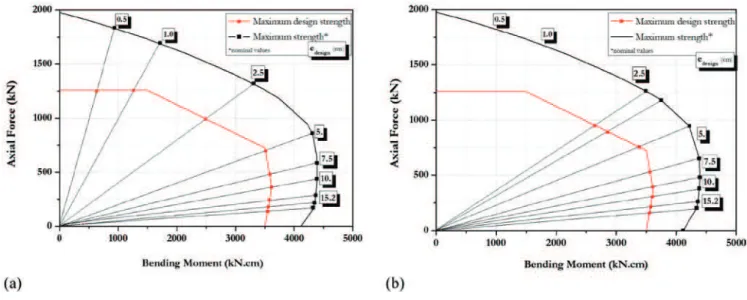
Figure 7 shows, for the two strategies considered in this work, the normal force x bending moment interaction diagrams for the studied column. The curve “Maximum design strength” presents ordinated pairs obtained in Step 1, for diferent values of design ec-centricity, but reduced by the partial safety coeicients. The curve
Figure 7
Axial load x versus bending moment diagrams for analysis strategies: a) A and b) B
Figure 8
“Maximum strength” represents the nominal values that this ordi-nated pair could achieve without partial safety factors. In Strategy B), the additional eccentricity due to imperfections is considered, leading to a total eccentricity.
Reliability indexes β obtained for two load ratios and eigth design eccentricities are shown in Figure 8. One can observe that, for both modelling strategies adopted (A and B) reliability indexes are of the same order, slightly larger values for the case where ad-ditional eccentricities are disconsidered. For both cases, reliability indexes β decrease as the design eccentricity increases. Since design procedures are based primarily on axial compression, this result makes sense. In spite of the reliability index reduction for larger eccentricity, results are always above β=4 (Table 5). These reliability indexes would be a little smaller if model error had been taken into account. Model errors for columns generally vary w.r.t. slenderness [7,8], and we also assume that they would change following load eccentricity.
Results also show that reliability index β are reduced when the life-to-dead load ratio (α = Ln/Dn) increases; this is expected, since coeicients of variation of the life load are larger than those for the dead load. Hence, when α is increased, problem uncertainty increases, making reliability indexes smaller.
One of the sub-products of a reliability analysis by FORM are the sensitivity coeicients, which measure the relative contribution of each random variable towards the calculated failure probabilities (∑(αi)2=1). Figure 9 shows sensibility coeicients obtained in analy-sis Strategy B). It can be observed that the relative contribution of random variables change, as design eccentricity
e
design changes.As design eccentricity increases, concrete strength becoming less relevant, and steel reinforcement becomes the relevant variable, with αi= 0,559 (Figure 9). Similar behavior was observed for Strat-egy A).
5. Concluding remarks
This paper investigated the safety of partially encased
steel-concrete composite columns, designed according to NBR 8800, and submitted to eccentric loading. The safety was evaluated by means of structural reliability theory, having the reliability index as metric. It was found out that:
n Column reliability depends on load eccentricity, and reduces as eccentricity increases;
n When additional load eccentricity due to imperfections was considered, mean reliability indexes β were found as 5.03 and 4.50, for live-to-death load ratios of 0.25 and 1.0, respectively. When additional eccentricity was disconsidered, reliability in-dexes were 5.26 and 4.57, respectively.
n Design of composite columns following NBR8800 leads to ac-ceptable levels of safety, even under signiicant load eccentric-ity; model errors, however, were not considered.
n The collection of more experimental data on the strength of composite steel-concrete columns under eccentric loading is recommended, in order to allow for a comprehensive descrip-tion of model errors.
Table 5
Reliability indexes
β
Design eccentricity
Relative eccentricity
Reliability indexes
α
Strategy A Strategy B (with secondary eccentricity)
edesign• e design
(cm) e/h α = 0.25 α = 1.00 α = 0.25 α = 1.00
1.0 0.007 5.98 4.79 5.62 4.65
2.5 0.015 5.92 4.75 5.33 4.48
5.0 0.035 5.55 4.40 5.18 4.46
7.5 0.050 5.11 4.48 5.11 4.51
10.0 0.065 5.07 4.52 5.01 4.59
15.2 0.100 4.76 4.59 4.69 4.56
25.0 0.165 4.40 4.44 4.31 4.25
Figure 9
6. Nomenclature
Aa – Steel cross-section area
Ac – Concrete cross-section area
As – Reinforcing steel cross-section area
bc – Width of concrete cross-section
bf – Flange width
E – Elasticity modulus for steel
fcd – Design strength for concrete in compression
fyd – Design strength of steel yielding
fsd – Design strength of reinforcement steel yielding
hc – Height of concrete cross-section
Mtot,Sd – Total design bending moments
Mpl,Rd – Plastiication moment
Npl,Rd – Design axial strength for cross-section plastiication
t – Thickness of steel
Z – Plastic modulus of cross-section λ – Slenderness factor
µ – Interaction factor
χ – Strength reduction factor due to slenderness
7. Acknowledgments
The authors acknowledge funding of this research project by FAPESP – São Paulo State Research Founding Agency (Grant nº 2014/12694-0).
8. References
[1] Associação Brasileira de Normas Técnicas. NBR 8800: Pro-jeto de estruturas de aço e de estruturas mistas de aço e concreto de edifícios, Rio de Janeiro, 2008.
[2] American Concrete Institute. ACI 318R-95: building code re-quirements for structural concrete. Farmington Hills; Detroit, 1995.
[3] Comité Européen de Normalisation. EN 1992-1-2: Design of concrete structures. General rules. Structural ire design, Brussels, 2004.
[4] Comité Européen de Normalisation. EN 1994-1-1: Design of composite steel and concrete structures. General rules and rules for buildings, Brussels, 2004.
[5] Comité Euro-international du Béton. CEB-FIB Model Code 1990. London, Thomas Telford, 1993.
[6] Beck AT, Souza Jr. AC, 2010: A irst attempt towards reliabili-ty-based calibration of Brazilian structural design codes. J. of the Brazilian Society of Mechanical Sciences & Engineering 32, 119 - 127.
[7] Oliveira WLA, Beck AT, Debs ALHC, 2008: Safety evaluation of circular concrete-illed steel columns designed according to Brazilian building code NBR 8800:2008. IBRACON Struc-tures and Materials Journal 1, 212 - 236.
[8] Beck AT, Oliveira WLA, DeNardim S, ElDebs ALHC, 2009: Reliability-based evaluation of design code provisions for cir-cular concrete-illed steel columns. Engineering Structures 31, 2299-2308.
[9] Vincent R, Tremblay R. “An Innovative Partially Compos-ite Column System for High-Rise Buildings”, Proceedings,
North American Steel Construction Conf., Fort Lauder-lade, Florida, 30-3 – 30-17, 2001.
[10] Chicoine T, Tremblay R, Massicotte B. “Long-term Behavior and Strength of partially encased composite columns made with built-up steel shapes”, Journal of Structural Engineer-ing, Canada, 129(2), 141-150, 2003.
[11] Tremblay R, Chicoine T, Massicotte B. “Design equation for the capacity of partially encased non-columns” Proceedings, Composite Construction in steel and concrete IV, ASCE, Reston, Virginia, 2002.
[12] Associação Brasileira de Normas Técnicas. ABNT NBR 8681:2003: ações e segurança nas estruturas – procedi-mento. Rio de Janeiro, 2003. (versão corrigida: 2004). [13] Associação Brasileira de Normas Técnicas. ABNT NBR
6120:1980: cargas para cálculo de estruturas de ediicações – procedimento. Rio de Janeiro, 1980 (versão corrigida: 2000).
[14] Hong, H.P. and Zhou, W. 1999. Reliability evaluation of RC columns, Journal of Structural Engineering, ASCE, Vol. 125, No. 7, pp. 784-790. Melchers, 1999.