Impact of a simple parameterization of convective gravity-wave drag
in a stratosphere-troposphere general circulation model
and its sensitivity to vertical resolution
C. Bossuet, M. DeÂqueÂ, D. Cariolle
Centre National de Recherches MeÂteÂorologiques, 42 Av. Coriolis, Toulouse, France
Received: 3 January 1996 / Revised: 31 July 1997 / Accepted: 25 August 1997
Abstract. Systematic westerly biases in the southern hemisphere wintertime ¯ow and easterly equatorial biases are experienced in the MeÂteÂo-France climate model. These biases are found to be much reduced when a simple parameterization is introduced to take into account the vertical momentum transfer through the gravity waves excited by deep convection. These waves are quasi-stationary in the frame of reference moving with convection and they propagate vertically to higher levels in the atmosphere, where they may exert a signi®cant deceleration of the mean ¯ow at levels where dissipation occurs. Sixty-day experiments have been performed from a multiyear simulation with the stan-dard 31 levels for a summer and a winter month, and with a T42 horizontal resolution. The impact of this parameterization on the integration of the model is found to be generally positive, with a signi®cant deceleration in the westerly stratospheric jet and with a reduction of the easterly equatorial bias. The sensitiv-ity of the MeÂteÂo-France climate model to vertical resolution is also investigated by increasing the number of vertical levels, without moving the top of the model. The vertical resolution is increased up to 41 levels, using two kinds of level distribution. For the ®rst, the increase in vertical resolution concerns especially the troposphere (with 22 levels in the troposphere), and the second treats the whole atmosphere in a homogeneous way (with 15 levels in the troposphere); the standard version of 31 levels has 10 levels in the troposphere. A comparison is made between the dynamical aspects of the simulations. The zonal wind and precipitation are presented and compared for each resolution. A positive impact is found with the ®ner tropospheric resolution on the precipitation in the mid-latitudes and on the westerly stratospheric jet, but the general impact on the model climate is weak, the physical parameterizations used appear to be mostly independent to the vertical resolu-tion.
Key words Meteorology and atmospheric dynamicsá
Convective processes áWaves and tides
1 Introduction
The study of the present climate and the investigation of the impact of changes in greenhouse gases and strato-spheric ozone on the future climate require the devel-opment of reliable, comprehensive atmospheric models and the coupling of such atmospheric models with comprehensive ocean models. For realistic numerical simulations many physical and dynamical processes must be included, and a large variety of investigations about model sensitivity and model ability to reproduce observed phenomena have to be performed. The grav-ity-wave drag eect on the large-scale ¯ow is important for the dynamic coupling of the troposphere and stratosphere. An improved understanding and a con-sideration of the vertical transfer of momentum via waves generated in the troposphere are important for the development of accurate global climate models.
The orographic gravity waves' generation and mech-anism are now well understood. Lindzen (1981), Palmer
et al. (1986) and McFarlane (1987) showed an improve-ment by introducing an orographic gravity-wave drag parameterization. They reduce the polar night vortex intensity and have a realistic zonal wind over continents. However, observations of gravity waves in the middle atmosphere (Fritts, 1984) indicate that a large number of gravity waves are not stationary but high-frequency waves, and so display sources other than topographic ones. A large part of them are likely to be excited by convection and are linked to the convective cells. Indeed, in active convective regions (tropics) the cumu-lus convection involves strong transient vertical motions and behaves like mountains in the environmental horizontal ¯ow, thus generating gravity waves. Clark
et al. (1986) referred to this as the ``obstacle eect''.
They also described a second mechanism of convective gravity-wave generation, the ``mechanical oscillator eect'': the interface disruption of two layers with dierent stabilities due to upward and downward oscillation of convective eddies (next to the tropopause) is a source of waves.
Such waves have been observed by aircraft, rockets and reported by Kuettneret al. (1987) above convective boundary layers in continental mid-latitudes and by James (1959) and P®ster et al. (1993) above deep convection in the tropics. These waves have earlier been studied numerically with two-dimensional simulations by Clark et al. (1986) above shallow cumulus and by Fovell et al. (1992) above a squall line. Three-dimen-sional simulations have also been performed by Hauf and Clark (1989) and Kershaw (1995). Those studies reveal that the strength of the vertical shear of the horizontal wind determines the waves excitation.
The convective gravity waves generated in the troposphere propagate vertically with westerly (easterly) phase speeds relative to the mean ¯ow and transfer westerly (easterly) momentum into the stratosphere when they break, thus in¯uencing the environmental ¯ow through wave drag and diusion. This eect of the drag exerted on the mean ¯ow by the gravity waves excited by convection has to be taken into account in atmospheric GCMs. The ®rst purpose of this work is to introduce and to test a new parameterization which vertically transfers momentum induced by these waves (in the upper atmosphere).
Model resolution is also an important aspect for the performance of the simulations, and has been discussed earlier in the literature (Boville, 1991; Hayashi et al., 1989, and references therein), and illustrated by im-provements in simulations (Lindzen and Fox-Rabino-vitz, 1989; Mesinger et al., 1990; Warner and Seaman, 1990). Advances in computer power and development of new observation systems are making it possible to increase resolution in general circulation models (GCMs). These resolution studies may provide some interesting features of the scale dependencies of the model parameterizations.
The work of Boyle (1993) and DeÂqueÂet al. (1994) on the horizontal resolution showed that the role of the orography is improved by increasing resolution, and so has an impact on the atmospheric circulation above the continents. The main improvements due to horizontal resolution occur in the stratospheric simulation (when the model has sucient vertical resolution) as shown by Kiehl and Williamson (1991) and Boyle (1993). How-ever, the improvement is not uniform for all aspects of the simulations; Boyle (1993) ®nds some degradation visible from the ®rst 30 days of the simulation: the convective parameterization appears to be resolution dependent in certain regions and is more ecient for a weak horizontal resolution (this impact is also found in the work of DeÂqueÂet al., 1994). The dynamic aspects of the circulation are not sensitive to the change in resolution. Although increasing resolution can improve the accuracy of numerical models by decreasing discret-ization errors, it can also degrade some simulated ®elds
by destroying the equilibrium of compensating errors (Houghton et al., 1992).
The vertical resolution is also important for the numerical simulations eciency, as shown by Palmeret al. (1986). In an another way, by extending the top of the model up to the stratosphere, Boville and Cheng (1988) found an improvement in the tropospheric-stratospheric simulation, with a reduction of the westerly winds and a warming of the polar lower stratosphere. These eects are due to re¯ection of the vertically propagating wave activity by the upper boundary of the model and in¯uence the mean tropospheric ¯ow.
The second purpose of this work is to examine the impact of a smaller spacing of the levels within the model's vertical domain without moving the top of the model. Increasing the number of levels may induce signi®cant changes in the atmospheric circulation and in the troposphere, as found by Williamson (1988).
We focus in this study on the tropospheric resolution. Indeed, two dierent 41-vertical-level distributions are considered, which in the ®rst case of increased resolution concerns especially the troposphere (with 22 levels in the troposphere), and in the second one the whole atmo-sphere in an homogeneous way (with 15 levels in the troposphere). The impact of the vertical resolution is compared with the simulation of the standard 31-level version of ARPEGE-Climat (with 10 levels in the troposphere). We focus our analysis on the vertical shape of the general circulation and on the precipitation ¯uxes.
Section 2 describes the GCM used and the main bias of the general circulation simulated with the standard 31-level version of ARPEGE-Climat. Section 3 presents the new parameterization of the drag exerted on the mean ¯ow by gravity waves excited by convection. Section 4 presents the results obtained with dierent vertical level spacing and their impact on the general circulation. Conclusion and remarks appear in Sect. 5.
2 Description of the basic GCM
which have been made in the ARPEGE-Climat model in this work (since DeÂqueÂet al., 1994) are the following:
1. The radiation scheme (Morcrette, 1991) is called every 3 h; this scheme belongs to the physical parameterization package of the ECMWF model. It takes into account four ®elds of aerosols and cloud-radiation interactions in detail.
2. The land surface processes are taken into account with the soil-vegetation scheme of Noilhan and Planton (1989). This includes three water reservoirs which reduce the overestimated surface temperature over the continents during the summer. The geo-graphical distributions of the soil and vegetation properties are taken into account.
3. The liquid and solid water phases are distinguished in the precipitation scheme.
4. The atmospheric mass sources and sinks induced by evaporation and precipitation are taken into account in order to improve the tropical rainfall simulation. 5. A new de®nition of the vertical levels has been given
(see next section).
The experiments described in this paper were per-formed from a well-equilibrated state of the atmosphere. The initial conditions are the result of a 5-year integra-tion of the model with the standard 31 levels. Then a perturbation, the convective gravity-wave drag param-eterization and/or a change to 41 vertical levels, is introduced. The length of the integrations is 60 days. In order to limit the dependence on the initial conditions, several day integrations are averaged. Five winter 60-day runs are performed, starting on 29 November of years 1 to 5 of the reference integration, and ®ve summer 60-day runs are performed, starting on 24 May of the same years.
As shown by Dreveton et al. (1993), the GCM is allowed 30 days to reach a new equilibrium to the per-turbation imposed and the last 30 days of the integration are used for the time-averaged results. The horizontal resolution is a spectral T42 triangular truncation equiv-alent to a Gaussian grid with a mesh of about 2:8 in
latitude and longitude. The ®rst experiment with the standard 31 levels is used as a reference (hereafter REF31).
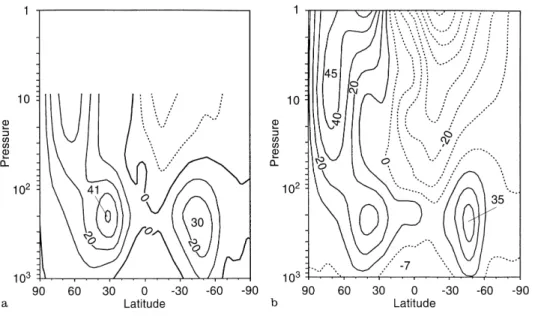
Figures 1 and 2 show the height±latitude sections of the zonal average of zonal wind for REF31 and a climatology of the European Centre for Medium-range Weather Forecasts (ECMWF) daily analyses (which extend only up to 10 hPa). This climatology has been obtained by averaging 6 years of 6-hourly analyses between 1985 and 1991, for which the ECMWF model used a T106 truncation. The ®gures present the main biases of the ARPEGE-Climat model.
In the July reference experiment (Fig. 1) the positions of the jet stream agree well with climatology, although the westerly stratospheric jet is too strong by about 10 m sÿ1near the tropopause (100 hPa) and 20 m sÿ1in
the stratosphere. The easterly jet intensity is also overestimated by about 10 m sÿ1 in the lower strato-sphere; this equatorial easterly bias is common to many GCMs.
In the January reference experiment (Fig. 2) the westerly stratospheric jet is too strong by 10 m sÿ1. In
the southern hemisphere, the easterly jet is overestimat-ed with an equatorial easterly bias, in the low strato-sphere, of 10 m sÿ1.
3 The convective gravity-wave drag parameterization
Before increasing the vertical resolution, we try to reduce these systematic biases in the zonal average of zonal wind shown in the previous section. A simple parameterization of the drag exerted on the mean ¯ow by gravity waves excited by convection is introduced in the same way as Palmer et al. (1986), who implemented an orographic gravity-wave drag parameterization.
This parameterization deals with the eect on the mean ¯ow of the gravity waves excited by convection. Indeed, we only take into account the vertical transfer of momentum induced by these waves and not their possible diusion eects on heat. We consider a frame
moving with the cumulus convection. In this frame, linked to the cloud base, we can assume that the waves are stationary (they have a phase speed equal to the wind speed at the bottom of the cloud) and have a vertical propagation. For the interaction with the large-scale ¯ow, the wave is assumed to be activated in the plane de®ned by the direction of the absolute wind at the top of the cloud (source of convective gravity waves) and the vertical.
In this given reference frame with respect to the convective eddies, we can treat the convective gravity-wave drag like the orographic one, and follow Lindzen (1981) in applying linear theories of propagation.
The intensity of momentum transported by the gravity waves excited by the convection is chosen to depend on the precipitation ¯ux, which is an index of convective activity in the model, as shown by Tiedtke (1984) in his parameterization of cumulus convection.
At the top of the cloud, the convective gravity wave induces a momentum ¯ux given by the empirical relation:
sT
! ÿKPconv vT
! kv!kT
; 1
where K is an empirical coecient,Pconv is the convec-tive precipitation and v!T is the wind at the top of the
cloud.
Above the cloud, away from critical levels and dissipative eects, the convective momentum ¯ux re-mains constant. There is no interaction with the large-scale ¯ow. The wave propagates vertically and remains linear. As the air density decreases with height, the gravity-wave magnitude increases until a critical level of breaking is reached (where the magnitude and the wavelength are about the same order). At this level there is saturation and the wave exchanges momentum with the mean ¯ow.
Following the instability criterion of Lindzen (1981) for the orographic gravity wave breaking, we have saturation when:
C q;N;U q qT
NT
N U UT
3
1 ; 2
whereqT is the air density at the top of the cloud,NT the
Brunt±VaõÈssaÈlaÈ frequency at the top of the cloud andUT
is the component of the relative wind (in the given reference frame) in the direction of the wind at the top of the cloud. The expression of U (at a levell) is:
U ! ÿv !vb :v!T kv! kT
; 3
where !vb is the wave phase speed.
The momentum ¯ux at levellis given by:
slClsT : 4
At the top of the cloud (level lT) the wave is saturated
(ClT 1). As height increases, ldecreases (since l41 at the surface andl0 at the top of the model) andCl
remains constant as a function ofluntil a critical level is encountered; above this levelCdecreases monotonically following:Clmin
ÿ
Cl1 ql1;Nl1;Ul1;Cl ql;Nl;Ul
. Once zero value is attained, it remains constant up to the top of the model (the wave is completely absorbed).
Inside the cloud, in contrast to the orographic GWD, which exchanges momentum with the solid earth, we assume that the convective gravity-wave stress is zero at the surface. For the sake of simplicity, we take a linear empirical pro®le such that the ¯ux sdecreases linearly from the top of the cloud to its base, where it is ®xed to zero value. Indeed, the momentum derived from the atmosphere is given back to the lower atmospheric layers (inside the cloud). The stable layers below the cloud base are not supposed to be aected by the momentum deposition.
This empirical scheme does not take into account the possible eects of resonance and trapped waves due to multiple re¯ection of the wave. Experiments have been performed with dierent values of the empirical coe-cientK in Eq. (1). No attempt has been made to obtain improvements in the zonal wind by excessive tuning of
the gravity-wave drag parameter K: a weak coecient makes the parameterization inoperative, and a strong coecient produces too strong a warming in the highest layers of the model, in the polar regions. Finally, realistic simulation is obtained with a coecientKequal to 103.
The experiment performed with 31 levels and with the convective gravity-wave drag parameterization is re-ferred to hereafter as GWD31.
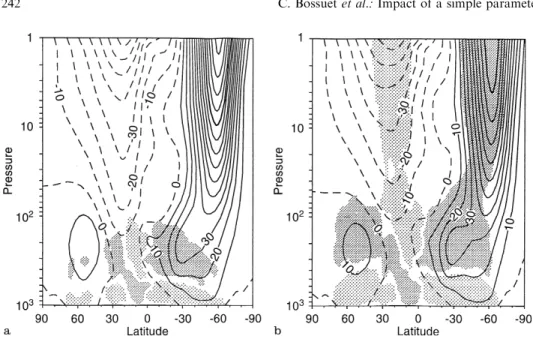
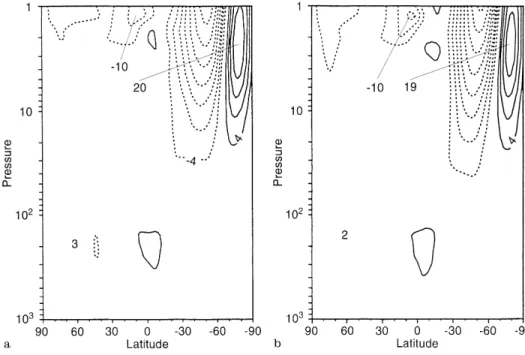
The impact of the Convective Gravity Wave Drag (CGWD) parameterization on the vertical structure of the general circulation is shown in the height±latitude sections of Fig. 3. The statistics are calculated with ®ve independent July months. The isolines represent the monthly zonal average of zonal wind and the shaded patterns represent the total zonal wind tendency due to convection (in m sÿ1dayÿ1
) for both experiments, REF31 and GWD31. It has to be noted that this zonal wind tendency also takes into account the impact of the convection scheme (Bougeault, 1985) which is respon-sible for the zonal wind tendency in the troposphere for the experiment REF31, Fig. 3a. The two parameteriza-tions are coupled. The convection scheme is activated under two conditions: a convergence of humidity in the lower layers and an unstable vertical temperature pro®le. The momentum ¯ux is redistributed within the cloud by an adjustment of the pro®le to a cloudy wind pro®le, supposed to be constant in the vertical.
The CGWD parameterization extends this phenom-enon above the convective cloud, as shown by Fig. 3b, for the GWD31 experiment, where just a weak impact is found on the zonal wind in the troposphere (the parameterization is operative above the cumulus cloud base). At the equator, the high convective activity generates gravity waves which vertically transfer mo-mentum in the upper atmosphere, translated in Fig. 3b by a zonal wind tendency due to convection. Looking at Fig. 4a, which represents the zonal mean total precip-itation for July (for the climatology, the REF31 and GWD31 experiments), one can see that this zonal wind tendency due to convection in the northern hemisphere
corresponds to the maximum of the precipitation (10±20in the northern hemisphere), in agreement with the empirical momentum ¯ux de®nition.
The wave drag stress decelerates the easterly zonal wind. Near the tropopause, the 20-m sÿ1 isoline is
thrown back at 40 hPa in the GWD31 experiment instead of 80 hPa in the reference REF31. The system-atic equatorial easterly bias is substantially reduced by about 10 m sÿ1, in better agreement with the
climatol-ogy (as seen in the previous section). In the upper stratosphere, the easterly stratospheric jet in the GWD31 experiment is reduced by 10 m sÿ1.
The tropical oceans also represent an important source of convective gravity waves, and the stratospher-ic drag induced is a signi®cant contributor to the Fig. 3a, b. Zonal average of zonal wind response to the convective gravity-wave drag parameterization foraREF31 andbGWD31 for July. Thedottedandsolid contour lines
(with 10-m sÿ1 interval) represent the zonal average of zonal wind, and theshaded valuesrepresent the zonal average of zonal wind tendency due to convection (m sÿ1dayÿ1
). The
light shadingrepresents the positive values over 0:1 m sÿ1 dayÿ1
and the
dark shadingthe negative values over ÿ0:1 m sÿ1 dayÿ1
momentum budget in the southern hemisphere. The westerly stratospheric jet is found to be reduced by 40 m sÿ1 (in the middle atmosphere), a change in the
right direction if compared with the climatology. For January (not shown), the stratospheric jet strength is slightly reduced. The impact of the CGWD parameterization on the zonal average of the zonal wind is weak compared to July, especially on the westerly stratospheric jet. Indeed the critical levels are further down in the northern hemisphere, due to the occurrence of planetary waves, which are non-existent in the southern hemisphere.
An impact is seen in July on the total precipitation ¯ux (including the solid, liquid, convective and strati-form precipitation). Figure 4 presents the distribution of the precipitation as a function of latitude in July for the experiments GWD31 and REF31 compared to the climatology of Legates and Willmot (1990) based on rain gauge observations.
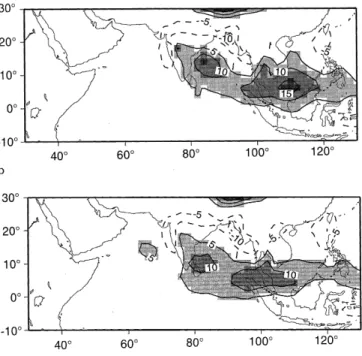
The global monthly mean precipitation decreases in the GWD31 experiment (3:20 mm dayÿ1) compared to the reference REF31 (3:30 mm dayÿ1). We observe a decrease in precipitation in the mid-latitudes and in the northern hemisphere (30N), in agreement with the climatology, which is signi®cant respectively at 99% and 95% according to t-tests (with a degree of liberty of 4). This feedback on the total precipitation ¯ux mostly concerns the convective precipitation (the stratiform one is not aected), and is especially important in regions of high convective activity, where the parameterization is particularly active. Figure 5 presents the precipitation errors for July, between the experiments REF31, GWD31 and the climatology, in the monsoon area.
The maxima of the precipitation error are less intense in the GWD31 experiment. The convective precipitation are reduced in good agreement with the climatology, however the simulated precipitation cores are located too far south with respect to observations, and this bias is ampli®ed when the empirical coecientK is increased (i.e. when the intensity of convective gravity waves is increased).
For January (Fig. 4b), the impact of the CGWD parameterization on the total precipitation ¯ux is weak, with a slight decrease in the precipitation in the mid-latitudes (in both hemispheres).
The introduction of the convective gravity-wave drag parameterization has a positive impact on the strength of the stratospheric jets and reduces the easterly equatorial bias. In the troposphere an impact is seen on the convective precipitation, in high convective activity area, with a decrease in the precipitation. The monsoon tends to shift equatorwards and the precipi-tation anomalies are reduced.
4 Impact of vertical resolution
4.1 The distribution of the vertical levels
Using the version of ARPEGE-Climat including the CGWD parameterization, integrations with 41 vertical levels instead of 31 have been performed with the vertical resolution increased uniformly over the vertical (GWDS41 experiment) and with an increase in the number of levels especially in the troposphere (experi-ment GWDT41). The choice of 41 levels was motivated by constraints on the calculation time and computer cost. The purpose of this study was to determine the possible impact of a ®ner tropospheric resolution, in order to test the stability of parameterizations (clouds, diusion, etc) with regard to vertical resolution.
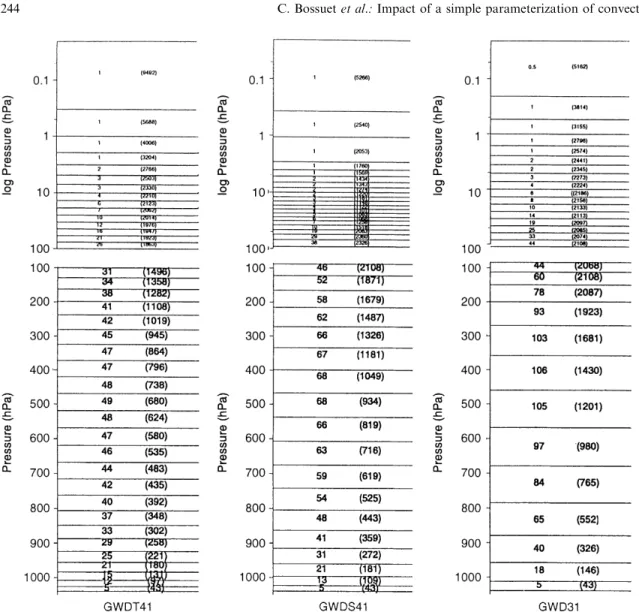
Figure 6 presents the vertical resolution in the three versions of the model. The top of the model is ®xed at 0.01 hPa. The three level distributions which are com-pared in this paper are the following: GWD31 ± the standard 31-level model has a pressure-level distribution so as to have 21 levels in the stratosphere and 10 in the troposphere (with three levels in the boundary layer). GWD31 is the reference experiment in this section. GWDS41 ± the ®rst 41-level con®guration, where the stratospheric and the tropospheric resolution are en-hanced, has 26 levels in the stratosphere and 15 levels in the troposphere (with four levels in the boundary layer). GWDT41 ± the second 41-level con®guration, where only the tropospheric resolution is increased, has 19 levels in the stratosphere and 22 levels in the tropo-sphere (with six levels in the boundary layer). However, the reference stratospheric resolution (of GWD31) is not exactly conserved in order to ensure a continuous pressure-level distribution with this new tropospheric resolution (as one can see in Fig. 6). The method used to determine the distribution of the vertical levels is presented in the Appendix.
Five 60-days runs are performed and averaged (as seen in Sect. 2), starting from a stabilized atmospheric state. The horizontal resolution is kept at T42, in order to isolate the impact of the vertical resolution. The time-step, largely controlled by the horizontal resolution, is kept at 15 min. The hybrid vertical coordinategused is a terrain following sigma coordinate close to the surface and a pressure coordinate in the higher levels, to be well adapted to stratospheric modelling (Simmons and Bur-ridge, 1981);gvaries from 0 at the model top to 1 at the surface. (See Appendix for more details). No single characterization of the consistency of the vertical to horizontal resolution can be applied throughout the depth of the atmosphere in this paper, as had been possible in previous consistency studies, which used a constant vertical increment with height (Lindzen and Fox-Rabinovitz, 1989) since the layer thickness varies with height.
For each level distribution con®guration some tuning is required in order to compare the dierent simulations. The cloud cover is diagnosed at each level by combining
the stratiform and the convective cloudiness fractions with maximum overlap. The stratiform cloudiness is calculated from the dierence between the relative humidity and a critical humidity pro®le given by:
hc k 1ÿ a1
p k
ps
1ÿp k
ps
1
a2
p p k
ps ÿ
1 2
; 5
where p k is the pressure of the k-th level and ps the
surface pressure, a1 and a2 are empirical coecients, which are, respectively, equal to 1.7 and 1 (in the standard, 31-level version). The empirical parametersa1
anda2must be adapted to each change in the model (in particular a change in resolution) in order to ensure a global planetary albedo of 0.3 and a global radiative equilibrium at the top of the atmosphere in annual mean (they are equal, respectively, to 1.5 and 1 in the GWDS41 version and to 1.6 and 2 in GWDT41). Fig. 6. Vertical layer structure of the experiments GWD31, GWDS41
and GWDT41, in a linear scale below level 100 hPa (in the troposphere) and in a logarithmic scale above level 100 hPa. Pressure
4.2 Impact of increased vertical resolution on the general circulation
Figure 7 presents the dierence between the 41-level experiments and the reference GWD31 for the zonal average of zonal wind for July. The impact of vertical resolution enhancement is not very striking. The main dierences between the experiments GWDT41, GWDS41 and the reference experiment GWD31 occur in the upper part of the atmosphere. In the southern hemisphere stratospheric polar night, the westerly jet intensity is reduced by 20 m sÿ1 when the vertical
resolution is increased (a change in the right direction if compared to the climatology).
A slightly poleward drift of the polar stratospheric jet is also observed in the winter hemisphere for July. This feature can be explained by the sensitivity of the orographic gravity-wave drag to the vertical resolution. Figure 8 presents the vertical structure of zonal wind tendency (due to orographic gravity waves) for the three experiments in July, and shows a zonal wind tendency decrease in the southern-hemisphere stratosphere with resolution (in GWDS41 and GWDT41). Drevetonet al. (1993) have shown in their work on the feedbacks between the parameterization schemes that the westerly stratospheric jet shifts polewards when the gravity-wave drag decreases. This feature is enhanced when the tropospheric vertical resolution is increased. The zonal wind tendency (due to orographic gravity waves) in GWDT41 (Fig. 8c) is weaker by about 4 m sÿ1 dayÿ1in
the southern-hemisphere stratospheric height-latitudes compared to GWDS41 (Fig. 8b).
Some work on the orographic gravity-wave drag parameterization is in progress in order to reduce the poleward drift. This poleward shift of the westerly stratospheric jet produces a warming in the polar night stratosphere that one can see in Fig. 9, which presents the zonal mean temperature dierence between the
41-level experiments and the reference experiment still for July. This warming is increased in GWDT41, with the tropospheric resolution. A warming by about 3 at the top of the model is also observed in the 41-level experiments.
The easterly jet (Fig. 7) in the northern hemisphere for July is not sensitive to vertical resolution, except in the upper stratosphere, where the jet is accelerated by about 10 m sÿ1 in the 41-level experiments. However, at
least 10 years, simulation is required in the northern hemisphere for a stable climatology, owing to the important variability (Boville and Randel, 1986), so in spite of the t-test agreement, some more experiments have to be performed to determine a stable impact of the vertical resolution.
For January, one can notice in Fig. 10, where the zonal average of zonal wind for 41-level and 31-level experiments is plotted, no impact on the easterly jet in the southern hemisphere.
In the northern hemisphere, the westerly stratospher-ic jet is increased with resolution, in the upper strato-sphere by 20 m sÿ1 for the GWDS41 experiment and
10 m sÿ1 for GWDT41 experiment, compared to the reference GWD31. However, in GWDS41 (Fig. 10b), with a vertical resolution increased in the whole atmo-sphere, the westerly stratospheric jet is strongly reduced in the middle atmosphere (compared to GWD31) and becomes no more realistic. No systematic impact is seen on the zonal mean temperature for January (not shown) in the 41-level experiment, except for a warming (by about 2) at the top of the model.
The impact of increased vertical resolution on the general circulation model is characterized (in both 41-level experiments) by a poleward shift of the polar stratospheric jet in the winter hemisphere for July, induced by an orographic gravity-wave drag increase. For January, the impact is weak. A degradation of the westerly stratospheric jet in GWDS41 is noticed,
although more experiments have to be performed because of the important variability in the northern hemisphere due to the planetary waves.
4.3 Precipitation
The total precipitation simulated with the dierent vertical resolution, including solid, liquid, stratiform and convective precipitation, is compared to the Legates and Willmot (1990) climatology. The global mean precipitation remains constant with vertical resolution; however, an impact in the 41-level experiments is seen
on the precipitation at the equator and mid-latitudes, as shown in Fig. 11a, b, where the distribution of the precipitation as a function of latitude in July and January is presented.
In July (Fig. 11a) the main impact on the precipi-tation is found in the northern hemisphere in the mid-latitudes, where the precipitation decreases with resolution with respect to the observations. The decrease is signi®cant at 99% (according to t-tests, with a degree of liberty of 4). In the southern hemisphere the decrease in the tropical precipitation is stable at 95%; however, the precipitation was already underestimated in the reference experiment GWD31.
Fig. 8a±c. Zonal average of the zonal wind tendency due to the orographic gravity-wave drag in m sÿ1dayÿ1
for July for the experimentsa GWD31,bGWDS41 andcGWDT41; contour 0.1, 0.2, 0.5, 1 and 5 m sÿ1dayÿ1
, and positive values over 0.1 areshaded
Fig. 9a, b. Zonal mean dierence of temperature for July betweenathe experiments GWDS41 and GWD31, andbthe experiments GWDT41 and GWD31; contour interval 2, the
In January (Fig. 11b), the maximum equatorial pre-cipitation shifts northwards in the GWDT41 experiment, compared to the reference GWD31, and is in better agreement with the climatology. However, in GWDS41 this maximum is reduced. Both impacts are signi®cant at 99%. The impact of increased vertical resolution on the precipitation is positive when the tropospheric resolu-tion is ®ner.
5 Concluding remarks
The GCM has a high resolution in the stratosphere (with respect to other GCMs) and suers from over-strong stratospheric winds and in particular from an equatorial easterly bias. A simple parameterization of convective gravity-wave drag has been introduced in ARPEGE-Climat GCM which reduces these biases by taking into account vertical momentum transfer through convective gravity waves from the troposphere to the stratosphere. The equatorial easterly bias is signi®cantly reduced and the stratospheric winds are slowed down. In the troposphere an impact is seen on the monsoon, where the precipitation anomalies are reduced and shift southwards compared to the climatology.
The consequences of increasing the vertical resolu-tion on the mean climate are generally weak, with a poleward drift of the stratospheric jet in the winter hemisphere for July, due to an orographic gravity-wave drag decrease (as shown by Dreveton et al., 1993). For January, the high variability in the northern hemisphere (due to planetary waves) has no signi®cant impact. However, a warming at the top of the model occurs in both experiments. Improvements are found on the precipitation, when the vertical resolution is increased, at the equator and in the mid-latitudes.
Although the length of the integrations is 60 days, the average of the ®ve experiments limits the dependence on the initial conditions and the interannual variability. These features are quite stable, as can be checked by the t-tests. It is to be noted that in spite of the doubling the resolution in the troposphere, the mean features do not change much, maybe because of the readjustment of clouds performed in order to obtain the same global radiative forcings at the top of the atmosphere. It is also an indication that the physical parameterizations used are resolution independent, at least in the range 10±20 levels in the troposphere. An experiment was performed Fig. 10a±c. Zonal average of zonal wind in m sÿ1 for January for
aGWD31,bGWDS41 andcGWDT41; contour interval 10 m sÿ1
with 21 levels, chosen such that 7 levels are in the troposphere and 14 in the stratosphere. Some degrada-tions were observed in the dynamics and in the precipitation (in particular the tropical precipitation).
Despite the fact that the resolution increase is not followed by important model improvements, the use of the 41-level distribution with a ®ner tropospheric resolution is planned in the next versions of the ARPEGE-Climat GCM. The parameterizations which we are presently using have been developed during the 1980s within GCMs using about 10 vertical levels in the troposphere. The present study shows that the param-eterizations used are robust to vertical discretization without arti®cial equilibrium or compensating errors. The present generation of atmospheric models use a higher vertical and horizontal resolutions, and new parameterizations are developed starting from realistic representation of the troposphere. We intend to develop parameterizations with better representations of some key physical process. A cloud prognostic scheme will replace the present scheme and a more physically based diusion scheme that takes into account the turbulent kinetic energy budget will be implemented.
Appendix
The vertical level distribution is controlled by a progressive variation, with level numberk, of functions
Ak1=2andBk1=2, which determine the pressurepk1=2of
the half model levels (these functions are analytical in each interval). This method allows any distribution of theL levels.
The pressure at the layer interface is calculated by:
pk1=2 Ak1=2Bk1=2ps ; 6
where ps is the surface pressure and with the boundary
conditions, at the model top A00,B00 and at the surfaceAL0,BL1.
Level pressurepk(where the main model variables are
de®ned) is given by:
pk0:5 pk1=2pkÿ1=2 : 7
Any choice of Ak1=2 and Bk1=2 which ensures the
increase with kof pk can be used.
The analytical functions A g and B g depend on adjustable parameters which control the vertical level distribution. The limit between the sigma coordinate and the pressure coordinate is chosen at p0, for the pressure coordinateg0k=L, thenB is de®ned by:
B g 0; gg0 ;
B g r0
gÿg02 gÿg2
g1ÿg02 g1ÿg2; g0gg1 ;
B g 1ÿ 1ÿr0
1ÿg
1ÿg1
; g1g1 ;
8
wherer0 determines the lowest layer thickness (between
the earth's surface and the last level) with a pressurer0
(0.99) times the surface pressure, and the last level
pressure coordinate g1 Lÿ1=L; g2 ensures the B
derivative continuity ing1.
Ais de®ned by:
A g p0exp a gÿg0 b
1 gÿ 1 g0
; gg0 ;
A g p0 gÿg1 2
gÿg3 g0ÿg12 g0ÿg3
; g0gg1 ;
A g 0; g1g1 ;
9
where aand b control the vertical level distribution in the stratosphere such thatA 1=L paandA l=2L pb
(paandpbare given pressures);g3is chosen to ensure the A derivative continuity ing0.
Acknowledgements. The authors are grateful to their colleagues from MeÂteÂo-France and to all the people who contributed to the development of ARPEGE/IFS model, and in particular to J. F. Geleyn. Thanks are also due to J. P. Piedelievre for providing the initial situation of the integrations and to Dr. P. J. Gleckler and to B. Murphy for their help in reading the manuscript. The European commission (contract HIRETYCS ENV4 CT95 0184), the PNEDC (French National Program for the Study of Climate Dynamics) and the higher education and research oce (contract 94-3-1414) partly supported this study.
The Editor-in-chief thanks two referees for their help in evaluating this paper.
References
Bougeault, P.,A simple parameterization of the large-scale eects of deep cumulus convection, Mon. Weather Rev., 113, 2108±2121, 1985.
Boville, B. A.,Sensitivity of simulated climate to model resolution,
J. Clim.,4,469±485, 1991.
Boville, B. A., and X. Cheng,Upper boundary eects in a general circulation model,J. Atmos. Sci.,45,2591±2606, 1988. Boville, B. A., and Randel W. J.,Observations and simulation of
the variability of the stratosphere and troposphere in January,
J. Atmos. Sci.,43,3015±3034, 1986.
Boyle, J. S., Sensitivity of dynamical quantities to horizontal resolution for a climate simulation using the ECMWF (Cycle 33) model.J. Clim.,6,796±815, 1993.
Clark, T. L., T. Hauf, and J. P. Kuettner, Convectively forced internal gravity waves: results from two-dimensional numerical experiments,Q. J. R. Meteorol. Soc.,112,899±925, 1986. DeÂqueÂ, M., C. Dreveton, A. Braun, D. Cariolle,The ARPEGE/IFS
atmosphere model: a contribution to the French community climate modelling,Clim. Dyn.,10,249±266, 1994.
Dreveton C., M. DeÂqueÂ, and J. F. Geleyn,Interactions of physical parameterizations in the climate version of the ARPEGE/IFS model,Beitr. Phys. Atmos.,66,283±303, 1993.
Fovell, R., D. Durran, and J. R. Holton,Numerical simulations of convectively generated stratospheric gravity waves, J. Atmos. Sci.,49,1427±1442, 1992.
Fritts, D. C., Research status and recommendations from the Alaska workshop in gravity waves and turbulence in the middle atmosphere, Bull. Am. Meteorol. Soc., 65, 149±159, 1984.
Hauf, T., and Clark, T. L., Three-dimensional numerical experi-ments on convectively forced internal gravity waves, Q. J. R. Meteorol. Soc.,115,309±333, 1989.
Houghton, D. D., R. A. Petersen, and R. L. Wobus,Spatial resolution impacts on National Meteorological Center Nested Grid Model Simulations,Mon. Weather Rev.,121,1450±1466, 1992. James, D. G., Observations from aircraft of temperatures and
humidities near stratocumulus clouds,Q. J. R. Meteorol. Soc., 85,120±130, 1959.
Kershaw, R., Parameterization of momentum transport by con-vectively generated gravity waves,Q. J. R. Meteorol. Soc.,121, 1023±1040, 1995.
Kiehl, J. T., and D. L. Williamson,Dependence of cloud amount on horizontal resolution in the National Center for Atmospheric Research community climate model, J. Geophys. Res., 96, 10955±10980, 1991.
Kuettner, J. P., P. A. Hildebrand, and T. L. Clark, Convection waves: observations of gravity wave systems over convectively active boundary layers,Q. J. R. Meteorol. Soc.,113,443±467, 1987.
Legates, D. R., and C. J. Willmott, Mean seasonal and spatial variability in gauge-corrected global precipitation,Int. J. Clim., 10,111±127, 1990.
Lindzen, R. S.,Turbulence and stress owing to gravity wave and tidal breakdown,J. Geophys. Res.,86,9707±9714, 1981. Lindzen, R. S., and M. Fox-Rabinovitz, Consistent vertical and
horizontal resolution, Mon. Weather Rev., 117, 2575±2583, 1989.
McFarlane, N. A.,The eect of orographically excited gravity wave drag on the general circulation of the lower stratosphere and troposphere,J. Atmos. Sci.,44,1775±1800, 1987.
Mesinger, F., T. L. Black, D. W. Plummer, and J. H. Ward,Eta model precipitation forecasts for a period including Tropical Storm Allison,Weather Forecasting,5,483±493, 1990.
Morcrette, J. J.,Radiation and cloud radiative properties in the European Center for Medium Range Weather Forecasts fore-casting system,J. Geophys. Res.,96,9121±9132, 1991. Noilhan, J., and Planton S., A simple parameterization of land
surface processes for meteorological models, Mon. Weather Rev.,117,536±549, 1989.
Palmer, T. N., G. J. Shutts, and R. Swinbank, Alleviation of a systematic westerly bias in general circulation and numerical weather prediction models through an orographic gravity wave drag parameterization, Q. J. Roy Meteorol. Soc., 112, 1001±1039, 1986.
P®ster, L., S. Scott, and M. Loewenstein,Mesoscale disturbances in the tropical stratosphere excited by convection: observations and eects on the stratospheric momentum budget,J. Atmos. Sci.,50,1058±1075, 1993.
Simmons, A. J., and D. M. Burridge, An energy and angular-momentum conserving vertical ®nite-dierence scheme and hybride vertical coordinates,Mon. Weather Rev.,109,758±766, 1981.
Tiedtke, M.,The eect of penetrative cumulus convection on the large-scale ¯ow in a general circulation model, Beitr. Phys. Atmos.,57,216±239, 1984.
Warner, T. T., and N. L. Seaman,A real-time, mesoscale numerical weather prediction system used for research, teaching, and public service at the Pennsylvania State University, Bull. Am. Meteorol. Soc.,71,792Ð805, 1990.