GMDD
8, 5643–5670, 2015Meridional circulation sensitivity to OGW
and QBO
A. V. Koval et al.
Title Page
Abstract Introduction
Conclusions References
Tables Figures
◭ ◮
◭ ◮
Back Close
Full Screen / Esc
Printer-friendly Version Interactive Discussion
Discussion
P
a
per
|
Discussion
P
a
per
|
Discussion
P
a
per
|
Discussion
P
a
per
|
Geosci. Model Dev. Discuss., 8, 5643–5670, 2015 www.geosci-model-dev-discuss.net/8/5643/2015/ doi:10.5194/gmdd-8-5643-2015
© Author(s) 2015. CC Attribution 3.0 License.
This discussion paper is/has been under review for the journal Geoscientific Model Development (GMD). Please refer to the corresponding final paper in GMD if available.
Experiments on sensitivity of meridional
circulation and ozone flux to
parameterizations of orographic gravity
waves and QBO phases in a general
circulation model of the middle
atmosphere
A. V. Koval1, N. M. Gavrilov1, A. I. Pogoreltsev2, and E. N. Savenkova1
1
Atmospheric Physics Department, Saint-Petersburg State University, Saint-Petersburg, Russia
2
Meteorological Forecast Department, Russian State Hydrometeorological University, Saint-Petersburg, Russia
GMDD
8, 5643–5670, 2015Meridional circulation sensitivity to OGW
and QBO
A. V. Koval et al.
Title Page
Abstract Introduction
Conclusions References
Tables Figures
◭ ◮
◭ ◮
Back Close
Full Screen / Esc
Printer-friendly Version Interactive Discussion
Discussion
P
a
per
|
Discussion
P
a
per
|
Discussion
P
a
per
|
Discussion
P
a
per
|
Received: 12 June 2015 – Accepted: 25 June 2015 – Published: 21 July 2015
Correspondence to: A. V. Koval ([email protected]) and N. M. Gavrilov ([email protected])
GMDD
8, 5643–5670, 2015Meridional circulation sensitivity to OGW
and QBO
A. V. Koval et al.
Title Page
Abstract Introduction
Conclusions References
Tables Figures
◭ ◮
◭ ◮
Back Close
Full Screen / Esc
Printer-friendly Version Interactive Discussion
Discussion
P
a
per
|
Discussion
P
a
per
|
Discussion
P
a
per
|
Discussion
P
a
per
|
Abstract
Many atmospheric global circulation models have large biases in predicting meridional and vertical winds and fluxes of gas species in remote regions such as the middle and upper atmosphere. In this study, we make sensitivity simulations to recognize the role of vital processes associated with dynamical coupling between different
atmo-5
spheric layers, namely dynamical and thermal impacts of mesoscale orographic gravity waves (OGWs) generated by the Earth’s topography and changes from the easterly to westerly QBO phases in the lower equatorial atmosphere. We improved parameteriza-tions of OGW dynamical and thermal effects and QBO flows and implemented them
into a general circulation model of the middle and upper atmosphere used in diff
er-10
ent countries. With this model, we study the sensitivity of meridional circulation and vertical velocity to stationary OGWs and to changes in QBO phases at altitudes up to 100 km in January. We also considered respective changes in vertical ozone fluxes in the atmosphere. Accounting stationary OGW effects gives changes up to 40 % in the
meridional velocity and associated ozone fluxes in the stratosphere. Transitions from
15
the easterly to westerly QBO phase in tropics may significantly alter the meridional and vertical circulation of the middle atmosphere at middle and high latitudes: up to 60 % from the peak respective values. The improved parameterizations of OGW and QBO effects have impacts on other features of the general circulation model, improving the
simulation of general circulation, planetary and tidal wave coupling in the lower, middle
20
and upper atmosphere.
1 Introduction
Ozone transfer between the stratosphere and troposphere has an effect on the total
ozone distribution in the atmosphere and on its content in the troposphere (Danielsen and Mohnen, 1977; Fishman and Crutzen, 1978). The main supposed mechanism
25
of the global ozone transfer between the troposphere and stratosphere is the ozone
GMDD
8, 5643–5670, 2015Meridional circulation sensitivity to OGW
and QBO
A. V. Koval et al.
Title Page
Abstract Introduction
Conclusions References
Tables Figures
◭ ◮
◭ ◮
Back Close
Full Screen / Esc
Printer-friendly Version Interactive Discussion
Discussion
P
a
per
|
Discussion
P
a
per
|
Discussion
P
a
per
|
Discussion
P
a
per
|
ascend at low latitudes and descend at the middle and high latitudes, which is created by the general circulation of the atmosphere (Holton et al., 1995; Holton, 2002). The dynamical and thermal impacts of wave motions can change the general circulation of the atmosphere and thus have an effect on the global ozone transfer.
One of the important factors of dynamical interactions between the lower and
up-5
per atmosphere is energy and momentum transfer by internal atmospheric waves. It is also a substantial contributor to space weather developments (Kelley, 1997). For numerical modeling of the general circulation and thermal regime of the middle and upper atmosphere, it is important to take into account accelerations of the mean flow and heating rates produced by dissipating internal waves. One of the major sources of
10
atmospheric waves is the Earth’s topography (Gossard and Hooke, 1975). Propagation of the orographic gravity waves (OGWs), generated at the Erath’s surface, into the mid-dle and upper atmosphere significantly affects the atmospheric general circulation as
well as ozone transport in the middle atmosphere. Simplified algorithms to parameter-ize thermal and dynamical effects of orographic waves have been developed (e.g., Kim
15
and Arakawa, 1995; Lott and Miller, 1997; Scinocca and McFarlane, 2000; Vosper and Brown, 2007; Catry et al., 2008; Geller et al., 2011). Gavrilov and Koval (2013) devel-oped a parameterization of dynamical and thermal effects of stationary OGWs
gener-ated by the surface topography and propagating into the middle and upper atmosphere. They implemented the parameterization into a general circulation atmospheric model
20
(Gavrilov et al., 2013a) and showed that OGWs may produce substantial changes of the general atmospheric circulation in the middle and upper atmosphere.
Gavrilov et al. (2014) performed numerical experiments with a general circulation model of the troposphere and stratosphere and examined the influence of OGWs prop-agating upward from the Earth’s surface on the zonal-mean meridional and vertical
ve-25
GMDD
8, 5643–5670, 2015Meridional circulation sensitivity to OGW
and QBO
A. V. Koval et al.
Title Page
Abstract Introduction
Conclusions References
Tables Figures
◭ ◮
◭ ◮
Back Close
Full Screen / Esc
Printer-friendly Version Interactive Discussion
Discussion
P
a
per
|
Discussion
P
a
per
|
Discussion
P
a
per
|
Discussion
P
a
per
|
just one-month average meteorology information for January 2004 and two-dimension zonal-mean ozone distribution.
In the present study, we continue these sensitivity experiments using ten-year av-erage meteorological information and three-dimensional ozone distribution, which is a combination of three semiempirical models of ozone mixing ratio (Suvorova and
5
Pogoreltsev, 2011). We focus our experiments on the sensitivity of meridional circu-lation, vertical velocity, meridional and vertical ozone fluxes in the middle atmosphere to OGW dynamical and thermal effects and changes in QBO phases.
Quasi-biennial changes of the zonal wind direction near equator in the middle at-mosphere, the quasi-biennial oscillations (QBO), can affect the general circulation of
10
the atmosphere at middle and high latitudes (e.g. Baldwin et al., 2001). Therefore, we performed numerical experiments for the background and initial conditions typical for the westerly and easterly QBO phases. The sensitivity experiments are essential for better understanding of the roles of different factors in formation of global dynamical
processes, in transport and mixing of atmospheric gas components and in dynamical
15
coupling of different layers of the lower, middle and upper atmosphere.
2 Numerical model and parameterizations
For experiments studying dependencies of the atmospheric dynamics and ozone fluxes on OGW and QBO phase parameterizations, we use the global circulation of themiddle and upper atmosphere model(MUAM) (Pogoreltsev, 2007; Pogoreltsev et al., 2007).
20
2.1 MUAM general circulation model
The MUAM is a modification of the COMMA_LIM (Cologne Model of the Middle At-mosphere – Leipzig Institute for Meteorology, Froehlich et al., 2003). Both modifica-tions came from the original COMMA model developed in Cologne University, Ger-many (Ebel et al., 1995). Gavrilov et al. (2005) described briefly the main equations
25
GMDD
8, 5643–5670, 2015Meridional circulation sensitivity to OGW
and QBO
A. V. Koval et al.
Title Page
Abstract Introduction
Conclusions References
Tables Figures
◭ ◮
◭ ◮
Back Close
Full Screen / Esc
Printer-friendly Version Interactive Discussion
Discussion
P
a
per
|
Discussion
P
a
per
|
Discussion
P
a
per
|
Discussion
P
a
per
|
and physical processes of the model. The horizontal grid spacing is 5◦ and 5.625◦ in latitude and longitude, respectively. The model has 48 vertical levels the log-isobaric coordinate covering altitude range from 0 to 135 km.
The MUAM includes a three-dimensional distribution of the ozone mixing ratio, which takes into account the climatic (averaged for years 1996–2005) longitudinal ozone
5
inhomogeneities (Suvorova and Pogoreltsev, 2011). The model combines data from three data sets of the ozone mixing ratio, namely the ECMWF (European Centre for Medium_Range Weather Forecasts, project ERA_40) at pressure levels from 1000 to 30 hPa; the data of GOME (Global Ozone Monitoring Experiment) between 10 and 0.3 hPa, and the Berlin Ozone Model from 0.3 to 0.003 hPa. Between 30 and 10 hPa,
10
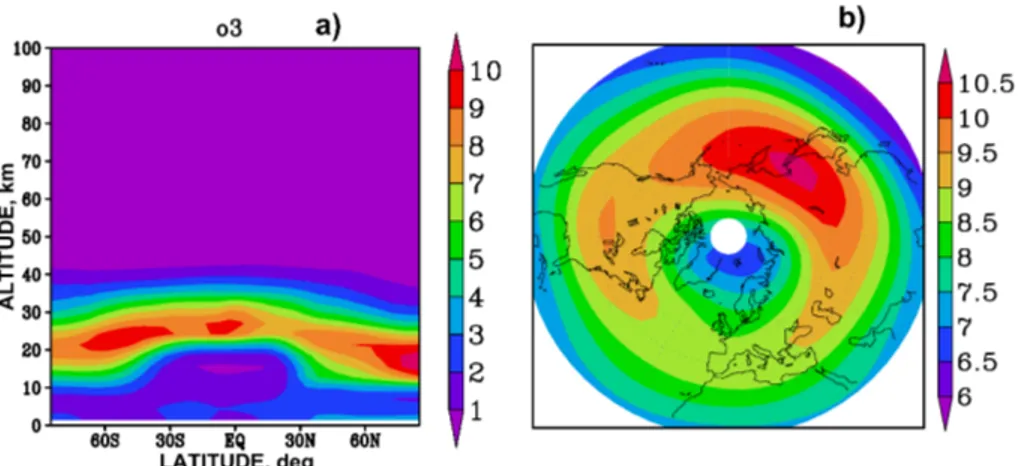
the ozone mixing ratios are interpolated using the ECMWF and GOME sets. At the level of 0.3 hPa, the ozone mixing ratio is calculated as the mean between the GOME and Berlin Ozone Model values. Figure 1 illustrates distributions of ozone number con-centration used in the present simulations. Suvorova and Pogoreltsev (2011) verified the ozone distribution used in the MUAM numerical model by comparing it with the
15
empirical model by Randel and Wu (2005).
Previous numerical experiments showed that MUAM can fairly well reproduce cli-matological mean distributions, but sometimes underestimates seasonal variability. To improve that, a parameterization of the normal atmospheric modes is included into MUAM (Pogoreltsev et al., 2014).
20
2.2 QBO wind and temperature parameterization
Essential characteristics of the middle atmosphere flows are the quasi-biennial os-cillations of the zonal wind at equatorial latitudes (Baldwin et al., 2001). The MUAM does not give accurate modeling of tropospheric dynamics. To parameterize QBOs of zonal wind in the low-latitude troposphere–stratosphere, Pogoreltsev et al. (2014)
25
GMDD
8, 5643–5670, 2015Meridional circulation sensitivity to OGW
and QBO
A. V. Koval et al.
Title Page
Abstract Introduction
Conclusions References
Tables Figures
◭ ◮
◭ ◮
Back Close
Full Screen / Esc
Printer-friendly Version Interactive Discussion
Discussion
P
a
per
|
Discussion
P
a
per
|
Discussion
P
a
per
|
Discussion
P
a
per
|
respective climatological zonal-mean averagesuc andTc:
a=−Φ(φ,z)(u0−uc)/τ, e=−Φ(φ,z)(T0−Tc)/τ (1)
whereϕ and z are latitude and altitude, respectively;Φ(ϕ,z) is a function, which is
equal to 1 at the equator near the ground and smoothly tends to 0 near the latitudes 17.5◦S and 17.5◦N and altitude 50 km;τis the relaxation time. Climatological averages
5
uc(ϕ,z) andTc(ϕ,z) in Eq. (1) were obtained from the UK Met Office data separately
for years with the easterly and westerly QBO phases (see below). In the present study, we used the generalized bell-shaped functions (MathWorks, 2015) forΦ(ϕ,z), and the
relaxation timeτwas tuned equal to 5 days.
To determine the easterly and westerly QBO phases, Holton and Tan (1980),
Ya-10
mashita et al. (2011), and Inoue et al. (2011) used directions of, respectively, westward and eastward winds detected in the low-latitude stratosphere. Huesmann and Hitch-man (2001) studied QBOs from the NCEP reanalysis data and found that average zonal winds and their annual cycles can give asymmetries in the descent rates of westerly and easterly QBO wind zones. To reduce such asymmetries, Huesmann and
Hitch-15
man (2001) used the equatorial zonal wind shear anomaly index representing zonal wind differences at two stratospheric heights. To diminish asymmetries in the westerly
and easterly wind zones, Pogoreltsev et al. (2014) used the UK Met Office data for
January during years 1992–2011 to analyze signs of deviations of annual-mean and climatological (averaged for 20 years) zonal velocities over the equator.
20
The positive and negative deviations correspond to the westerly and easterly QBO phases, respectively. Pogoreltsev et al. (2014) found maximum zonal velocity devia-tions at altitudes 30–35 km, selected years with different QBO phases and calculated
average zonal-mean distributions of the zonal wind and temperature for the years with easterly and westerly QBO phases. In this study, we used these distributions as the
cli-25
matological average winds and temperaturesucand Tcin Eq. (1) at altitudes 0–50 km
and latitudes from 17.5◦S and 17.5◦N. Examples of the average distributions of the
GMDD
8, 5643–5670, 2015Meridional circulation sensitivity to OGW
and QBO
A. V. Koval et al.
Title Page
Abstract Introduction
Conclusions References
Tables Figures
◭ ◮
◭ ◮
Back Close
Full Screen / Esc
Printer-friendly Version Interactive Discussion
Discussion
P
a
per
|
Discussion
P
a
per
|
Discussion
P
a
per
|
Discussion
P
a
per
|
zonal wind and their deviations from the climatological means one can find in Figs. 1 and 2 of the paper by Pogoreltsev et al. (2014).
Many studies defined QBO phases using wind measurements at lower than 30– 35 km altitudes (e.g., Holton and Tan, 1980; Giorgetta et al., 1999; Inoue et al., 2011; Yamashita et al., 2011; Watson and Gray, 2015; Krismer and Giorgetta, 2014).
West-5
erly and easterly QBO wind zones have wavelike structures vs. altitude with vertical wavelengths about 20 km (e.g., Baldwin et al., 2001; Huesmann and Hitchman, 2001). Therefore, timing of the westerly and easterly winds very much depends on altitudes of their determination. Such vertical phase shifts one should keep in mind, when compare QBO phases determined at different altitudes and pressure levels.
10
2.3 Parameterization of OGW effects
For studying the OGW influence on atmospheric dynamics, we implemented the pa-rameterization of dynamical and thermal effects of stationary OGWs (Gavrilov and
Ko-val, 2013) into the MUAM. To calculate vertical profiles of the total vertical wave energy flux and the associated accelerations of the mean horizontal winds by stationary OGWs
15
with ground-based observed frequencies σ=0, the parameterization uses wave
po-larization relations that take into account rotation of the atmosphere. Propagation of OGWs in dissipative vertically inhomogeneous atmosphere leads to energy exchange between the background flow and waves, and to heating of the atmosphere due to wave energy dissipation. To describe correctly the energy balance of the considered
20
dynamical processes, we use analytical relations between the rate of wave energy dis-sipation and wave acceleration for nonzero vertical gradients of the mean wind (see Gavrilov and Koval, 2013).
In many cases, mesoscale disturbances of atmospheric parameters produced by air overflowing mountains can be qualified as internal gravity waves having observed
fre-25
quencies σ=0 relative to the ground (e.g. Gossard and Hooke, 1975). When these
GMDD
8, 5643–5670, 2015Meridional circulation sensitivity to OGW
and QBO
A. V. Koval et al.
Title Page
Abstract Introduction
Conclusions References
Tables Figures
◭ ◮
◭ ◮
Back Close
Full Screen / Esc
Printer-friendly Version Interactive Discussion
Discussion
P
a
per
|
Discussion
P
a
per
|
Discussion
P
a
per
|
Discussion
P
a
per
|
the atmosphere. Gavrilov (1990) obtained the wave energy equation for the horizontally homogeneous and stationary atmosphere, which has the following form:
∂FE
∂z =−ρD−ρvαawα, awα=−
1
ρ
∂ρvα′w′
∂z ,
FE=p′w′+ρvαvα′w′−(σzβ′ +τ
′
zβ)v
′
β (2)
wherepand ρ are atmospheric pressure and density, respectively; vα andw are ve-5
locity components along horizontal axesxα and vertical axisz, respectively; repeating Greek indices denote summation;FE is the total wave energy flux summarizing wave
energy propagation and its transfer by background flow and turbulent and molecular diffusion;D is the wave energy dissipation rate;awα are components of of the mean
flow acceleration by waves;τσβandσαβare tensors of turbulent and molecular viscous 10
stresses; primes indicate wave quantities and overbars mean averaging respective val-ues across the wave period.
The right side of the first equation in Eq. (2) contains the wave energy dissipation rate and the work of forces caused by nonlinear wave-mean flow interactions. Assum-ing nonzero vertical gradient of the mean wind, Gavrilov (1990, 1997) found
approxi-15
mate analytical relations between the wave energy dissipation rate and the wave ac-celeration and obtained expressions for the total heating rateεw and for FE produced
by mesoscale atmospheric waves. Unfortunately, these expressions giveFE→0 and
εw→0 for stationary waves withσ→0. To get more correct formulae for εw andFE, Gavrilov and Koval (2013) took into consideration rotation of the atmosphere.
Tradi-20
tional theory of gravity waves in flat rotating atmosphere (e.g., Gossard and Hooke, 1975) provides polarization relations. They are simple forσ=0 and large horizontal
k2≫(f /c)2and vertical|m| ≫1/(2H) wave numbers (wherecis the sound speed,H
is the density scale height,f is the parameter of Coriolis). For such waves, Gavrilov and Koval (2013) obtained the following expressions for the total flux of wave energy, the
25
total heating rateεwand for wave acceleration along axisxk parallel to the horizontal
GMDD
8, 5643–5670, 2015Meridional circulation sensitivity to OGW
and QBO
A. V. Koval et al.
Title Page Abstract Introduction Conclusions References Tables Figures ◭ ◮ ◭ ◮ Back Close
Full Screen / Esc
Printer-friendly Version Interactive Discussion Discussion P a per | Discussion P a per | Discussion P a per | Discussion P a per |
wave number produced by mesoscale stationary waves:
FE=−
ρf2U2
2mkvk; m
2=N
2
v2k
1− f
2
k2v2
k
!−1
. (3)
awk=−
m2U2
2vk
(ν+Kz)
1+ 1
(γ−1)P r
;
εw=(ν+Kz)δm2U2,
whereKzandνare kinematic turbulent and molecular viscosities;P r is effective Prandl
5
number;Nis Brunt–Väisälä frequency;δis a factor, which depends on vertical gradient of horizontal mean velocity (see Gavrilov and Koval, 2013). Atδ=1, the formula forεw
in Eq. (2) corresponds to the expression for the wave energy dissipation rate caused by turbulent and molecular viscosity. Using Eq. (2) and the first formula in Eq. (3), one can obtain the approximate equation describing altitude variations ofU2(see Eq. (6) in
10
the paper by Gavrilov and Koval, 2013). Solving this equation within a step of vertical grid, Gavrilov and Koval (2013) obtained the recurrent formula calculatingUi2+1at the i+1 vertical node using the valueU2
i at thenth grid node, which has the following form:
Ui2+1= ri
ri+1 Ui2exp
−si ri
∆z
; (4)
ri = ρif
2
2|k|Ni
v u u t1−
f2
k2v2
ξ
, si=ρi(νi+Kzi)m2
iδi, 15
where indicesi denote the values at the vertical grid node with heightz=zi. Specifying
U02at the bottom boundary, we can use Eq. (4) to calculateUi2at all heights for speci-fied vertical profiles of the mean wind and temperature. Then Eq. (2) let us getting total heating rates and wave accelerations generated by OGW, which can introduce heat-ing and dynamical effects of mesoscale stationary orographic waves in atmospheric
20
GMDD
8, 5643–5670, 2015Meridional circulation sensitivity to OGW
and QBO
A. V. Koval et al.
Title Page
Abstract Introduction
Conclusions References
Tables Figures
◭ ◮
◭ ◮
Back Close
Full Screen / Esc
Printer-friendly Version Interactive Discussion
Discussion
P
a
per
|
Discussion
P
a
per
|
Discussion
P
a
per
|
Discussion
P
a
per
|
To parameterize mesoscale topography, we used a modification of the method de-veloped by Scinocca and McFarlane (2000). This method of the “subgrid orography” takes into account height variations of the Earth’s surface with horizontal scales smaller than the horizontal grid spacing of the MUAM. We separated the so-called subgrid to-pography applying low- and high-frequency numerical filters to the realistic horizontal
5
distributions of the surface (Gavrilov and Koval, 2013). Near each model grid point, we applied an elliptical approximation of the filtered subgrid-scale topography (Lott and Miller, 1997). At the low boundary, we determine OGW amplitudes and effective
hori-zontal wave numbers using the analysis of forces acting on the atmospheric flow mov-ing over the effective elliptical mountain barrier developed by Phillips (1984). These
10
quantities are required for computing the vertical profiles of wave accelerations and heat fluxes, as was described by Gavrilov and Koval (2013). For practical implementa-tion of our OGW parameterizaimplementa-tion in this study, we used the ETOPO2 (2015) database of the Earth’s surface elevations with resolution of two angle minutes along latitude and longitude.
15
3 Description of numerical experiments
To study influence of described above parameterizations in the MUAM general circu-lation model we performed standard sensitivity experiments including and excluding the parameterizations and comparing results of simulations. In the present study, we concentrate on the sensitivity of meridional circulation and vertical ozone fluxes to the
20
inclusion of OGW effects and QBO phase parameterizations into the MUAM.
The MUAM vertical grid has equidistant spacing vs. the log-pressure coordinatez=
H·ln(p0p
−1
), whereH=7 km andp0is pressure at the Earth’s surface. This coordinate
is very close to the geopotential height up to 100–150 km. In this simulations, we utilized the version of MUAM with 48 altitude points (with spacing of 2.8 km), and used the 450 s
25
spacing of time integration. For the analysis, we made 4 h outputs of model data.
GMDD
8, 5643–5670, 2015Meridional circulation sensitivity to OGW
and QBO
A. V. Koval et al.
Title Page
Abstract Introduction
Conclusions References
Tables Figures
◭ ◮
◭ ◮
Back Close
Full Screen / Esc
Printer-friendly Version Interactive Discussion
Discussion
P
a
per
|
Discussion
P
a
per
|
Discussion
P
a
per
|
Discussion
P
a
per
|
Simulations started from an initial state without wind and with temperature height-latitude structures given by the atmospheric model MSISE (Hedin, 1991) for January. We executed several “adjustment” stages during the first model days. During the first 30 days of simulations, we fixed geopotential heights at the bottom boundary, and do not incorporate the parameterization of OGW effects. After the 30st model day, the
5
empirical changes of the surface geopotential heights and OGW effects are included.
The model used the daily mean heating rates in the first 140 model days, and their daily variations are gradually involved after that. A prognostic equation for the geopotential at the Earth’s surface was added after the 140st day of simulations. The simulations after the 330 day involved seasonal variations of solar heating. We adjusted starting
10
dates of the simulations so that the 330–390 model days match to January–February.
4 Results of sensitivity experiments
We used the described above MUAM model with included parameterizations of OGW dynamical and thermal effects (Sect. 2.1) and QBO phases (Sect. 2.1) in numerical
experiments simulating the changes in the meridional and vertical velocities in the
mid-15
dle atmosphere. In addition, we studied changes in global-scale ozone fluxes in the middle atmosphere caused by orographic waves generated by the Earth’s surface to-pography and by the changes in QBO phase. In the experiments, the meridional and vertical components of wind velocity were simulated for every set of initial data with and without inclusion of the OGW parameterization for the conditions corresponding to
20
the easterly and westerly QBO phases. The differences in values between these
cal-culations demonstrate respective velocity differences. Their positive or negative values
GMDD
8, 5643–5670, 2015Meridional circulation sensitivity to OGW
and QBO
A. V. Koval et al.
Title Page
Abstract Introduction
Conclusions References
Tables Figures
◭ ◮
◭ ◮
Back Close
Full Screen / Esc
Printer-friendly Version Interactive Discussion
Discussion
P
a
per
|
Discussion
P
a
per
|
Discussion
P
a
per
|
Discussion
P
a
per
|
4.1 Meridional circulation
Figure 2a presents an example of simulated height-latitude distribution of the zonal-mean meridional velocity, averaged over January for the easterly QBO phase without OGW parameterization. Lines with arrows correspond to schematic zonal averaged streamlines calculated using the values of vertical velocityw multiplied by a factor of
5
103 for the sake of illustration. A global meridional cell ascending in high and middle latitudes of the summer (southern) hemisphere and descending in winter (northern) hemisphere exists in Fig. 2a above 50–60 km. Below these heights, in Fig. 1a one can see additional ascend at latitudes 50–70◦N and descend at 50–70◦ forming local circulation sub-cells in both hemispheres.
10
Figure 2b shows simulated meridional velocity differences (MVD) caused by the
in-clusion of OGW parameterization into MUAM for the eastern QBO phase. One can see regions of increases or decreases (positive or negative MVD) in the meridional velocity after inclusion of the OGW effects. Hypotheses about nonzero differences in the
merid-ional winds in Fig. 1b can be verified with the statistical Student’s t test (e.g., Rice,
15
2006). Monthly mean meridional velocities at each latitude and altitude in the MUAM model are averaged over 187×64=11 968 grid values in time (4 h outputs) and
longi-tude. From the model runs for the easterly QBO phase with and without OGW effects
and for both QBO phases without OGWs, we can get, respectively, 11 968 pairs of meridional velocities for comparison in each case. Pairedt tests (Rice, 2006) showed
20
higher than 95 % confidences of nonzero monthly mean meridional wind differences in
all latitude-altitude grid points used for plotting Fig. 2b, where their absolute values are larger than 0.1 m s−1. In many cases in Fig. 2b, MVD signs are opposite to those of the meridional velocity in Fig. 2a. Therefore, OGW dynamical and heating effects may lead
to a weakening of simulated zonal-mean meridional circulation fluxes. Maximum MVDs
25
in Fig. 2b can reach±(30–40) % of the zonal-mean meridional velocities at respective heights and latitudes in Fig. 2a.
GMDD
8, 5643–5670, 2015Meridional circulation sensitivity to OGW
and QBO
A. V. Koval et al.
Title Page
Abstract Introduction
Conclusions References
Tables Figures
◭ ◮
◭ ◮
Back Close
Full Screen / Esc
Printer-friendly Version Interactive Discussion
Discussion
P
a
per
|
Discussion
P
a
per
|
Discussion
P
a
per
|
Discussion
P
a
per
|
Simulated MVDs caused by the change from the easterly to westerly QBO phase without inclusion of the OGW effects are shown in Fig. 2c. Application of pairedttests
for verification of nonzero MVDs in Fig. 2c gave the same results as those described above for Fig. 2b. There is the main maximum at high latitudes of the Northern Hemi-sphere at altitudes 40–60 km in Fig. 2c. This corresponds to significant weakening of
5
the simulated southward meridional flux (up to 60 %) there. The MVD minimum at alti-tudes 80–100 km at high latialti-tudes of Southern Hemisphere corresponds to a decrease in the zonal-mean northward meridional velocity up to about 10 %.
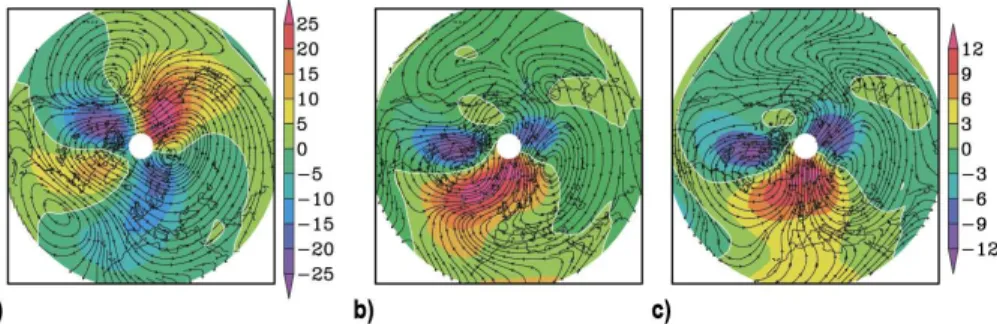
Figure 3a shows the North Pole stereographic projection of the simulated meridional wind (shaded areas) at altitude 25 km averaged over January without OGW effects and
10
respective streamlines. Figures 3b and c give differences in meridional winds caused
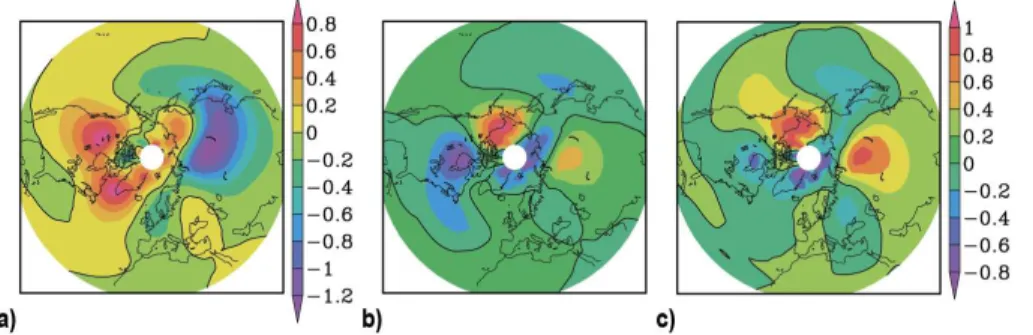
by inclusions of the OGW parameterization (sect. 2.3) and change from the easterly to the westerly QBO phase. Figure 4 is similar to Fig. 3 and reveals simulated January mean vertical velocities and their differences produced by OGW effects and changes
in QBO phases. Peak values of the differences in Figs. 3b and c, 4b and c can reach
15
up to±(50–100) % of the respective peak values shown in Figs. 3a and 4a. Therefore, including OGW dynamical and thermal effects and changes in QBO phases in our
experiments may produce substantial changes in vertical and meridional velocities in the middle atmosphere simulated with the MUAM model at middle and high latitudes.
4.2 Vertical ozone fluxes 20
The mean vertical ozone fluxFozi at the grid node with the numberi is calculated with
the expression
Fozi=Noziwi; Nozi=10−6ρiXoziNA/ρ0, (5)
wherewi is the monthly mean vertical velocity,Noziis the ozone number concentration,
ρ0is the ground density of the atmosphere at normal conditions,Xoziis the zonal-mean
25
GMDD
8, 5643–5670, 2015Meridional circulation sensitivity to OGW
and QBO
A. V. Koval et al.
Title Page
Abstract Introduction
Conclusions References
Tables Figures
◭ ◮
◭ ◮
Back Close
Full Screen / Esc
Printer-friendly Version Interactive Discussion
Discussion
P
a
per
|
Discussion
P
a
per
|
Discussion
P
a
per
|
Discussion
P
a
per
|
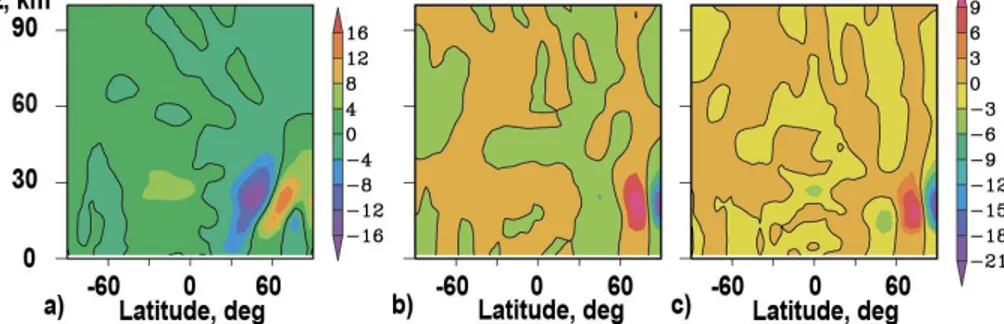
Figure 5a presents the simulated altitude-latitude structure of the zonal-mean vertical ozone flux calculated with Eq. (5) for January, eastern QBO phase and without inclusion of the OGW parameterization. Above 50–60 km, one can see global cell of ozone flux with ascend of ozone in the Southern Hemisphere and ozone descend in the Northern Hemisphere. This correlates with distributions of vertical and meridional velocities in
5
Fig. 2a, and with existing knowledge about ozone transfer by the general circulation of the atmosphere (Holton et al., 1995; Holton, 2002). Below 50–60 km, additional ascend exists in Fig. 5a at high latitudes of winter (northern) hemisphere caused by the Polar Vortex and ascend in the middle and high latitudes of summer (southern) hemisphere. Therefore, in Fig. 5a one can observe areas of positive and negative ozone fluxes at
10
middle and high latitudes of the Northern Hemisphere. This leads to the appearance of additional cells of ozone transport in the middle and high latitudes analogous to cells of the meridional circulation in Fig. 2a.
The zonal-mean vertical ozone flux differences (OFDs) due to the inclusion of the
OGW parameterization into the MUAM model for January are plotted in Fig. 5b. One
15
can see regions of positive and negative OFD values, which correspond to increases or decreases in vertical ozone fluxes. Figure 5c presents OFDs due to change from the easterly to the westerly QBO phase and shows substantial differences in vertical ozone
fluxes at altitudes 10–40 km in the Northern Hemisphere (similar to Fig. 5b) and their substantial changes near equator. In summer (southern) hemisphere OFD are smaller
20
in Fig. 5b. This can be explained by better conditions of OGW propagation and by the stronger influence of orographic waves on the general circulation of the atmosphere in winter hemispheres as compared to summer ones (Gavrilov and Koval, 2013; Gavrilov et al., 2013a).
Differences in local vertical ozone fluxes in Fig. 5b and c may change global ozone
25
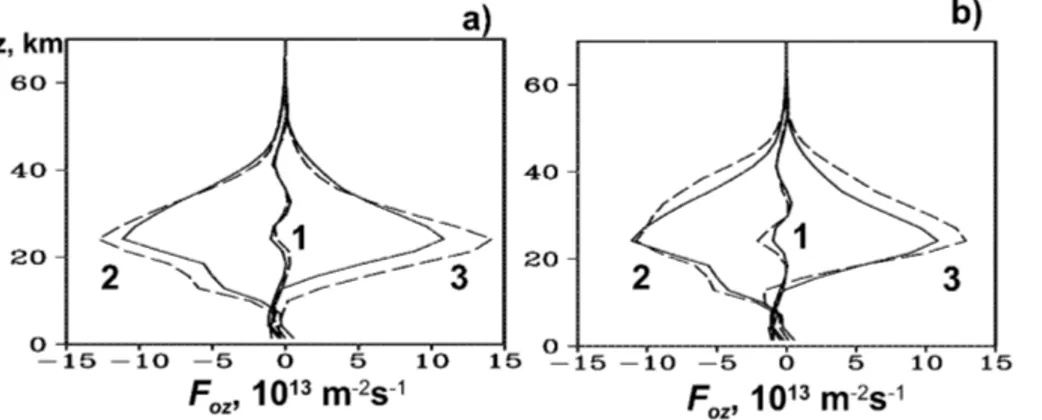
transfer. Figure 6 gives the January mean vertical ozone fluxes averaged for different
latitude belts 0–30◦N, 30–60◦N and 60–90◦N for the easterly QBO without QGW ef-fects (solid lines). One can see that at altitudes of the maximum of ozone number
GMDD
8, 5643–5670, 2015Meridional circulation sensitivity to OGW
and QBO
A. V. Koval et al.
Title Page
Abstract Introduction
Conclusions References
Tables Figures
◭ ◮
◭ ◮
Back Close
Full Screen / Esc
Printer-friendly Version Interactive Discussion
Discussion
P
a
per
|
Discussion
P
a
per
|
Discussion
P
a
per
|
Discussion
P
a
per
|
centration 20–30 km the main ascendingFoz>0 exists at high latitudes of the Northern
Hemisphere, which are approximately equal to descendingFoz<0 at middle latitudes.
Dashed lines in Fig. 6a show respective vertical ozone fluxes for the easterly QBO simulated with the OGW parameterization included into the MUAM. They show that dy-namical and thermal OGW effects substantially (up to 20–30 %) increase absolute
val-5
ues of ascending and descendingFozat middle and high northern latitudes. In Fig. 6b,
dashed lines show Foz simulated for the westerly QBO phase without OGW effects.
Absolute values of these ozone fluxes are by 10–20 % larger above altitudes 20–25 km than those for the easterly QBO phase.
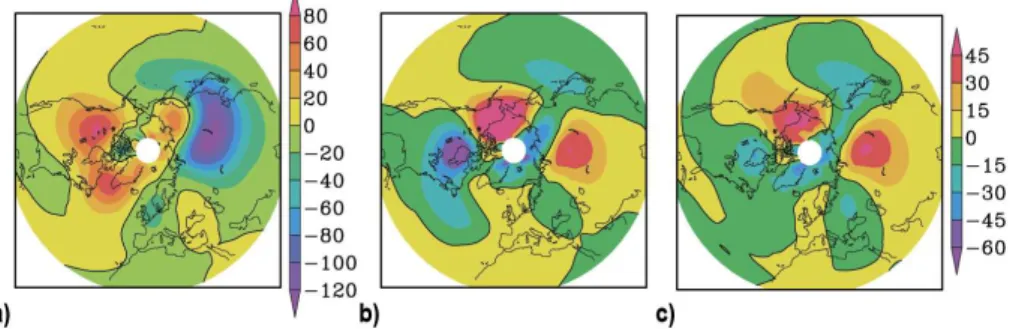
Figure 7a shows the horizontal distribution of the vertical ozone flux at altitude 25 km
10
calculated with the MUAM for the easterly QBO phase without OGW effects and
av-eraged over January. It corresponds to the vertical wind distribution shown in Fig. 4a. The main downward ozone fluxes occur over Siberia, while upward ozone fluxes exist over North America and Greenland.
Figure 7b and c reveal ozone flux differences caused by OGW effects for the
east-15
erly QBO phase and by changes in QBO phase without OGWs. There are areas of enhancement or weakening of the ozone flux corresponding to the regions of posi-tive and negaposi-tive VVDs in Fig. 4b and c. Peak differences of the ozone flux in Fig. 7b
and c can reach 40–60 % of the flux peak values shown in Fig. 7a. Pairedttests (see above) confirmed higher than 95 % confidences of nonzero monthly mean ozone flux
20
differences in about 1100 of 1728 (∼64 %) latitude-altitude grid points used for
plot-ting Fig. 7b and c. Smaller than 95 % confidences were obtained only in regions with smallest absolute monthly mean ozone flux differences in Fig. 7b and c.
Results of numerical experiments in Figs. 5–7 expose that global-scale vertical ozone fluxes in the MUAM model are very sensitive to OGW dynamical and thermal
25
effects, as well as to changes in QBO phase. These processes require proper
param-GMDD
8, 5643–5670, 2015Meridional circulation sensitivity to OGW
and QBO
A. V. Koval et al.
Title Page
Abstract Introduction
Conclusions References
Tables Figures
◭ ◮
◭ ◮
Back Close
Full Screen / Esc
Printer-friendly Version Interactive Discussion
Discussion
P
a
per
|
Discussion
P
a
per
|
Discussion
P
a
per
|
Discussion
P
a
per
|
eterizations of OGW and QBO effects advance other MUAM features, getting better
the simulation of coupling general circulation, planetary and tidal waves in the lower, middle and upper atmosphere (see Gavrilov et al., 2013a, b).
5 Conclusions
In the present paper, we described numerical experiments with the MUAM model
sim-5
ulating the general circulation in the middle atmosphere using ten-year average mete-orological information and three-dimensional ozone distribution. We focus our exper-iments on the sensitivity of meridional circulation, vertical velocity and vertical ozone fluxes in the middle atmosphere to inclusions of recently developed parameterizations of OGW dynamical and thermal effects and changes in QBO phases to understand
10
the role of vital processes associated with dynamical coupling between different
atmo-spheric layers in general circulation models. We performed numerical experiments for the background and initial conditions typical for the westerly and easterly QBO phases in the equatorial atmosphere.
Our experiments show that OGW dynamical and heating effects may lead to changes
15
in zonal-mean meridional circulation fluxes. Maximum differences of meridional
ve-locity can reach ±(30–40) % of the zonal-mean meridional velocities at respective heights and latitudes. Changes from easterly to westerly QBO phase produce signif-icant changes (up to 60 %) in meridional velocities at altitudes 40–60 km. Respective peak changes in vertical velocities can be up to 100 % of the maximum and minimum
20
mean vertical velocities.
Simulated absolute peak differences in the zonal-mean vertical ozone flux values
caused by OGW effects and changes in QBO phases in the Northern Hemisphere
can reach 20–50 % of extreme ozone fluxes at altitudes 10–40 km. Geographical areas of enhancing or weakening the ozone fluxes correspond to the regions of positive or
25
negative differences of vertical velocity. Peak differences of the ozone flux can reach
40–60 % of the flux peak values.
GMDD
8, 5643–5670, 2015Meridional circulation sensitivity to OGW
and QBO
A. V. Koval et al.
Title Page
Abstract Introduction
Conclusions References
Tables Figures
◭ ◮
◭ ◮
Back Close
Full Screen / Esc
Printer-friendly Version Interactive Discussion
Discussion
P
a
per
|
Discussion
P
a
per
|
Discussion
P
a
per
|
Discussion
P
a
per
|
The sensitivity experiments are essential for better understanding of the roles of dif-ferent factors of general circulation models in formation of global dynamical processes and in transport and mixing of atmospheric gas components. The study shows that global-scale vertical ozone fluxes in the MUAM model are very sensitive to the param-eterizations of OGW dynamical and thermal effects and changes in QBO phases. We
5
studied only pure dynamical changes in the ozone fluxes, because MUAM does not simulate changes in atmospheric composition.
The parameterizations of OGW and QBO effects improve other MUAM features,
al-lowing better simulations of coupled general circulation and wave processes in the lower, middle and upper atmosphere.
10
Code availability
The MUAM FORTRAN code is based on the COMMA-LIM and MUAM models de-scribed at http://home.uni-leipzig.de/jacobi/comma/fo_comma.htm. The MUAM code is registered at the Russian Federal Service for Intellectual Property (Sertificate 2014613929). The code can be distributed and used with the permission from the
15
Russian State Hydro-Meteorological University. Access to the fully functional demo-version of the MUAM computer code, which calculates the experiments described in the present paper, can be granted on demand by request to Andrey Koval ([email protected]), or Alexander Pogoreltsev ([email protected]). Any questions should be directed to the authors.
20
Acknowledgements. This work was partly supported by the Russian Basic Research Founda-tion and by the Russian Scientific FoundaFounda-tion (grant 14-17-00685).
References
Baldwin, M. P., Gray, L. J., Dunkerton, T. J., Hamilton, K., Haynes, P. H., Randel, W. J., Holton, J. R., Alexander, M. J., Hirota, I., Horinouchi, T., Jones, D. B. A., Kinnersley, J. S.,
GMDD
8, 5643–5670, 2015Meridional circulation sensitivity to OGW
and QBO
A. V. Koval et al.
Title Page
Abstract Introduction
Conclusions References
Tables Figures
◭ ◮
◭ ◮
Back Close
Full Screen / Esc
Printer-friendly Version Interactive Discussion
Discussion
P
a
per
|
Discussion
P
a
per
|
Discussion
P
a
per
|
Discussion
P
a
per
|
Marquardt, C., Sato, K., and Takahashi, M.: The quasi-biennial oscillation, Rev. Geophys., 39, 179–229, 2001.
Catry, B., Geleyn, J. F., Bouyssel, F., Cedilnik, J., Broo, R., Derková, M., and Mladek, R.: A new sub-grid scale lift formulation in a mountain drag parameterisation scheme, Meteorol. Z., 17, 193–208, 2008.
5
Danielsen, E. F. and Mohnen, J.: Project dustorm report: ozone transport, in situ measurements and meteorological analyses of tropopause folding, J. Geophys. Res., 82, 5867–5877, 1977. Ebel, A., Berger, U., and Krueger, B. C.: Numerical simulations with COMMA, a global model
of the middle atmosphere, SIMPO Newsletter, 12, 22–32, 1995.
ETOPO2: Global Gridded, 2 min Database, National Geophysical Data Center, National
10
Oceanic and Atmospheric Administration, US Dept. of Commerce, available at: http://www. ngdc.noaa.gov/mgg/global/etopo2.html(last access on: 01 February 2015), 2015.
Fishman, J. and Crutzen, P. J.: The origin of ozone in the troposphere, Nature, 274, 855–857, 1978.
Froehlich, K., Pogoreltsev, A., and Jacobi, C.: Numerical simulation of tides, Rossby and Kelvin
15
waves with the COMMA-LIM model, Adv. Space Res., 32, 863–868, 2003.
Gavrilov, N. M.: Parameterization of accelerations and heat flux divergences produced by internal gravity waves in the middle atmosphere, J. Atmos. Terr. Phys., 52, 707–713, doi:10.1016/0021-9169(90)90003-6, 1990.
Gavrilov, N. M.: Parametrization of momentum and energy depositions from gravity waves
20
generated by tropospheric hydrodynamic sources, Ann. Geophys., 15, 1570–1580, doi:10.1007/s00585-997-1570-4, 1997.
Gavrilov, N. M. and Koval, A. V.: Parameterization of mesoscale stationary orographic wave impact for usage in numerical models of atmospheric dynamics, Izv. Atmos. Ocean. Phys.+, 49, 244–251, doi:10.1134/S0001433813030067, 2013.
25
Gavrilov, N. M., Pogoreltsev, A. I., and Jacobi, C.: Numerical modeling of the effect of
latitude-inhomogeneous gravity waves on the circulation of the middle atmosphere, Izv. Atmos. Ocean. Phys.+, 41, 9–18, 2005.
Gavrilov, N. M., Koval, A. V., Pogoreltsev, A. I., and Savenkova, E. N.: Numerical simulation of the response of general circulation of the middle atmosphere to
spa-30
tial inhomogeneities of orographic waves, Izv. Atmos. Ocean. Phys.+, 49, 367–374, doi:10.1134/S0001433813040038, 2013a.
GMDD
8, 5643–5670, 2015Meridional circulation sensitivity to OGW
and QBO
A. V. Koval et al.
Title Page
Abstract Introduction
Conclusions References
Tables Figures
◭ ◮
◭ ◮
Back Close
Full Screen / Esc
Printer-friendly Version Interactive Discussion
Discussion
P
a
per
|
Discussion
P
a
per
|
Discussion
P
a
per
|
Discussion
P
a
per
|
Gavrilov, N. M., Koval, A. V., Pogoreltsev, A. I., and Savenkova, E. N.: Numerical modeling influence of inhomogeneous orographic waves on planetary waves in the middle atmosphere, Adv. Space Res., 51, 2145–2154, doi:10.1016/j.asr.2012.12.024, 2013b.
Gavrilov, N. M., Koval, A. V., Pogoreltsev, A. I., and Savenkova, E. N.: Numerical simula-tion of the influence of stasimula-tionary mesoscale orographic waves on the meridional
circu-5
lation and ozone fluxes in the middle atmosphere, Geomagn. Aeronomy.+, 54, 381–387, doi:10.1134/S0016793214030050, 2014.
Geller, M. A., Zhou, T., and Ruedy, R.: New gravity wave treatments for GISS climate models, J. Climate, 24, 3989–4002, doi:10.1175/2011JCLI4013.1, 2011.
Gossard, E. E. and Hooke, W. H.: Waves in the Atmosphere, Elsevier Sci. Publ. Co.,
Amster-10
dam, Oxford, New York, 1975.
Giorgetta, M. A., Bengtsson, L., and Arpe, K.: An investigation of QBO signals in the east Asian and Indian monsoon in GCM experiments, Clim. Dynam., 15, 435–450, 1999.
Hedin, A. E.: Extension of the MSIS thermospheric model into the middle and lower atmo-sphere, J. Geophys. Res., 96, 1159–1172, doi:10.1029/90JA02125, 1991.
15
Holton, J. and Tan, H.: The influence of the equatorial quasibiennial oscillation on the global circulation at 50 mb, J. Atmos. Sci., 37, 2200–2208, 1980.
Holton, J. R.: Stratosphere–Troposphere Exchange: Global Aspects, Encycl. Atmos. Sci., edited by: Holton, J. R., Curry, J. A. and Pyle, J. A., Academic Press, Amsterdam, New York, Tokyo, 5, 2137–2143, 2002.
20
Holton, J. R., Haynes, P. H., McIntire, M. E., Douglas, A. R., Rood, R. B., and Pfister, L.: Stratosphere–troposphere exchange, Rev. Geophys., 33, 403–439, 1995.
Huesmann, A. S. and Hitchman, M. H.: The stratospheric quasi-biennial oscillation in the NCEP reanalyses: climatological structures, J. Geophys. Res., 106, 11859–11874, doi:10.1029/2001JD900031, 2001.
25
Inoue, M., Takahashi, M., and Naoe, H.: Relationship between the stratospheric quasi-biennial oscillation and tropospheric circulation in northern autumn, J. Geophys. Res., 116, D24115, doi:10.1029/2011JD016040, 2011.
Kelley, M. C.: Aspects of Weather and Space Weather in the Earth’s Upper Atmosphere: the Role of Internal Atmospheric Waves, Int. Sci. Lect. Ser., Nat. Acad. Press, Washington, D. C.,
30
6, 1–31, 1997.
GMDD
8, 5643–5670, 2015Meridional circulation sensitivity to OGW
and QBO
A. V. Koval et al.
Title Page
Abstract Introduction
Conclusions References
Tables Figures
◭ ◮
◭ ◮
Back Close
Full Screen / Esc
Printer-friendly Version Interactive Discussion
Discussion
P
a
per
|
Discussion
P
a
per
|
Discussion
P
a
per
|
Discussion
P
a
per
|
Krismer, T. R. and Giorgetta, M. A.: Wave forcing of the quasi-biennial oscillation in the Max Planck Institute Earth system model, J. Atmos. Sci., 71, 1985–2006, 2014.
Lott, F. and Miller, M. J.: A new subgrid-scale orographic drag parameterization: its formulation and testing, Q. J. Roy. Meteorol. Soc., 123, 101–127, 1997.
MathWorks: Generalized bell-shaped membership function, available at: http://www.
5
mathworks.com/help/fuzzy/gbellmf.html (last access: 10 February 2015), 2015.
Phillips, D. S.: Analytical surface pressure and drag for linear hydrostatic flow over three-dimensional elliptical mountains, J. Atmos. Sci., 41, 1073–1084, 1984.
Pogoreltsev, A. I.: Generation of normal atmospheric modes by stratospheric vacillations, Izv. Atmos. Ocean. Phys.+, 43, 423–435, 2007.
10
Pogoreltsev, A. I., Vlasov, A. A., Froehlich, K., and Jacobi, C.: Planetary waves in cou-pling the lower and upper atmosphere, J. Atmos. Sol.-Terr. Phy., 69, 2083–2101, doi:10.1016/j.jastp.2007.05.014, 2007.
Pogoreltsev, A. I., Savenkova, E. N., and Pertsev, N. N.: Sudden stratospheric warmings: the role of normal atmospheric modes, Geomagn. Aeronomy+, 54, 357–372, 2014.
15
Randel, W. J. and Wu, F.: A stratospheric ozone profile data set for 1979–2005: variabil-ity, trends, and comparisons with column ozone data, J. Geophys. Res., 112, D06313, doi:10.1029/2006JD007339, 2007.
Rice, J. A.: Mathematical statistics and data analysis, 3rd Edn., Duxbury Press, 2006.
Scinocca, J. F. and McFarlane, N. A.: The parameterization of drag induced by stratified flow
20
over anisotropic orography, Q. J. Roy. Meteorol. Soc., 126, 2353–2393, 2000.
Suvorova, E. V. and Pogoreltsev, A. I.: Modeling of nonmigrating tides in the middle atmosphere, Geomag. Aeronomy+, 51, 105–115, 2011.
Vosper, S. B. and Brown, A. R.: The effect of small-scale hills on orographic drag, Q. J. Roy. Meteorol. Soc., 133, 1345–1352, 2007.
25
Watson, P. and Gray, L.: The stratospheric wintertime response to applied extratropical torques and its relationship with the annular mode. Clim. Dyn., 44, 2513–2537, doi:10.1007/s00382-014-2359-2, 2015.
Yamashita, Y., Akiyoshi, H., and Takahashi, M.: Dynamical response in the Northern Hemi-sphere midlatitude and high-latitude winter to the QBO simulated by CCSR/NIES CCM, J.
30
Geophys. Res., 116, D06118, doi:10.1029/2010JD015016, 2011.
GMDD
8, 5643–5670, 2015Meridional circulation sensitivity to OGW
and QBO
A. V. Koval et al.
Title Page
Abstract Introduction
Conclusions References
Tables Figures
◭ ◮
◭ ◮
Back Close
Full Screen / Esc
Printer-friendly Version Interactive Discussion
Discussion
P
a
per
|
Discussion
P
a
per
|
Discussion
P
a
per
|
Discussion
P
a
per
|
Figure 2.Simulated zonal-mean January meridional velocity (in m s−1) and schematic stream-lines for easterly QBO phase without OGW effects(a) and meridional velocity differences (in m s−1) due to inclusion of OGW effects (b)and change from easterly to westerly QBO phase (c).
GMDD
8, 5643–5670, 2015Meridional circulation sensitivity to OGW
and QBO
A. V. Koval et al.
Title Page
Abstract Introduction
Conclusions References
Tables Figures
◭ ◮
◭ ◮
Back Close
Full Screen / Esc
Printer-friendly Version Interactive Discussion
Discussion
P
a
per
|
Discussion
P
a
per
|
Discussion
P
a
per
|
Discussion
P
a
per
|
Figure 3.The North Pole stereographic projection of the simulated January mean meridional velocity (in m s−1) at altitude 25 km for easterly QBO phase without OGW effects(a)and merid-ional velocity differences (in m s−1) due to inclusion of OGW effects(b)and change from
GMDD
8, 5643–5670, 2015Meridional circulation sensitivity to OGW
and QBO
A. V. Koval et al.
Title Page
Abstract Introduction
Conclusions References
Tables Figures
◭ ◮
◭ ◮
Back Close
Full Screen / Esc
Printer-friendly Version Interactive Discussion
Discussion
P
a
per
|
Discussion
P
a
per
|
Discussion
P
a
per
|
Discussion
P
a
per
|
Figure 4.Same as Fig. 3, but for the vertical velocity (in cm s−1).
GMDD
8, 5643–5670, 2015Meridional circulation sensitivity to OGW
and QBO
A. V. Koval et al.
Title Page
Abstract Introduction
Conclusions References
Tables Figures
◭ ◮
◭ ◮
Back Close
Full Screen / Esc
Printer-friendly Version Interactive Discussion
Discussion
P
a
per
|
Discussion
P
a
per
|
Discussion
P
a
per
|
Discussion
P
a
per
|
Figure 5.The simulated zonal-mean vertical ozone fluxes (in 1013m−2s−1) for easterly QBO phase without OGW effects(a)and the ozone flux differences (in 1013m−2s−1) due to inclusion
GMDD
8, 5643–5670, 2015Meridional circulation sensitivity to OGW
and QBO
A. V. Koval et al.
Title Page
Abstract Introduction
Conclusions References
Tables Figures
◭ ◮
◭ ◮
Back Close
Full Screen / Esc
Printer-friendly Version Interactive Discussion
Discussion
P
a
per
|
Discussion
P
a
per
|
Discussion
P
a
per
|
Discussion
P
a
per
|
Figure 6.January mean vertical ozone fluxes averaged over latitude belts 0–30◦N – 1, 30– 60◦N – 2, 60–90◦N – 3 for the easterly QBO phase without OGW effects (solid lines), for easterly QBO including OGW effects (a, dashed lines) and for the westerly QBO phase without OGW effects (b, dashed lines).
GMDD
8, 5643–5670, 2015Meridional circulation sensitivity to OGW
and QBO
A. V. Koval et al.
Title Page
Abstract Introduction
Conclusions References
Tables Figures
◭ ◮
◭ ◮
Back Close
Full Screen / Esc
Printer-friendly Version Interactive Discussion
Discussion
P
a
per
|
Discussion
P
a
per
|
Discussion
P
a
per
|
Discussion
P
a
per
|
Figure 7.Simulated mean vertical ozone fluxes (in 1013m−2s−1) in January for easterly QBO phase without OGW effects(a)and the ozone flux differences (in 1013m−2s−1) due to inclusion