Modelling the Distribution of
Forest-Dependent Species in Human-Dominated
Landscapes: Patterns for the Pine Marten in
Intensively Cultivated Lowlands
Alessandro Balestrieri
1*
, Giuseppe Bogliani
2, Giovanni Boano
3, Aritz Ruiz-González
4,5,
Nicola Saino
1, Stefano Costa
6, Pietro Milanesi
21Department of Biosciences, University of Milan, Milan, Italy,2Department of Earth and Environmental Sciences, University of Pavia, Pavia, Italy,3Natural History Museum of Carmagnola, Carmagnola (TO), Italy,4Department of Zoology and Animal Cell Biology, University of the Basque Country (UPV/EHU), Vitoria-Gasteiz, Spain,5Systematics, Biogeography and Population Dynamics Research Group, Lascaray Research Center, University of the Basque Country, UPV/EHU, Vitoria-Gasteiz, Spain,6Independent Researcher, via Quintino Sella 16, Cossato (BI), Italy
Abstract
In recent years, the
“
forest-specialist
”
pine marten
Martes martes
has been reported to also
occur also in largely fragmented, lowland landscapes of north-western Italy. The
coloniza-tion of such an apparently unsuitable area provided the opportunity for investigating pine
marten ecological requirements and predicting its potential south- and eastwards
expan-sion. We collected available pine marten occurrence data in the flood plain of the River Po
(N Italy) and relate them to 11 environmental variables by developing nine Species
Distribu-tion Models. To account for inter-model variability we used average ensemble predicDistribu-tions
(EP). EP predicted a total of 482 suitable patches (8.31% of the total study area) for the pine
marten. The main factors driving pine marten occurrence in the western River Po plain were
the distance from watercourses and the distance from woods. EP suggested that the pine
marten may further expand in the western lowland, whilst the negligible residual wood cover
of large areas in the central and eastern plain makes the habitat unsuitable for the pine
mar-ten, except for some riparian corridors and the pine wood patches bordering the Adriatic
coast. Based on our results, conservation strategies should seek to preserve remnant forest
patches and enhance the functional connectivity provided by riparian corridors.
Introduction
As already noted by MacArthur in the early 1970s, distribution ranges are dynamic and their
boundaries can fluctuate greatly as a consequence of both dispersal and temporal variation in
environmental conditions [1]. Range fluctuations generally occur over historical time periods,
but they have recently been recorded to occur over short time scales due to introductions and
environmental change [2,
3].
a11111
OPEN ACCESS
Citation:Balestrieri A, Bogliani G, Boano G, Ruiz-González A, Saino N, Costa S, et al. (2016) Modelling the Distribution of Forest-Dependent Species in Human-Dominated Landscapes: Patterns for the Pine Marten in Intensively Cultivated Lowlands. PLoS ONE 11(7): e0158203. doi:10.1371/ journal.pone.0158203
Editor:Danilo Russo, Università degli Studi di Napoli Federico II, ITALY
Received:February 15, 2016
Accepted:June 13, 2016
Published:July 1, 2016
Copyright:© 2016 Balestrieri et al. This is an open access article distributed under the terms of the
Creative Commons Attribution License, which permits unrestricted use, distribution, and reproduction in any medium, provided the original author and source are credited.
Data Availability Statement:All relevant data are within the paper and its Supporting Information files.
Climate warming and human-driven habitat modifications are considered the main
deter-minant of range variation, but non-climatic factors, including ecological interspecific
interac-tions [4,
5] and evolutionary dynamics [6,
7,
8] can also drive the magnitude, direction and
pattern of range shifts. While recent studies on species
’
distributions have mostly focused on
the effects of anthropogenic climate change, demonstrating trends at an Earth-scale,
informa-tion on environmental determinants of range variainforma-tion at the fine scale of a species
’
range is
still scarce [9].
Biological invasions, resulting in large-scale, unintentional field manipulations, offer the
opportunity to test the effects of environmental factors on the range limits of alien species [10,
11,
12]: the rate of range expansion has been shown to depend on both the life history of
invad-ing species and the properties of the landscape invaded [13]. Less attention has been devoted to
range fluctuations in autochthonous species, although the (re-) colonization of previously
unoccupied areas may provide an invaluable opportunity for investigating the environmental
factors that shape species
’
ranges [14].
In recent years, the
“
forest-specialist
”
pine marten
Martes martes
has been reported to also
occur in largely fragmented landscapes of the western part of its European range [15]. In
north-western Italy, a recent genetic survey has showed that the pine marten is spreading in
intensively cultivated areas north of the River Po, where woods mainly consist of small residual
patches or cover the banks of main rivers [16]. While agro-forest systems have been reported
to sustain high food availability levels for carnivores [17], in agricultural landscapes dominated
by arable land the loss and fragmentation of natural vegetation have been related to a general
decline in prey biomass [18], and the trend of land-use change in the Po plain indicates that
soil depletion due to urbanisation is still increasing [19].
Pine marten occurrence in such an apparently unsuitable area is likely the result of recent
expansion from the Alps [20], where pine marten populations may have benefited by the
increase in forest cover over the last decades [16]. Accordingly, and notwithstanding long-term
monitoring, no evidence of pine marten occurrence is available for the lowlands of NE Italy
[21] and the central Po plain (1980
–
2000) [22], while a few, recent records have been reported
for the lower course of the River Oglio (Lombardy region) [23].
The colonization of the western Po plain by the pine marten has occurred exponentially [24,
25], as is typical for species that disperse over large distances relative to home range size [26].
Besides dispersal abilities, the rate and direction of species
’
expansion are influenced by a
wide range of factors, including landscape connectivity, the distribution and abundance of
suit-able habitats and variation in climate and resource availability [27,
28,
29].
Species Distribution Models (SDMs) [30] prove very useful for understanding how
land-scape influences the spread of colonizing species and predict habitat suitability in neighbouring
geographical areas which may be occupied in the near future (
i
.
e
. the potential geographic
dis-tribution) [31,
4].
In the last two decades, the development of several modelling techniques has promoted the
use of SDMs in several branches of life sciences [32]. As different techniques can yield partially
discordant results [33,
34], model evaluation is needed to assess the accuracy of predictions
across modelling techniques and either select the model which
“
best
”
fits the data or derive
ensemble predictions to avoid single model uncertainty [35].
Our aims were (i) to identify the main environmental predictors related to pine marten
presence in the western River Po plain and then (ii) predict the potential for its south- and
east-wards expansion.
To reach these aims, we collected available occurrence data of the pine marten in the study
area and related them to a set of environmental variables by developing nine different SDMs.
To account for inter-model variability, we used average ensemble predictions. Ensemble
S-PE11UN028). A. Ruiz-González (Ref.DKR-2012-64) was supported by a Ph.D. and Post-doctoral fellowships awarded by the Dept. of Education, Universities and Research of the Basque Government.
forecasting is particularly useful in modelling expanding species, which may not yet have
spread to all suitable habitats, making species-environment relationships difficult to assess
[36].
We hypothesised that the probability of pine marten occurrence would depend on both the
distribution of wood patches, as the main limiting factor, and distance from major rivers,
which may play a role as natural corridors for expansion [37].
Methods
Study area
The Po-Venetian alluvial plain (
<
300 m above sea level) is the largest in Italy (
ca
. 46,000 km
2).
The pedogenetic and micro-morphological characteristics of the soils of the lower plain,
crossed by the River Po (652 km), support high levels of agricultural productivity and are
inten-sively managed for cattle husbandry and modern-industry-based agriculture. Since the second
half of the 19
thcentury, widespread urbanisation and industrialisation have led to a progressive
depletion of soil resources; built-up areas have progressively increased since the second half of
the 20
thcentury, indicating the parallel increase of human presence [38], and currently cover
ca. 9% of the area [19]. About 70% of residual forests (
ca
. 2,400 km
2) are in the western and
central plain [39], and either consist of small fragments (mean patch size = 4.5 ha) [40]
scat-tered within the agricultural matrix or, as in most European lowlands [41], cover the banks of
major rivers. Climate is sub-continental temperate, with a mean yearly temperature of 12.0°C
and mean yearly rainfall of 1000 mm.
Data collection
We collected a total of 184 occurrences for the pine marten recorded between 2000 and 2015 in
the Po plain (Fig 1), i.e. available data for north-western Italy were considered below the 300 m
a.s.l. contour line, which broadly marks the upper limit of the plain [24]. Two main sources of
data were used to assess pine marten distribution: 1) 116 faecal DNA-based records collected
between 2007 and 2015 across the whole study area [16,
37], and 2) unequivocal records from
road-killed (N = 55) and camera-trapped individuals (N = 13) [42,
25]. All species locations
were georeferenced in the UTM WGS84 32N coordinate system using ARCGIS 10.1 (ESRI,
Redlands, California,
www.esri.com/software/arcgis;
S1 Table).
Through Gaussian kernel density estimation based on all sampling locations we accounted
for spatially biased sampling effort [43,
44,
45]. Specifically, we used the resulting kernel density
probability as a sampling effort map to weight bias-adjusted model estimates [45,
46]. Thus,
10,000 random points within the resulting 95% kernel density surface were generated to serve
as background data.
Moreover, according to Calenge et al [47], we estimated the minimum convex polygon
(MCP) around all species
’
locations to define the area available for the pine marten and to
avoid any potential source of bias in the analysis [48].
Predictor Variables
Fig 1. Map of the study area (i.e. the Po-Venetian alluvial plain,<300 m above sea level) corresponding to the potential expansion range of the pine marten in northern Italy.Pine marten locations are denoted by black triangles (N = 103). Black lines indicate regional borders. The distribution range of the pine marten in Italy is shown in the upper-right corner. Base Map used: World Terrain Base; data sources: Esri, USGS, NOAA; Reprinted from PLOS ONE under a CC BY license, with permission from ESRI, original copyright June 2009.
doi:10.1371/journal.pone.0158203.g001
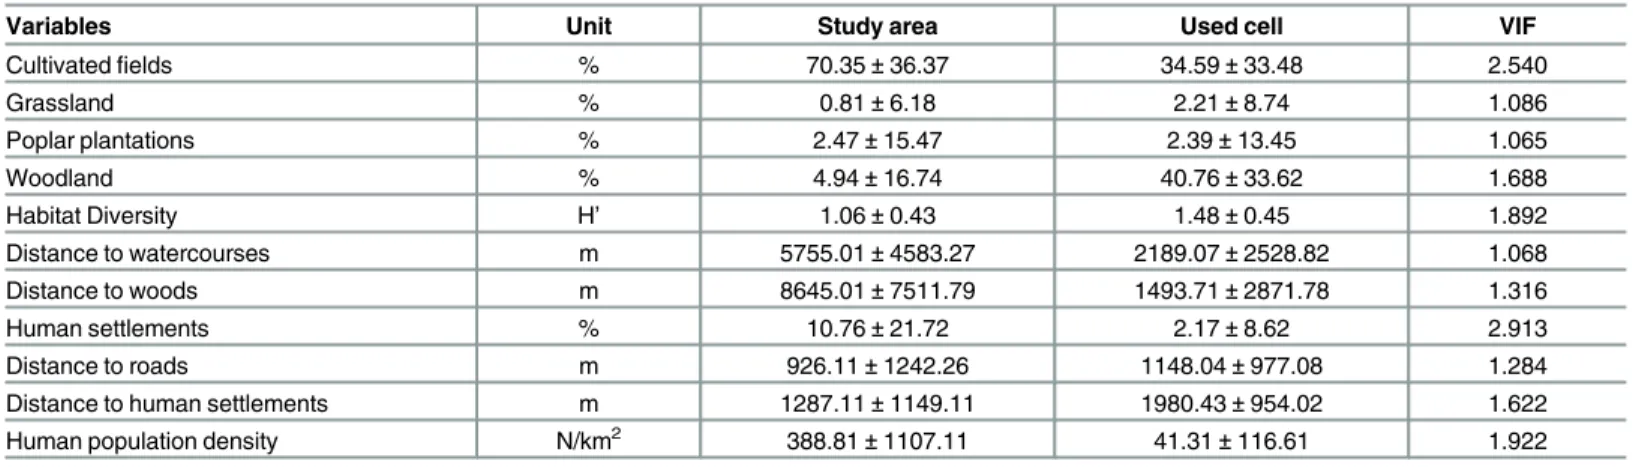
Table 1. Variables used in the development of species distribution models for the pine marten in the whole study area and in the used cells; average±standard deviations values and variance inflation factor (VIF) values are shown [H’=−Σ(pi× lnpi)].
Variables Unit Study area Used cell VIF
Cultivatedfields % 70.35±36.37 34.59±33.48 2.540
Grassland % 0.81±6.18 2.21±8.74 1.086
Poplar plantations % 2.47±15.47 2.39±13.45 1.065
Woodland % 4.94±16.74 40.76±33.62 1.688
Habitat Diversity H’ 1.06±0.43 1.48±0.45 1.892
Distance to watercourses m 5755.01±4583.27 2189.07±2528.82 1.068
Distance to woods m 8645.01±7511.79 1493.71±2871.78 1.316
Human settlements % 10.76±21.72 2.17±8.62 2.913
Distance to roads m 926.11±1242.26 1148.04±977.08 1.284
Distance to human settlements m 1287.11±1149.11 1980.43±954.02 1.622
Human population density N/km2 388.81±1107.11 41.31±116.61 1.922
plantations were distinguished from the woodland category, because they often lack the shrub
layer and offer lower prey diversity [49]. We considered these landscape features because of
their proven relevance for the distribution of our target species [15,
37] and because they are
the most representative in our study area (ca. 98% of the total area). Habitat diversity was
expressed by Shannon
’
s Index. The presence and distance from human settlements (i.e. urban
areas, villages; CORINE Land Cover 2006), from roads and railways (derived from
OpenStreet-Map;
www.openstreetmap.org) and human population density (GEOSTAT 2011 dataset
—
Eurostat
—
European Commission; ec.europa.eu/eurostat/web/gisco/ geodata/reference-data/
population-distribution-demography) were considered as a proxy for human disturbance.
All the predictor variables were re-sampled to a common resolution of 1 x 1 km cell size and
the variance inflation factor (VIF) for all predictor variables was estimated in order to avoid
multi-collinearity among them [50]; VIF values
>
3 denoted highly correlated predictors
(Table 1).
Modelling methods
We tested for spatial autocorrelation among all pine marten locations collected with Moran
’
s
I
correlogram [51] and then, with the resulting non-autocorrelated locations we developed nine
SDMs: (1) artificial neural networks (ANN) [52], a non-linear regression model based on
hid-den variables (estimated by the predictors), (2) boosted regression trees (BRT) [53], a
regres-sion model that combines boost methods and regresregres-sion trees, (3) classification tree analyses
(CTA) [54], a recursive partitioning analysis which develops decision trees by applying
split-ting rules and partitioning data to reduce variation in the response variable, (4) flexible
dis-criminant analyses (FDA) [55], a mixture model-based disdis-criminant analysis, (5) generalized
additive models (GAM) [56], a regression model involving smoothing parameters derived by
predictor variables to estimate parametric components of linear predictors, (6) generalised
lin-ear models (GLM) [57], logistic regression models that relate presence locations and
pseudo-absences to the predictors, (7) maximum entropy (MAXENT) [31], a model which calculates a
range of functions to identify the best approximation between the density distributions of
pre-dictors at species
’
occurrences and those in the rest of the study area, (8) multivariate adaptive
regression splines (MARS) [58], a non-linear regression which carries out non-linear
interac-tions between variables, (9) random forest (RF) [59], an ensemble classifier involving many
decision trees which constitute
“
the forest
”
. We used the values of the sampling effort map as a
bias grid in MAXENT and as case weights in all the other methods [43,
45,
46]. To avoid single
model uncertainty, we calculated the ensemble prediction (EP) derived by the average
predic-tions of the nine SDMs. We converted the EP continuous map into a binary one (suitable/
unsuitable) considering a threshold value estimated by maximizing the True Skill Statistics
(TSS) [60,
61]; values higher and lower than the threshold represent suitable and unsuitable
areas, respectively. To estimate variable importance, we used 10,000 permutations (values close
to 0 assume no influence of that variable on the model) [32]. We computed these analyses with
the package BIOMOD2 [61] in the open-source software R (v. 3.1.2;
http://www.R-project.org/
). Lastly, spatial autocorrelation among the residuals of the models was verified by Moran
’
s
I
correlogram (1
–
predicted SDMs values for each location) [62].
Model validations and comparisons
indicate predictions consistent with the evaluation data set, 0 indicates that the model is similar
to a random model). To classify the accuracy of validations, we followed Swets [65]: 0.90
–
1.00 = excellent; 0.80
–
0.90 = good; 0.70
–
0.80 = fair; 0.60
–
0.70 = poor; 0.50
–
0.60 = fail. We
car-ried out ten
k-fold cross-validations
alternatively using a random sub-sample of 50% of
loca-tions to calibrate the models and the remaining 50% to validate them [66].
Cross-validations
were carried out in R (v. 3.1.2;
http://www.R-project.org/) through the packages BIOMOD2
[61] and ECOSPAT [67]. Moreover, to assess whether the nine models used provided
consis-tent predictions in terms of variable ranking, we performed a simple linear correlation
(Spear-man
’
s test), using pair-wise comparisons for all models [68].
Results
We removed 81 autocorrelated locations (within a distance of 1900 m) and thus we developed
SDMs with a total of 103 pine marten locations. We did not find multicollinearity among the
11 predictor variables (Table 1) and thus we used all predictors for further analyses. Moreover,
autocorrelation among the residuals of the nine SDMs, as well as those of the EP, were not
sig-nificant and thus we considered all of them as accurate.
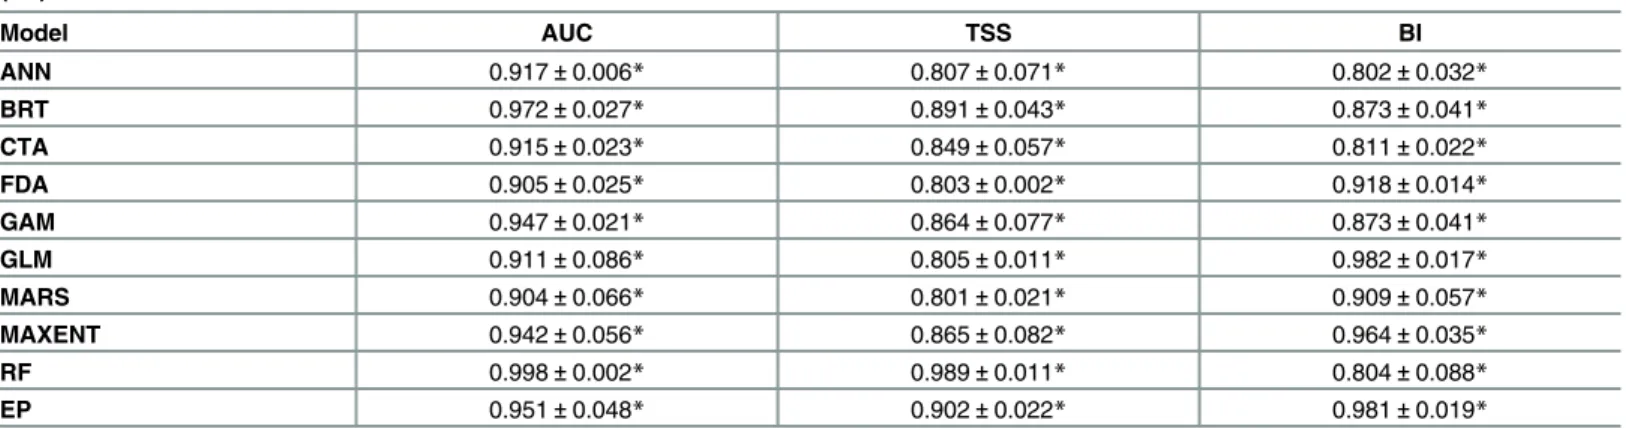
K-fold cross-validations showed significant values for all the evaluation methods of all
dis-tribution models (Table 2), with values ranging between 0.904 and 0.998 for AUC, 0.801 and
0.989 for TSS and from 0.802 to 0.981 for BI (Table 2). Specifically, considering both AUC and
TSS statistics, RF showed the highest predictive power while MARS the lowest; considering BI,
EP showed the highest predictive accuracy, while ANN the lowest (Table 2).
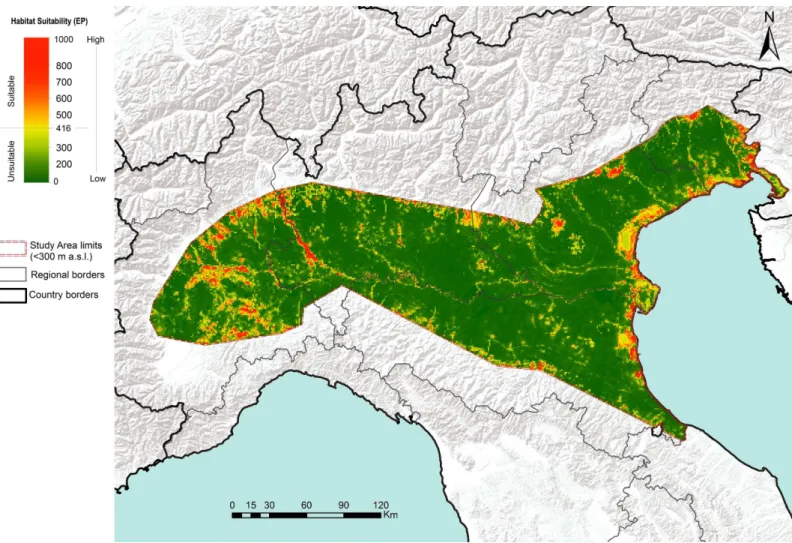
Based on the resulting threshold value (416), EP predicted a total of 482 suitable patches for
the pine marten, occupying a total of 4366 km
2(8.31% of the total study area;
Fig 2), with the
most important variables related to the species
’
occurrence being the distance from
water-courses (38.1% contribution), distance from woods (37.8% contribution) and, to a lesser extent,
habitat diversity (11.2% contribution) and distance from roads (10.7% contribution;
Table 3).
Actually, the probability of pine marten occurrence decreased as the distance from both
water bodies and woods rose, while it increased with habitat diversity (Fig 3). Distance to roads
showed an unimodal relationship peaking approximately at 2500 m (Fig 3). ANN was the only
model which did not rank either distance from water bodies or distance from woods as the
Table 2. Model evaluation of the nine species distribution methods (see themethodssection for abbreviations) and their ensemble prediction (EP).
Model AUC TSS BI
ANN 0.917±0.006* 0.807±0.071* 0.802±0.032*
BRT 0.972±0.027* 0.891±0.043* 0.873±0.041*
CTA 0.915±0.023* 0.849±0.057* 0.811±0.022*
FDA 0.905±0.025* 0.803±0.002* 0.918±0.014*
GAM 0.947±0.021* 0.864±0.077* 0.873±0.041*
GLM 0.911±0.086* 0.805±0.011* 0.982±0.017*
MARS 0.904±0.066* 0.801±0.021* 0.909±0.057*
MAXENT 0.942±0.056* 0.865±0.082* 0.964±0.035*
RF 0.998±0.002* 0.989±0.011* 0.804±0.088*
EP 0.951±0.048* 0.902±0.022* 0.981±0.019*
Area Under the Curve (AUC) ranges between 0 and 1 (worse than a random model and best discriminating model, respectively). True Skill Statistic (TSS) and Boyce’s Index (BI) ranges between−1 and 1 (higher values indicate a good predictive accuracy, while 0 indicates random prediction). Average
values±standard deviations are shown (*: P<0.001).
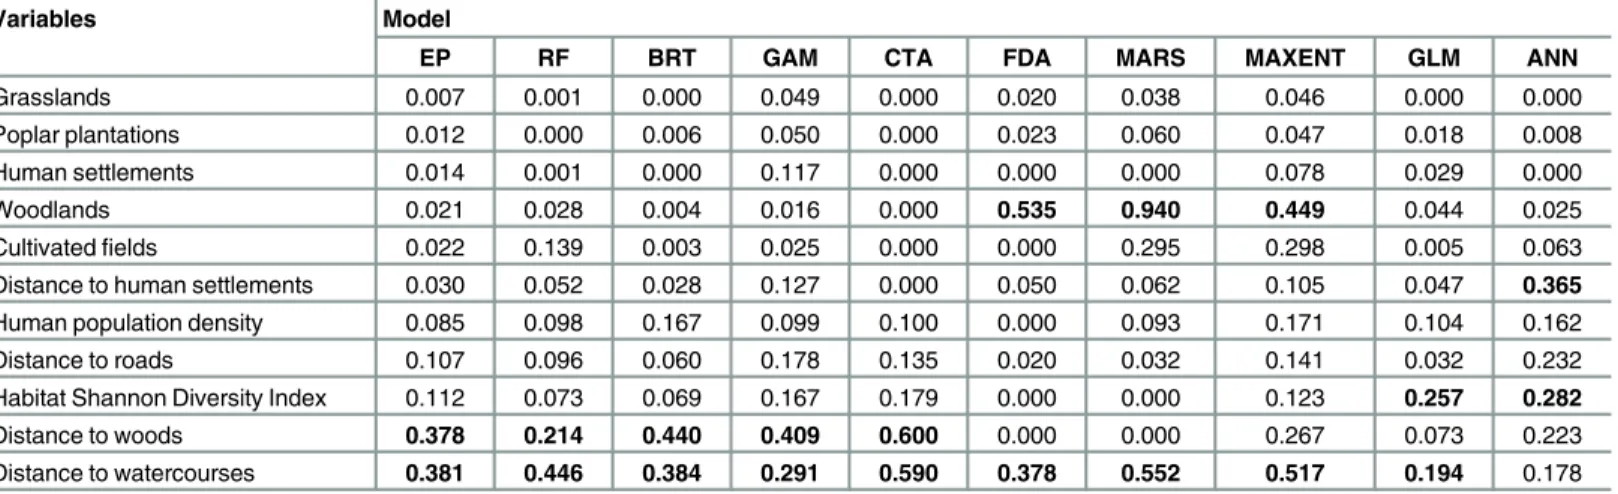
most important variables (Table 3). All models
’
ranks were significantly correlated with the
consensus rank (P = 0.035
–
0.0008), except for those provided by MARS (
ρ
=
−
0.11, P = 0.75)
and FDA (
ρ
=
−
0.06, P = 0.87).
Discussion
Our approach led us to identify the main environmental and anthropogenic factors affecting
pine marten distribution in the western River Po plain, and outline the ecological requirements
of pine martens in cultivated lowlands.
The main role played by the distance from bodies of water clearly reflects the importance of
riparian corridors for marten expansion in a landscape largely dominated by crops and urban
areas. Riparian zones have been reported to assist the range expansion of several mammals and
support a more diverse fauna than the surrounding landscape matrix [69].
Moreover, understory vegetation in riparian forests has been associated with both
prey-[70] and resting site availability [71] for American martens (
Martes americana
). Accordingly,
in a previous study at a finer scale, Balestrieri et al [37], demonstrated by faecal DNA analysis
that pine martens are currently widespread throughout the valley of the River Ticino, a
left-hand major tributary of the River Po, where they have displaced the stone marten.
Fig 2. Habitat suitability map of the pine marten obtained by ensemble Species Distribution Models (green-red scale indicates lower-higher species occurrence probability).
Woods are key habitat features for the pine marten, which, accordingly, has been long
con-sidered a forest-specialist [72,
73]. The pine marten is associated with mountainous forests and
medium-extent agroforestry mosaics, while open and urban areas are generally avoided [74,
75].
Also in agricultural and rural areas, the abundance of pine martens has been shown to
depend on the structure and degree of fragmentation of residual woods [24,
74], where resting
sites are almost exclusively established [76]. Moreover in fragmented woods, martens often
move along wood margins, hedgerows and corridors and tend to remain close to canopy cover
[77,
78]. Therefore, open areas and highways have been reported to be the major obstacle to
gene flow in lowlands [79].
Table 3. Variable importance (%) ranking by the nine distribution methods (see themethodssection for abbreviations) with respect to the ensem-ble prediction (EP).
Variables Model
EP RF BRT GAM CTA FDA MARS MAXENT GLM ANN
Grasslands 0.007 0.001 0.000 0.049 0.000 0.020 0.038 0.046 0.000 0.000
Poplar plantations 0.012 0.000 0.006 0.050 0.000 0.023 0.060 0.047 0.018 0.008
Human settlements 0.014 0.001 0.000 0.117 0.000 0.000 0.000 0.078 0.029 0.000
Woodlands 0.021 0.028 0.004 0.016 0.000 0.535 0.940 0.449 0.044 0.025
Cultivatedfields 0.022 0.139 0.003 0.025 0.000 0.000 0.295 0.298 0.005 0.063
Distance to human settlements 0.030 0.052 0.028 0.127 0.000 0.050 0.062 0.105 0.047 0.365
Human population density 0.085 0.098 0.167 0.099 0.100 0.000 0.093 0.171 0.104 0.162
Distance to roads 0.107 0.096 0.060 0.178 0.135 0.020 0.032 0.141 0.032 0.232
Habitat Shannon Diversity Index 0.112 0.073 0.069 0.167 0.179 0.000 0.000 0.123 0.257 0.282
Distance to woods 0.378 0.214 0.440 0.409 0.600 0.000 0.000 0.267 0.073 0.223
Distance to watercourses 0.381 0.446 0.384 0.291 0.590 0.378 0.552 0.517 0.194 0.178
doi:10.1371/journal.pone.0158203.t003
In temperate regions, heterogeneous landscapes promote high biodiversity [17], and offer
larger small mammal availability to predators than continuous forests [80,
81]. Wood patch
borders associate cover with high prey density; therefore, below a threshold level, forest
frag-mentation can enhance food availability to martens and also the predator
’
s density [82]. For
example, introduced Eastern cottontails (
Sylvilagus floridanus
) often select wood
–
field margins
as resting sites [83], and have been reported to be a major food resource for pine martens in the
study area [84].
The pattern of variation in the probability of pine marten occurrence with the distance from
roads is consistent with previous results about wolves [85], and may derive from individual
dif-ferences in marten response to roads [86]. In turn, this response may depend on both
familiar-ity of the landscape, traffic intensfamiliar-ity and road passage availabilfamiliar-ity.
Although model accuracy should always be tested with independent data [87], since pine
marten expansion is a recent phenomenon occurring only in the western of the River Po plain
[24], a statistically independent data set for validation of our ensemble prediction was not
available. We are confident that our cross-validation procedure allowed a final evaluation
quasi-independent of a particular realisation of random split [32,
88]. Moreover, as
cross-vali-dation implies that variability in model accuracy is interpreted as a measure of the sensitivity of
model results to the initial conditions rather than a measure of predictive accuracy [89], model
averaging may improve the accuracy of projected potential distributions [90].
Although our aim was not to compare the performances of individual models, based on
var-iable ranking and statistical evaluation ANN, FDA and MARS produced forecasts very
dissimi-lar from the ensemble prediction, while RF performed the best. In multi-model comparisons,
ANN often modelled species
–
environment relationships less accurately than other methods
[91,
92], while RF gave the best results [34,
92]. Variation in modelling success between
tech-niques is a common output, which further emphasizes the benefits of combining several
meth-ods [36,
93,
94].
Although, similarly to previous recent SDMs [95,
96], our model was implemented at a local
(i.e. regional) scale, we argue that the environmental variable constraining pine marten
pres-ence in agricultural habitats of NW Italy can be useful to project its distribution throughout the
River Po plain. Our ensemble projection suggests that the potential for pine marten expansion
is high only for the western part of the River Po plain. In this area, south of the River Po the
stone marten is currently the only or dominant marten species, suggesting that, flowing from
west to east, the watercourse may act as a barrier to pine marten southward expansion from
the Alps [16]. However, the relatively large availability of areas suitable for the pine marten
allows predictions that it may colonize the whole western Po plain in the near future. In such a
case, interspecific competition may result in stone marten decline, as has happened for the
left-side river plain. In contrast, the negligible residual wood cover in large areas of the central and
eastern plain makes them unsuitable marten habitats, although riparian corridors may allow
pine marten descent from the Alps and Apennines. The potential for pine marten colonization
in the pine wood patches (
Pinus pinaster
and
P
.
pinea
) of the Adriatic coast is supported by the
recent southward expansion of the red squirrel (
Sciurus vulgaris
), which has probably followed
the major Alpine rivers [97], and penetration of the Venetian plain by the golden jackal (
Canis
aureus moreoticus
), along the valley of the River Piave [98].
depends on the preservation of existing forest patches and suggest that conservation
manage-ment should seek to enhance the functional connectivity provided by riparian corridors.
Supporting Information
S1 Table. Coordinates of pine marten records in the western valley of the River Po (Italy).
(DOCX)
S1 Text. Permission from ESRI to publish
Fig 1
under the specific Creative Commons
Attribution License (CCAL), CC BY 4.0.
(PDF)
S2 Text. Permission from the European Environment Agency (EEA) to publish
Fig 1
under
the specific Creative Commons Attribution License (CCAL), CC BY 4.0.
(PDF)
Acknowledgments
The authors are grateful to Paolo Debernardi, Laura Gola, Mattia Menchetti, Emiliano Mori,
Roberto Sindaco, Luigi Beraudo, Paolo Lo Conte, Roberto Toffoli, Massimo Pettavino, Aldo
Pietrobon and Marco Saggioro for sharing their data about pine marten distribution in NW
Italy. J. MacPherson, E. Mori and an anonymous referee helped to improve the first draft of the
manuscript with their comments and suggestions. Kelsey Horvath kindly revised the English
language.
Author Contributions
Conceived and designed the experiments: AB PM G. Bogliani. Performed the experiments: AB
PM. Analyzed the data: AB PM. Contributed reagents/materials/analysis tools: G. Boano SC
NS ARG. Wrote the paper: AB PM. Provided editorial advice and suggestions to improve the
manuscript: G. Bogliani NS.
References
1. MacArthur RH. Geographical Ecology. New York: Harper & Row; 1972.
2. Kinlan B, Hastings A. What exotic species tell us about rates of population spread and geographic range expansion. In: Sax DF, Stachowicz JJ, Gaines SD, editors. Species invasions: insights into ecology, evolution, and biogeography. Sunderland, MA: Sinauer Associates. 2005. pp. 281–419. 3. Chen I-C, Hill JK, Ohlemüller R, Roy DB, Thomas CD. Rapid Range Shifts of Species Associated with
High Levels of Climate Warming. Science. 2011; 333: 1024–1026. doi:10.1126/science.1206432
PMID:21852500
4. Warren DL, Seifert SN. Ecological niche modeling in Maxent: the importance of model complexity and the performance of model selection criteria. Ecol Appl. 2011; 21: 335–342. PMID:21563566
5. Forero-Medina G, Joppa L, Pimm SL. Constraints to Species’Elevational Range Shifts as Climate Changes. Conserv Biol. 2011; 25: 163–171. doi:10.1111/j.1523-1739.2010.01572.xPMID:
21198846
6. Holt RD. Adaptive evolution in source–sink environments: direct and indirect effects of density-depen-dence on niche evolution. Oikos. 1996; 75: 182–192.
7. Kirkpatrick M, Barton NH. Evolution of a species’range. Am Nat. 1997; 150: 1–23. PMID:18811273
8. Thomas CD, Bodsworth EJ, Wilson RJ, Simmons AD, Davies ZG, Musche M, et al. Ecological and evolutionary processes at expanding range margins. Nature. 2001; 411: 577–581. PMID:11385570
10. Moyle PB, Light T. Fish invasions in California: do abiotic factors determine success? Ecology. 1996; 77: 1666–1670.
11. De Rivera CE, Steves BP, Fofonoff PW, Hines AH, Ruiz GM. Potential for high-latitude marine inva-sions along western North America. Divers Distrib. 2011; 17: 1198–1209.
12. Crickenberger S. Predicting a range shift and range limits in an introduced tropical marine invertebrate using species distribution models. Hydrobiologia. 2015; doi:10.1007/s10750-015-2376-0
13. White TA, Lundy MG, Montgomery WI, Montgomery S, Perkins SE, Lawton C, et al. Range expansion in an invasive small mammal: influence of life-history and habitat quality. Biol. Invasions. 2012; doi:
10.1007/s10530-012-0225-x
14. Carone MT, Guisan A, Cianfrani C, Simoniello T, Loy A, Carranza ML. A multi-temporal approach to model endangered species distribution in Europe. The case of the Eurasian otter in Italy. Ecol Model. 2014; 274: 21–28.
15. Virgós E, Zalewski A, Rosalino LM, Mergey M. Habitat ecology of genusMartesin Europe: a review of the evidences. In: Aubry KB, Zielinski WJ, Raphael MG, Proulx G, Buskirk SW, editors. Biology and conservation of marten, sables, and fisher: a new synthesis. New York: Cornell University Press; 2012. pp. 255–266.
16. Balestrieri A, Ruiz-González A, Capelli E, Vergara M, Prigioni C, Saino N. Pine martenvs. stone mar-ten in agricultural lowlands: a landscape-scale, genetic survey. Submitted to Mammal Research. 17. Verdade LM, Rosalino LM, Gheler-Costa C, Pedroso NM, Lyra-Jorge MC. Adaptation of
mesocarni-vores (Mammalia: Carnivora) to agricultural landscapes in Mediterranean Europe and Southeastern Brazil: a trophic perspective. In: Rosalino LM, Gheler-Costa C, editors. Middle-Sized Carnivores in Agricultural Landscapes. Nova Science Publishers, Inc; 2011. pp. 1–38.
18. Remonti L, Balestrieri A, Prigioni C. Percentage of protein, lipids, and carbohydrates in the diet of bad-ger (Meles meles) populations across Europe. Ecol Res. 2011; 26: 487–495.
19. Gherardi M, Lorito S, Vianello G, Vittori Antisari L. Qualitative and quantitative evaluation of soil deple-tion due to urbanisadeple-tion in the areas near the Po River. EQA–Environmental quality. 2009; 2: 29–38. 20. Balestrieri A, Ruiz-González A, Vergara M, Capelli E, Tirozzi P, Alfino S, et al. Pine marten density in lowland riparian woods: a test of theRandom Encounter Modelbased on genetic data. Mamm Biol. 2016; doi:10.1016/j.mambio.2016.05.005
21. Bon M, Paolucci P, Mezzavilla F, Battisti R, Vernier E. Atlante dei Mammiferi del Veneto. Lav. Soc Ven Sci Nat. 1995; 21 (Suppl).
22. Prigioni C, Cantini M, Zilio A. Atlante dei Mammiferi della Lombardia. Milano: Regione Lombardia e Universitàdegli Studi di Pavia; 2001.
23. Mantovani S. Recenti segnalazioni della martora,Martes martes, in provincia di Cremona. Pianura 2010; 25: 95–107.
24. Balestrieri A, Remonti L, Ruiz-González A, Gómez-Moliner BJ, Vergara M, Prigioni C. Range expan-sion of the pine marten (Martes martes) in an agricultural landscape matrix (NW Italy). Mamm Biol. 2010; 75: 412–419.
25. Sindaco R, Carpegna F. Segnalazioni Faunistiche Piemontesi. III. Dati preliminari sulla distribuzione dei Mustelidi del Piemonte (Mammalia, Carnivora, Mustelidae). Rivista piemontese di Storia naturale 2010; 31: 397–422.
26. Shigesada N, Kawasaki K, Takeda Y. Modeling stratified diffusion in biological invasions. Am Nat. 1995; 146: 229–251.
27. Darimont CT, Paquet PC, Reimchen TE, Crichton V. Range expansion by moose into coastal temper-ate rainforests of British Columbia, Canada. Divers Distrib. 2005: 11: 235–239.
28. Veech JA, Small MF, Baccus JT. The effect of habitat on the range expansion of a native and an intro-duced bird species. J Biogeogr. 2011; 38: 69–77.
29. Morgia V, Malenotti E, Badino G, Bona F. Where do we go from here? Dispersal simulations shed light on the role of landscape structure in determining animal redistribution after reintroduction. Land-scape Ecol 2011; 26: 969–981.
30. Guisan A Thuiller W. Predicting species distribution: offering more than simple habitat models. Ecol Lett. 2005; 8: 993–1009.
31. Phillips SJ, Anderson RP, Schapire RE. Maximum entropy modeling of species geographic distribu-tions. Ecol Model. 2006; 190: 231–259.
32. Thuiller W, Lafourcade B, Engler R, Araújo MB. BIOMOD: a platform for ensemble forecasting of spe-cies distributions. Ecography. 2009; 32: 369–373.
34. Olaya-Marín EJ, Martínez-Capel F, Vezza P. A comparison of artificial neural networks and random forests to predict native fish species richness in Mediterranean rivers. Knowl Manag Aquat Ec. 2013; 409, 07.
35. Araújo MB, New M. Ensemble forecasting of species distributions. Trends Ecol Evol. 2007; 22: 42– 47. PMID:17011070
36. Stohlgren TJ, Ma P, Kumar S, Rocca M, Morisette JT, Jarnevich CS, et al. Ensemble Habitat Mapping of Invasive Plant Species.Risk Analysis. 2010; 30: 224–235. doi:10.1111/j.1539-6924.2009.01343.x
PMID:20136746
37. Balestrieri A, Remonti L, Ruiz-González A, Zenato M, Gazzola A, Vergara M, et al. Distribution and habitat use by pine martenMartes martesin a riparian corridor crossing intensively cultivated low-lands. Ecol Res. 2015; 30: 153–162.
38. Falcucci A, Maiorano L, Boitani L. Changes in land-use/land-cover patterns in Italy and their implica-tions for biodiversity conservation. Landscape Ecol. 2007; 22: 617–631.
39. Camerano P, Grieco C, Terzuolo PG. I boschi planiziali: conoscenza, conservazione e valorizzazione. Torino: Regione Piemonte e Blu edizioni; 2010.
40. Lassini P, Monzani F, Pileri P. A green vision for the renewal of the Lombardy landscape. In: Pedroli B, Van Doorn A, De Blust G, Paracchini ML, Wascher D, Bunce F, editors. Europe’s living landscapes. Essays on exploring our identity in the countryside. Landscape Europe / KNNV; 2007. pp. 83–100. 41. Coles TF, Southey JM, Forbes I, Clough T. River wildlife data bases and their value for sensitive
envi-ronmental management. Regul Rivers. 1989; 4: 179–89.
42. Savoldelli P, Sindaco R. Grandi e piccoli predatori. Collana‘‘La nostra fauna”. Torino: Osservatorio Faunistico per la Fauna Selvatica, Regione Piemonte; 2008.
43. Elith J, Graham CH, Anderson RP, Dudik M, Ferrier S, Guisan A, et al. Novel methods improve predic-tion of species’distributions from occurrence data. Ecography. 2006; 29: 129–151.
44. Fourcade Y, Engler JO, Rödder D, Secondi J. Mapping species distributions with MAXENT using a geographically biased sample of presence data: A performance assessment of methods for correcting sampling bias. PLOS ONE. 2014; 9: 1–13.
45. Stolar J, Nielsen SE. Accounting for spatially biased sampling effort in presence-only species distribu-tion modelling. Divers Distrib. 2014; 21: 595–608.
46. Milanesi P, Holderegger R, Caniglia R, Fabbri E, Randi E. Different habitat suitability models yield dif-ferent least-cost path distances for landscape genetic analysis. Basic Appl Ecol. 2015;http://dx.doi. org/10.1016/j.baae.2015.08.008.
47. Calenge C, Dufour A, Maillard D. K-select analysis: A new method to analyse habitat selection in radio-tracking studies. Ecol Model. 2005; 186: 143–153.
48. Calenge C, Darmon G, Basille M, Loison A, Jullien J. The factorial decomposition of the Mahalanobis distances in habitat selection studies. Ecology. 2008; 89: 555–566. PMID:18409444
49. Balestrieri A, Remonti L, Morotti L, Saino N, Prigioni C, Guidali F. Multilevel habitat preferences of Apodemus sylvaticusandClethrionomys glareolusin an intensively cultivated agricultural landscape. Ethol Ecol Evol. 2015;
50. Zuur AF, Ieno EN, Elphick CS. A protocol of data exploration to avoid common statistical problems. Methods Ecol Evol. 2010; 1: 3–14.
51. Dormann CF, McPherson JM, Araújo MB, Bivand R, Bolliger J, Carl G, et al. Methods to account for spatial autocorrelation in the analysis of species distributional data: a review. Ecography. 2007; 30: 609–628.
52. Ripley BD. Pattern recognition and neural networks. Cambridge: Cambridge University Press; 2007. 53. Friedman JH. Greedy function approximation: a gradient boosting machine. Ann Stat. 2001; 29:
1189–1232.
54. Breiman L, Friedman JH, Olshen RA, Stone CJ. Classification and regression trees. New York: Chapman and Hall; 1984.
55. Hastie T, Tibshirani R, Buja A. Flexible discriminant analysis by optimal scoring. J Am Statist Assoc. 1994; 89: 1255–1270.
56. Hastie TJ, Tibshirani R. Generalized additive models. London: Chapman and Hall; 1990. 57. McCullagh P, Nelder JA. Generalized linear models. London: Chapman and Hall; 1989. 58. Friedman L. Multivariate additive regression splines. Ann Stat. 1991; 1: 1–67.
59. Breiman L. Random forests. Mach Learn. 2001. 45: 5–32.
61. Thuiller W, Georges D, Engler R. BIOMOD2: Ensemble platform for species distribution modeling. R package version, 2(7), r560; 2013.
62. De Marco P, Diniz-Filho JA, Bini LM. Spatial analysis improves species distribution modelling during range expansion. Biol Lett. 2008; 4: 577–580. doi:10.1098/rsbl.2008.0210PMID:18664417
63. Fawcett T. ROC graphs: notes and practical considerations for data mining researchers. Netherlands: Kluwer Academic; 2004.
64. Ko CY, Root TL, Lee PF. Movement distances enhances validity of predictive models. Ecol Model. 2011; 222: 947–954.
65. Swets KA. Measuring the accuracy of diagnostic systems. Science. 1988; 240: 1285–1293. PMID:
3287615
66. Boyce MS, Vernier PR, Nielsen SE, Schmiegelow FKA. Evaluating resource selection functions. Ecol Model. 2002; 157: 281–300.
67. Broenniman O, Petitpierre B, Randin C, Engler R, Breiner F, D’Amen M, et al. ECOSPAT: Spatial ecology miscellaneous methods. R package version 1.0; 2014.
68. Williams JN, Seo C, Thorne J, Nelson JK, Erwin S, O’Brien JM, et al. Using species distribution mod-els to predict new occurrences for rare plants. Divers Distrib. 2009; 15: 565–576.
69. Hilty JA, Merenlender AM. Use of riparian corridors and vineyards by mammalian predators in North-ern California. Conserv Biol. 2004; 18: 126–135.
70. Doyle A. Use of riparian and upland habitats by small mammals. J Mammal. 1990; 71: 14–23. 71. Baldwin RA, Bender LC. Distribution, occupancy, and habitat correlates of American martens (Martes
americana) in Rocky Mountain National Park, Colorado. J Mammal. 2008; 89: 419–427.
72. Buskirk SW. Conserving circumboreal forests for martens and fishers. Conserv Biol. 1992; 6: 318– 320.
73. Zalewski A, Jedrzejewski W. Spatial organisation and dynamics of the pine martenMartes martes population in Bialowieza Forest (E Poland) compared with other European woodlands. Ecography. 2006; 29: 31–43.
74. Vergara M, Cushman SA, Urra F, Ruiz-González A. Shaken but not stirred: multiscale habitat suitabil-ity modeling of sympatric marten species (Martes martesandMartes foina) in the northern Iberian Peninsula. Landscape Ecol. 2015; doi:10.1007/s10980-015-0307-0
75. Wereszczuk A, Zalewski A. Spatial Niche Segregation of Sympatric Stone Marten and Pine Marten– Avoidance of Competition or Selection of Optimal Habitat? PLOS ONE. 2015; 10(10):e0139852, doi:
10.1371/journal.pone.0139852PMID:26444280
76. Larroque J, Ruette S, Vandel J-M, Devillard S. Where to sleep in a rural landscape? A comparative study of resting sites pattern in two syntopicMartesspecies. Ecography. 2015; 38: 1–12.
77. Pereboom V, Mergey M, Villerette N, Helder R, Gerard JF, Lodé T. Movement patterns, habitat selec-tion, and corridor use of a typical woodland-dweller species, the European pine marten (Martes martes), in fragmented landscape. Can J Zool. 2008; 86: 983–991.
78. Cushman SA, Raphael MG, Ruggiero LF, Shirk AJ, Wasserman TN, O’Doherty EC. Limiting factors and landscape connectivity: the American marten in the Rocky Mountains. Landscape Ecol. 2011; 26: 1137–1149.
79. Larroque J, Ruette S, Vandel J-M, Devillard S. Divergent landscape effects on genetic differentiation in two populations of the European pine marten (Martes martes). Landscape Ecol. 2015; doi:10.1007/ s10980-015-0281-6
80. Tattersall FH, Mcdonald DW, Hart BJ, Johnson P, Manley W. Is habitat linearity important for small mammal communities on farmland? J Appl Ecol. 2002; 39: 643–652.
81. Sidorovich VE, Krasko DA, Dyman AA. Landscape-related differences in diet, food supply and distri-bution pattern of the pine marten,Martes martesin the transitional mixed forest of northern Belarus. Folia Zool. 2005; 54: 39–52.
82. Caryl FM, Quine CP, Park KJ. Martens in the matrix: the importance of nonforested habitats for forest carnivores in fragmented landscapes. J Mamm. 2012; 93: 464–474.
83. Althoff DP, Storm GL, Dewalle DR. Daytime habitat selection by cottontails in central Pennsylvania. J Wildl Manage. 1997; 61: 450–459.
84. Balestrieri A, Remonti L, Ruiz- González A, Vergara M, Capelli E, Gómez -Moliner BJ, et al. Food hab-its of genetically identified pine marten (Martes martes) expanding in agricultural lowlands (NW Italy). Acta Theriol. 2011; 56: 199–207.
86. Ascensao F, Grilo C, LaPoint S, Tracey J, Clevenger AP, Santos-Reis M. Inter-Individual Variability of Stone Marten Behavioral Responses to a Highway. PLOS ONE. 2014; 9(7):e103544. doi:10.1371/ journal.pone.0103544PMID:25072639
87. Araújo MB Pearson RG, Thuiller W, Erhard M. Validation of species-climate impact models under cli-mate change. Global Change Biol. 2005; 11: 1504–1513.
88. Falcucci A, Maiorano L, Tempio G, Boitani L, Ciucci P. Modeling the potential distribution for a range-expanding species: Wolf recolonization of the Alpine range. Biol Conserv. 2013; 158: 63–72. 89. Araújo MB, Guisan A. Five (or so) challenges for species distribution modelling. J Biogeogr. 2006; 33:
1677–1688.
90. Araújo MB, Whittaker RJ, Ladle RJ, Erhard M. Reducing uncertainty in projections of extinction risk from climate change. Global Ecol Biogeogr. 2005; 14: 529–538.
91. Aertsen W, Kint V, Van Orshoven J, Muys B. Evaluation of modelling techniques for forest site produc-tivity prediction in contrasting ecoregions using stochastic multicriteria acceptability analysis (SMAA). Environ Modell Softw. 2011; 221: 1119–30.
92. Kampichler C, Wieland R, Calmé S, Weissenberger H, Arriaga-Weiss S. Classification in conserva-tion biology: a comparison of five machine-learning methods. Ecol Inform. 2010; 254: 390–406. 93. Marmion M, Luoto M, Heikkinen RK, Thuiller W. The performance of state-of-the-art Modelling
tech-niques depend on geographical distribution of species. Ecol Model. 2009; 6: e24233.
94. Li X, Wang Y. Applying various algorithms for species distribution modelling. Integr Zool. 2012; 8: 124–135.
95. Ducci L, Agnelli P, Di Febbraro M, Frate L, Russo D, Loy A, et al. Different bat guilds perceive their habitat in different ways: a multiscale landscape approach for variable selection in species distribution modelling. Landscape Ecol. doi:10.1007/s10980-015-0237-x
96. Di Febbraro M, Roscioni F, Frate L, Carranza ML, De Lisio L, De Rosa D, et al. Long-term effects of traditional and conservation-oriented forest management on the distribution of vertebrates in Mediter-ranean forests: a hierarchical hybrid modelling approach. Diversity Distrib. 2015: 1–14.
97. Bon M, Pascotto E, TomèP, Fasano D. Lo scoiattolo comune in pianura veneta: storia di una recente e pacifica invasione. VIII Congresso dell’Associazione Teriologica Italiana, Piacenza, 9–11 May 2012.
98. Lapini L, Molinari P, Dorigo L, Are G, Beraldo P. Reproduction of the golden jackal (Canis aureus mor-eoticusI. Geoffroy Saint Hilaire, 1835) in Julian pre-Alps, with new data on its range-expansion in the high-Adriatic hinterland (Mammalia, Carnivora, Canidae). Boll Mus civ St nat Venezia. 2009; 60: 169–186.
99. Šálek M,Červinka J, Padyšáková E, Kreisinger J. Does spatial co-occurrence of carnivores in a Cen-tral European agricultural landscape follow the null model? Eur J Wildl Res. 2014; 60: 99–107. 100. Barrull J, Mate I, Ruiz-Olmo J, Casanovas JG, Gosàlbez J, Salicrú M. Factors and mechanisms that
explain coexistence in a Mediterranean carnivore assemblage: an integrated study based on camera trapping and diet. Mamm Biol. 2014; 79(2): 123–131.