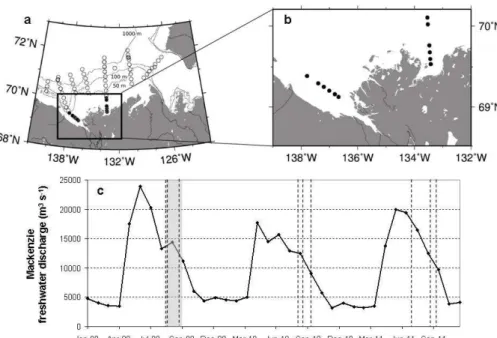
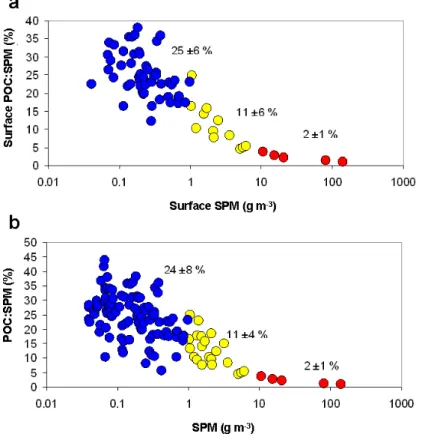
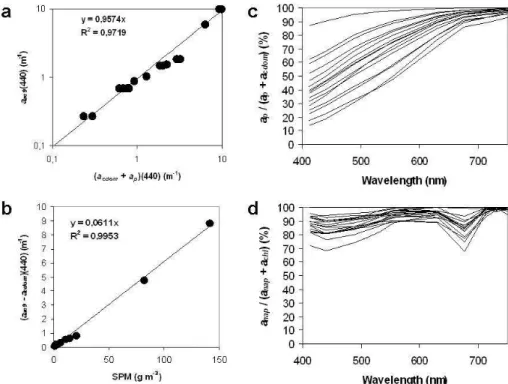
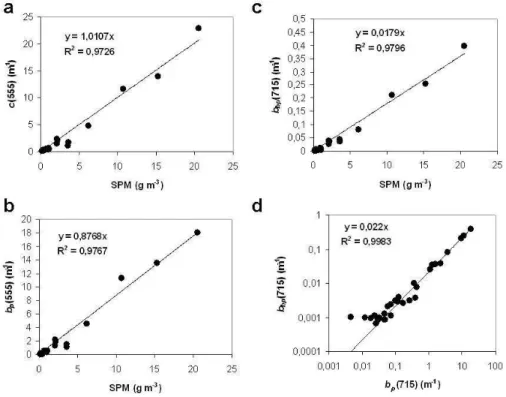
Remote sensing the dynamics of suspended particles in the Mackenzie River plume (Canadian Arctic Ocean)
Texto
Imagem

Documentos relacionados
The probability of attending school four our group of interest in this region increased by 6.5 percentage points after the expansion of the Bolsa Família program in 2007 and
Além disso, o Facebook também disponibiliza várias ferramentas exclusivas como a criação de eventos, de publici- dade, fornece aos seus utilizadores milhares de jogos que podem
Following the Uses and Gratifications approach and the Consumers’ Online Brand-Related Activities framework, seven motivations (Information, Entertainment, Personal
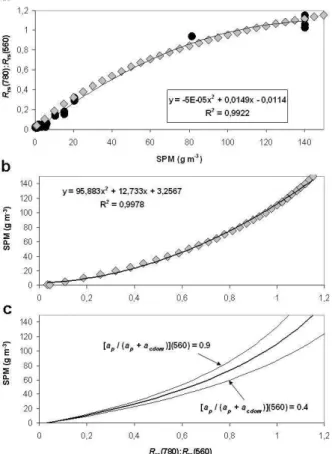
Through experiments with the standard surface reflectance product of MODIS and the estimated remote sensing reflectance based on SeaDAS processing software, and the
Ousasse apontar algumas hipóteses para a solução desse problema público a partir do exposto dos autores usados como base para fundamentação teórica, da análise dos dados
The objective of this work was to evaluate the relationship between different remote sensing data, derived from satellite images, and interrill soil losses obtained in the field
In the light of the technological transformations that have been occurring in the field of Remote Sensing, the objective of this study was to evaluate the feasibility and the
Aiming at the construction of the geo-scientific perspective at school, the environmental education projects made use of different field practices based on remote sensing
